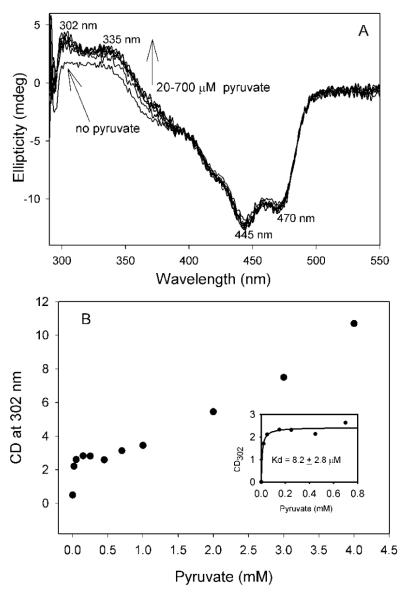
Figure 8.
CD titration of I393A GCL by pyruvate at 6 °C. (A) CD spectra of I393A GCL (2.0 mg/mL, concentration of active centers = 30.8 μM) in 0.1 M KH2PO4 (pH 7.6) containing 0.5 mM ThDP, 2.5 mM MgCl2, 1.0 mM DTT and 10 μM FAD in the absence and in the presence of 0.020-0.70 mM pyruvate. Each spectrum was recorded after pre-incubation of I393A GCL with pyruvate for 20 min at 6 °C. (B) Dependence of the ellipticity at 302 nm on pyruvate concentration. Inset shows the plot of the CD302 data points versus [pyruvate] at concentrations less than 0.80 mM. Data were fitted to a Hill equation (3).

