

Abstract
Motivation: Pairwise experimental perturbation is increasingly used to probe gene and protein function because these studies offer powerful insight into the activity and regulation of biological systems. Symmetric two-dimensional datasets, such as pairwise genetic interactions are amenable to an optimally designed measurement procedure because of the equivalence of cases and conditions where fewer experimental measurements may be required to extract the underlying structure.
Results: We show that optimal experimental design can provide improvements in efficiency when collecting data in an iterative manner. We develop a method built on a statistical clustering model for symmetric data and the Fisher information uncertainty estimates, and we also provide simple heuristic approaches that have comparable performance. Using yeast epistatic miniarrays as an example, we show that correct assignment of the major subnetworks could be achieved with <50% of the measurements in the complete dataset. Optimization is likely to become critical as pairwise functional studies extend to more complex mammalian systems where all by all experiments are currently intractable.
Contact: fergal.p.casey@gmail.com
Supplementary information: Supplementary data are available at Bioinformatics online.
1 INTRODUCTION
Systematic study of the effects of disrupted gene activity has naturally followed the completion of whole-genome sequencing projects beginning in the 1990s. Pairwise analysis of these disruptions (e.g. using knockout, RNAi or drugs), can yield information on the nature of how genes (or gene products) interact through examination of their combined effect on a measurable phenotype, most commonly growth rate. Studies, such as synthetic genetic arrays (Boone et al., 2007; Davierwala et al., 2005), drug–drug interaction experiments (Lehar et al., 2007; Yeh et al., 2006) or epistatic miniarray profiles (Collins et al., 2007; Schuldiner et al., 2005) have provided biological insight not only at the level of the individual pair of genes, but also at the level of protein pathways, macromolecular complexes and cellular networks.
However, the experimental scale of these techniques is often prohibitive. Methods such as pooling deconvolution for combinatorial chemistry and two-hybrid screening (Janda, 1994; Jin et al., 2007), and design methods for achieving good coverage in protein physical interaction networks (Lappe and Holm, 2004) have been developed, but little attention has been paid to the design of pairwise experimental assays. The experimental scale also limits the complexity of the phenotypic read-out, for example, sampling drugs at only one dose, or genes at only one fixed level of down-regulation. Thus, studying functional interactions for many pairs of entities, for example, genes or drugs, becomes laborious as the total number of entities becomes large. If some genetic profiles are more informative than others in an interaction experiment, then by targeting these genes as early as possible for a complete set of measurements, one may recover the same functional associations with fewer overall measurements. This task is distinct from that of variable selection (Raftery and Dean, 2006), which when applied to pairwise interaction datasets will have the unwanted effect of completely removing genetic profiles.
Here, we propose an iterative experimental design, and evaluate its performance with both simulated and actual data. The general principle is illustrated in Figure 1. Interaction profiles across the entire set of genes are obtained for an initial core set of genes which may have been chosen at random. Then, the information available from partial profiles of the remaining genes is used to decide which one is measured next. The most informative genes have their full profiles sequentially added, one at a time. At each step, the interaction matrix is updated to identify which genes should be added subsequently. The procedure may be stopped after a predetermined number of genes have complete profiles determined, decided in advance based on the available resources.
Fig. 1.

Designed versus random selection of profiles. The partially sampled genetic interactions should be designed to include the most informative genes from the full dataset. Genetic interactions measured by colony size comparison to background (Schuldiner et al., 2005). Brighter areas denote increased/decreased relative growth in a 50 by 50 subset of original dataset.
There are two major issues in developing such an experimental design: first, what are the criteria that distinguish informative versus less interesting genes, and second, for evaluation of the method's performance, what are the criteria that determines how well the incomplete data represents the full data? Here, we investigated three measures to distinguish genes, the first being a measure of the uncertainty of the grouping of a given gene, the second a more computationally efficient approximation to that uncertainty and the third being the SD (standard deviation) of the responses for a gene. To evaluate the informativeness of partial matrices with respect to the full matrix, we compared the similarity of the clustering obtained from each, treating unmeasured interactions as missing values.
We investigated the performance of the methods on simulated data, and on published epistatic mini-array profile (E-MAP) datasets. The E-MAPs consist of quantitative phenotypic readouts (colony sizes) for a set of pairwise genetic knockouts or knockdowns in 424 yeast genes involved in early secretory pathway (Schuldiner et al., 2005) and 754 genes involved in chromosome organization (Collins et al., 2007).
We propose efficient approaches to the design of such experiments, which rely on avoiding experiments that are largely uninformative or redundant. When applied to yeast E-MAP data, we conclude that optimal design increases the feasibility of large-scale experiments. This will become particularly important when the design space is expanded further, for example, in drug–drug interaction experiments involving varying dosages (Lehar et al., 2007).
2 METHODS
2.1 Information measures
We propose three measures of information for partial profiles, described in the following three subsections. The design protocol consists of selecting partial profiles with maximum information at every experimental step. The first information measure is based on a statistical model for clustering, and the other two are heuristics that aim to provide efficient, easy-to-evaluate information measures. We found all three information measures performed well.
2.2 Information based on uncertainty in cluster membership probabilities, U
Our first measure of information is based on the uncertainty in cluster membership probabilities for each profile in an array of pairwise interactions, U. For a given partially filled data array, we say that profile i is most informative if its uncertainty is least, i.e. U is a minimum over all i. To formally assess the uncertainty in the cluster memberships, we need to cast the clustering solution as the maximum likelihood estimate of a statistical model. Then, we employ standard statistical techniques for estimating uncertainties given a likelihood function.
2.2.1 Model-based clustering
Model-based clustering is a framework for describing and fitting groups within a multivariate dataset by assuming a mixture model for the underlying distribution of points. There is a large literature discussing its utility, which is described elsewhere (Fraley, 1998a, b).
We write the data as Y = {yi}i=1n, each yi ∈ ℝn. We can think of Y as a symmetric matrix, Y=YT. We assume a simple mixture model based on a sum of g multivariate normal (MVN) distributions, f, to describe the joint probability density function of the data, l :
Φ = (π,m,s2) = (π1,…,πg,m1,…,mg,s21,…,s2g) where π = (π1,…,πg) are the a priori probabilities of being in each group, mh = (mh1,…,mhn) is the mean vector for group h and s2h = (s2h1,…,s2hn) is a vector of the non-zero elements in the diagonal covariance matrix for group h. Note that we are assuming a diagonal covariance matrix that is sufficient to describe the data within each group. Given the symmetric form for the interaction data, Y, the set of parameters taken together must reflect that symmetry. Therefore, we define a symmetric matrix of all the mean parameters
 |
and a corresponding matrix for the variance parameters
 |
This form has the following interpretation: μii is the average within group i interaction, μij is the average group i, group j interaction. The σ2 are the corresponding variances. An example of a clustered dataset and the underlying noiseless (σ2 = 0) model prediction is shown in Figure S2.
Fig. 2.

Improvement in cluster membership assignments when adding most informative genes, as determined by σ or F , compared with random selection for yeast secretory pathway dataset. Curves are averaged over five replicate experiments starting from an initial set of 20 randomly chosen complete profiles.
Given a hard clustering k(i) ∈ {1,…,g}, we then have for group h,mh = (μhk(1),…,μhk(n)) and s2h = (σ2hk(1),…,σ2hk(n)). If B is an indicator matrix that represents hard cluster memberships, such that Bij = 1 means gene i is in group j, then this can be written more succinctly as mh = (Bμ).h and s2h = (Bσ2).h where the subscript denotes the h-th column of the matrix. The likelihood for the dataset is
| (1) |
| (2) |
and log likelihood
| (3) |
where zij is the probability that yi is in group j and is equivalent to the first formulation only when zij is an indicator matrix. The second formulation allows the problem to be set up as an incomplete data problem where the zij matrix itself needs to be estimated from the observations. It can be shown that for a fixed set of parameters zij is estimated by τij=τi(yj|Φ).
Now we identify the uncertainty in the cluster memberships, στij = Var(τij) as an appropriate measure of information in a given dataset. In particular, if U = ∑j στij is small we claim that profile yi is a high information content profile and vice versa.
Because the MVN distribution is high dimensional (e.g. n = 424 for the E-MAP yeast early secretory pathway genes), the τij actually almost always takes values {0, 1}, i.e. hard boundaries exist, which has been previously noted (Draper et al., 2005). We can enforce this as a condition, by choosing the closest {0, 1} matrix that approximates τij, which simplifies both the fitting problem and the uncertainty estimates discussed below.
2.2.2 Expectation Maximization algorithm
The log of the likelihood function can be maximized with respect to parameters, Φ in two steps (Dempster et al., 1977).
Evaluate τij for the current set of parameters Φt, to give zij(Φt).
Maximize Equation (3) with respect to Φ keeping zij fixed, i.e. maximize Q(Φ) = ∑i=1n ∑j=1g zijlog (πjf(yi|mi,s2i)) to give Φt+1.
Repeat until parameter values change by sufficiently small amount.
Letting A represent the n × g zij matrix, B represent the closest {0, 1} matrix to this (hard clustering), Y2 is the square of Y elementwise and μ2 is the elementwise square of μ the update formulas for the μ and σ matrices (the M-step) can be written in matrix form as
| (4) |
| (5) |
where • implies elementwise multiplication, and 1 is an n × n matrix of ones. For data with missing values, where the missing values are represented by 0, the only modification is that 1 is replaced with a n × n mask matrix, C. That is, Cij = 0 means that Yij is a missing value, otherwise Cij = 1. However, this replacement occurs only in the denominator of the μ equation and the numerator of the σ equation. We have found in practice that this optimization of the likelihood function does not significantly improve the uncertainty estimates for cluster membership, and is significantly slower than merely choosing the hierarchical clustering solution to define model parameters.
2.2.3 Evaluating U
Before we compute the parameter uncertainties from the Fisher information, we fit the model described above to the given dataset, corresponding to maximizing the likelihood. Since we are assuming hard boundaries for the groupings, this process is greatly simplified by using a hierarchical clustering solution to provide initial estimates for Φ,Φ* = (π*,μ*,σ*). No improvement was found in using the EM algorithm to refine the solution.
We then estimate the uncertainty in the cluster memberships, στij, by using an approximation based on the Fisher information matrix (FIM) (Casella and Berger, 1983). Given a log likelihood function, l(Φ) = log(L(Φ)), the Fisher information, F is given by
Then the parameter covariance matrix is provided by Var(Φ)≈F−1 and any function of the parameters h(Φ) has an approximate variance
We would like to let h(Φ) = τij(Φ), because then Var(h(Φ)) = στij is the quantity measuring cluster membership uncertainty. Unfortunately, if we assume {0, 1} values for the τij, the uncertainty derived from this linearized formula is identically zero, for all (i,j). Therefore we use the more accurate but computationally slower approach of simulating normally distributed parameter sets with mean Φ* and covariance given by F−1, and then computing the sample variance for τij using those parameter sets.
The FIM takes on a diagonal form, if we assume {0, 1} cluster memberships and diagonal covariance matrices. Given the parameters in a vector form Φ=(π1,…,πg,μ11,…,μgg,σ211,…,σ2gg) the FIM is
where ni is the number of genes in group i,nij is the total number of non-missing values in the intersection of group i and group j and tij is the total number of values (missing and non-missing) in the intersection of group i and group j. Note that for the diagonal blocks where i = j, the total number of entries in a block is divided by two because of symmetry.
Interestingly, the model uncertainty is unaffected by which particular data values are missing. Instead it depends on how many missing values are there within clusters and blocks, ni and nij, and on the cluster variances, σ2ij.
When an estimate for the cluster membership uncertainties, στij, is obtained, we compute the uncertainty in profile i as U = ∑j στij. The most informative profile is that which has U at a minimum over all i.
We found the evaluation of U to be computationally prohibitive for large datasets, so we sought more easily evaluated information measures with comparable performance, by a mixture of numerical tests and inspection of the form of information measure based on the statistical model. This leads to the following two heuristics.
2.3 Fuzziness of cluster memberships, F
For the first heuristic, we observed that the non-zero entries in στij almost always occur for those profiles in τij that do not have simple {0, 1} cluster membership probabilities. As mentioned, analytic formulas for στij yield 0 when we assume hard cluster memberships, so we could conversely suggest that στij values are non-zero for those profiles that have fractional cluster membership probabilities. Intuitively, this means that the cluster memberships of profiles which belong to more than one cluster are more sensitive to parameter changes than those which almost certainly belong to one cluster. So the second approximate measure is F = ∑j − τij log(τij) which is related to Shannon information. Here F is positive, and the more positive, the more uncertain the given profile is. For an optimal design strategy, we should completely measure profile i where F is at a minimum.
2.4 SD of profile i, σ
Profiles that tend to have a higher SD are usually more informative than those with a low SD. (Heuristically, we could argue this is related to the fact that profiles with genuine signal tend to have a lot of large entries, both positive and negative, indicative of a large number of interactions, whereas signals mainly consisting of noise tend to have smaller entries in absolute value.) The second heuristic is then to measure the SD of the partial profiles in the dataset (over non-missing values) and choose the profile with highest SD, σ as being most informative.
2.5 Assessment of quality of partial dataset
To assess the information measures discussed in the previous section, we need to determine how well the partial dataset of interactions captures the associations that are found in the complete dataset. We chose to measure this by evaluating the similarity of the clustering for the partially filled array to the clustering obtained by using all the experimental data. Motivated by the Rand index similarity measure between two clusterings, we defined a metric which takes into account both the cluster memberships and the tightness of the clusters. The motivation is to have a measure that is not dependent on the overall scaling of pairwise distances between profiles, which could be quite different for very incomplete profile data and complete profile data.
Let 𝒮f be a cluster from the complete profile dataset. For any pair (i,j) of profiles in 𝒮f, we count that pair as being associated in the partial data tree if
where dp(i,j) and df(i,j) is the distance between profiles based on partial and full data, respectively.  and
and  is the average pairwise distance between all points in partial and full datasets. Informally, we require that for the partial profile data, the normalized distance between i and j is less than or equal to the normalized ‘diameter’ of cluster 𝒮f from the full information dataset.
Now we simply count the number of pairs associated in the partial profile dataset that are also associated in the complete profile dataset, over all non-singleton clusters, 𝒮f. This defines a similarity index, R and distance metric D for cluster membership as,
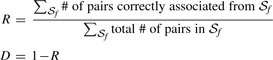 |
(6) |
2.6 Experimental protocol for sequential design
Because of the symmetric property of interaction arrays, a partial set of profiles are sufficient to perform clustering and to determine associations between cases (e.g. genes). Values that are not measured are simply denoted as missing and any metric used to compute distances between profiles automatically ignores those values. A typical symmetric heatmap representation of the interaction data with partial and complete profiles is shown in Figure S1. In this context an experimental protocol is as follows:
Begin with a subset of complete profiles chosen using a priori knowledge, or randomly. The complement of this subset are the partial profiles.
Out of the subset of partial profiles, determine which one has maximum information content, based on one of the information measures. For the information measure U
 F, this will involve taking the partial dataset, performing a clustering on it and then fitting the multivariate statistical model to it. For the information measure σ , all that needs to be computed is the SD for each partial profile.
Measure the complete profile for the most informative case found in 2, and reanalyse the associations through clustering. Repeat Steps 2 and 3 as determined by experimental resources or by choosing an arbitrary maximum decrease in information in the dataset.
While our proposed design strategy uses Fisher information uncertainty estimates with model-based clustering and heuristic approximations to these, alternative stepwise optimal design schemes are also likely to perform well. Uncertainty estimation employing resampling or bootstrap methods have less assumptions concerning data distribution and could replace Fisher information. Similarly, the multivariate normal model for clustering could be replaced with alternative statistical models which may better represent the underlying structure. In addition, development of a more general information theoretic approach to treat information in symmetric matrices may provide alternatives to our methods of assessing how well the partial matrix is indeed recovering the information of the full matrix.
2.7 Simulated data
For testing of the information measures, we considered real and simulated data. The simulated data has structured profiles and completely noisy profiles, generated as follows:
A symmetric, noise-free matrix with a fixed number of clusters was created. That is, each gene is associated to one of g clusters. All matrix entries (i,j) such that gene i is in cluster g1 and gene j is in cluster g2 are set with the same value, a normally distributed random number with mean 0 and variance v.
Small random noise was added to the matrix, preserving symmetry.
A number of rows/columns were chosen to be replaced by a random vector whose entries are normally distributed with mean 0 and variance v, but whose values are not associated with the clustering. These represent genetic profiles that are pure noise, and do not follow the pattern of interactions seen between all other genes.
2.8 GO analysis
For an appraisal of algorithm performance beyond a comparison of partial data versus full data clustering assignments, we looked for enrichment of Gene Ontology (GO) (Ashburner et al., 2000) terms amongst the genes that were selected at the early stages of the design algorithm. Recognizing that the design methodology performed best when the dataset was broken into a large number of clusters, and the clusters in that case comprise mainly of physically interacting proteins and protein complexes, we restricted the GO analysis to cellular component terms defined as yeast macromolecular complex (Yeast GO-Slim, 2008).
The calculation for GO term enrichment in subsets of 25, 50 and 100 genes picked out in the early stages of the algorithm uses standard statistical methods based on a hypergeometric null model, and the P-values are corrected for multiple testing with Bonferroni correction, which involves multiplication of the raw P-values with the number of GO terms found to be associated with the subset of genes (Boyle et al., 2004).
3 RESULTS AND DISCUSSION
We validated the design methods and information measures on both simulated data with strongly clustered components and noisy components, as well as real genetic interaction data in E-MAP arrays.
3.1 U, F and σ identify noisy profiles in simulated data with similar efficiency
To evaluate the ability of the information measures to uncover high-information versus low-information subsets of a dataset, we first performed numerical tests on simulated data in which completely noisy uninformative profiles have been inserted. The generation of simulated data is described in Section 2.
We first evaluated the ability of U, F and σ to correctly identify the noisy profiles given a partial sampling of the matrix. For random sampling of different numbers of rows/columns, we computed the sensitivity and the specificity to identify the noisy profiles. Both are reasonably high for all the information measures (Fig. S3), demonstrating that we can reliably pick out the profiles that do not belong to the underlying structure, even for very sparsely sampled data.
The next test asked whether the clustering produced by retaining a high-information subset of complete profiles is closer to the clustering produced by retaining all profiles, compared with a low-information subset. The closeness is quantified by the distance metric between two clusterings described in Section 2, Equation (6). The clustering distance correlates well with the information in the subset of profiles (measured by summing U, F or σ over all genes in the subset), Table S1. Additionally, we found that the U and F measures were highly correlated with each other (correlation=0.96 with P < 10−16), which justifies the replacement of U with the more efficiently computed F.
3.2 Selection of genes based on U, F or σ is more efficient than random selection
Given the performance of the information measures in identifying noisy profiles, and the importance of discarding noisy profiles in determining the correct cluster memberships, it suggests that a sequential design algorithm for iteratively selecting informative genes is possible. To compare the optimally chosen partial matrix to randomly chosen matrices with the same number of genes, we again rely on the cluster membership distance, Equation (6). We find that, compared to random, a sequential approach to maximize the information at every stage achieves a clustering assignment closer to that obtained from the full dataset (Fig. S4).
3.3 Optimal design based on σ is favoured for yeast secretory pathway and chromosome organization datasets
We tested these measures for improvements in efficiency on the epistatic miniarray datasets (Collins et al., 2007; Schuldiner et al., 2005). We find that using SD alone provides a very big improvement in identifying the tightest clusters, Figure 2 for both the yeast early secretory pathway and chromosome biology E-MAP (Collins et al., 2007), Figure S6. (There is no additional improvement using the model-based F measure, Fig. 2, and the U information measure is too computationally intensive to use on a dataset this size but presumably would perform similarly to F as they are closely related.)
Note that for the case when there are a large number of clusters, Figure 2, the majority of clusters are in fact singletons. These are ignored in the cluster membership calculation. Therefore, in this case we are determining only the most tightly grouped clusters which often represent genes involved in complexes or linear pathways. For physical protein interaction datasets, the average protein physical complex size is reported to be 3.1 and 4.9 subunits for the Krogan et al. (2006) and Gavin et al. (2006) datasets, respectively, and for this reason we believe it makes most sense to concentrate on the results seen for the larger numbers of clusters (with 400 clusters of the secretory pathway genes, we have an average non-singleton cluster size of 2.7, and for 500 clusters in the chromosome biology E-MAP, the average cluster size is 3.3). Fewer clusters provide more information about longer range epistasis across the network; however, we note that the stepwise procedure provides a more limited improvement over random selection when considering this smaller number of deeper clusterings (Fig. 2). This is likely to reflect in part the observation that epistatic effects are of most importance among small groups of tightly interacting proteins (Schuldiner et al., 2005).
3.4 Optimal design rapidly identifies interaction-rich subnetworks and protein complexes
It is informative to look at which gene groupings are being revealed in these optimally designed experiments and what functional categories they are enriched in. In Figure 3A, we show the mean percentage of genes selected in two important interaction-rich subgroupings in both E-MAP datasets when optimal design is performed. The first is the 71 gene Golgi/trafficking subnetwork from the early secretory pathway E-MAP (Schuldiner et al., 2005) and the second consists of the 55 gene DNA replication/repair subnetwork from the chromosome organization E-MAP (Collins et al., 2007).
Fig. 3.

(A) Optimal design efficiently enriches for functionally relevant interaction rich groups of genes. (B) Frequency histograms for GO terms appearing in the first 25, 50 and 100 iterates of designed experiments. Labels are yeast macromolecular complex GO terms and numbers. Design based on SD criterion, and significant enrichment (Bonferroni corrected P-value <0.05) is denoted by white stars. See Figure S5 for GO term enrichment with F information criterion. (A) and (B) are averages over 10 replicates of 20 randomly selected initial profiles
It is clear that there is an early enrichment of profiles selected from these groups compared with that expected by random selection. In fact, 90% of the Golgi subcluster components were correctly assigned after ∼25% equivalent of the eventual experimental workload was prioritized using the iterative design algorithm. For ∼45% of total workload, 90% of the DNA replication subcluster was selected. Thus, in both cases, a substantial component of the information could be obtained using<50% of the final experimental workload.
While this analysis shows that the optimization algorithm is capable of extracting the major subnetworks efficiently, it is also important to note that the procedure is not insensitive to smaller subnetworks. Figure 3B shows significant enrichment of certain Yeast macromolecular complex GO terms as a function of number of designed genes selected. Generally we find that the tightly clustered genetic profiles are initially selected, representing proteins belonging to complexes.
In the secretory pathway several complexes that are biologically critical and that form dense clusters in the full dataset are detected within 25 iterates, for example: the Golgi transport complex, an eight subunit complex involved in intra-Golgi transport; the GET complex involved in Endoplasmic Reticulum to Golgi trafficking; the Oligosaccharyltransferase complex and the Sec62/Sec63 complex which plays a role in targeting proteins to the ER by post-translational modification among others. Similarly, the most prominent GO terms of the final clustered dataset for the chromosomal biology E-MAP, which tends to contain a greater number of smaller clusters that reflect complexes and pathways with specialized roles in DNA replication and chromosome biology, were significantly enriched within 25 iterates.
Thus, we have demonstrated improvements in efficiency using a designed approach for collecting data from pairwise genetic interaction experiments. We evaluated both U, a rigorous measure of cluster uncertainty, and F , a computationally efficient approximation. The simple SD of the values for a gene profile proved as efficient or more efficient compared to these methods with real data.
Our method clearly focuses in quickly on the interaction-rich subsets of tightly interacting genes. It is within these interacting groups that new functional assignments are likely to be made with greater confidence. It performs well both with simulated and real yeast interaction data, clearly benefitting from the sparse interaction structure of these datasets. Since other large-scale functional interaction datasets, such as synthetic genetic arrays (SGA) (Boone et al., 2007) share this sparse topology, we believe the methods developed here are likely to be widely applicable. For practical implementation, the value of this stepwise approach is mostly likely to be seen for large numbers of sparsely interacting genes, in fact bigger than the datasets examined here where the experiments are still capable of being carried out in parallel. For knockouts of tens of thousands of genes, the experimental effort consists of batches of measurements needed to be executed sequentially, and the methods discussed here are easily adjusted to select the most informative genes for each batch.
The major benefits of our proposed method is likely to be in applications that are less easy to automate than assessments of growth rate in model unicellular organisms. In particular, knockdown experiments on larger genomes, dose varying drug–drug interaction or combined gene knockout–drug interaction experiments (Lehar et al., 2007; Lehner et al., 2006; Pan et al., 2004; St Onge et al., 2007) require considerably greater experimental effort, and the much larger space of pairwise (or higher order) interactions makes an all-against-all exhaustive design unfeasible. In those situations, where only partial sampling is possible, stepwise optimal design will be invaluable in accelerating discoveries.
ACKNOWLEDGEMENTS
The authors thank Claire Gormley for useful discussions.
Funding: Irish Research Council for Science, Engineering and Technology (IRCSET) Embark Initiative Postdoctoral Fellowship (R10657); Science Foundation Ireland Principal Investigator Grant.
Conflict of Interest: none declared.
REFERENCES
- Ashburner M, et al. Gene ontology: tool for the unification of biology. Nat. Genet. 2000;25:25–29. doi: 10.1038/75556. [DOI] [PMC free article] [PubMed] [Google Scholar]
- Boone C, et al. Exploring genetic interactions and networks with yeast. Nat. Rev. Genet. 2007;8:437–449. doi: 10.1038/nrg2085. [DOI] [PubMed] [Google Scholar]
- Boyle E, et al. Go::termfinder - open source software for accessing gene ontology information and finding significantly enriched gene ontology terms associated with a list of genes. Bioinformatics. 2004;20:3710–3715. doi: 10.1093/bioinformatics/bth456. [DOI] [PMC free article] [PubMed] [Google Scholar]
- Casella G, Berger R. Statistical Inference. Belmont, CA, USA: Duxbury Press; 1983. [Google Scholar]
- Collins S, et al. Functional dissection of protein complexes involved in yeast chromosome biology using a genetic interaction map. Nature. 2007;446:806–810. doi: 10.1038/nature05649. [DOI] [PubMed] [Google Scholar]
- Davierwala A, et al. Systematic yeast synthetic lethal and synthetic dosage lethal screens identify genes required for chromosome segregation. Nat. Genet. 2005;37:1147–52. doi: 10.1073/pnas.0503504102. [DOI] [PMC free article] [PubMed] [Google Scholar]
- Dempster A, et al. Maximum likelihood from incomplete data via the EM algorithm. J. R. Stat. Soc. Ser. B. 1977;39:1–38. [Google Scholar]
- Draper B, et al. EM in high-dimensional spaces. IEEE Trans. Syst. Man Cybern. Part B. 2005;35:571–577. doi: 10.1109/tsmcb.2005.846670. [DOI] [PubMed] [Google Scholar]
- Fraley C. Algorithms for model-based gaussian hierarchical clustering. SIAM J. Sci. Comput. 1998a;20:270–281. [Google Scholar]
- Fraley C. How many clusters? Which clustering method? Answers via model-based cluster analysis. Comput. J. 1998b;41:578–588. [Google Scholar]
- Gavin AC, et al. Proteome survey reveals modularity of the yeast cell machinery. Nature. 2006;440:631–636. doi: 10.1038/nature04532. [DOI] [PubMed] [Google Scholar]
- Janda K. Tagged versus untagged libraries: methods for the generation and screening of combinatorial chemical libraries. Proc. Natl Acad. Sci. USA. 1994;91:10779–10785. doi: 10.1073/pnas.91.23.10779. [DOI] [PMC free article] [PubMed] [Google Scholar]
- Jin F, et al. A yeast two-hybrid smart-pool-array system for protein-interaction mapping. Nat. Methods. 2007;4:405–407. doi: 10.1038/nmeth1042. [DOI] [PMC free article] [PubMed] [Google Scholar]
- Krogan NJ, et al. Global landscape of protein complexes in the yeast Saccharomyces cerevisiae. Nature. 2006;440:637–643. doi: 10.1038/nature04670. [DOI] [PubMed] [Google Scholar]
- Lappe M, Holm L. Unraveling protein interaction networks with near-optimal efficiency. Nat. Biotechnol. 2004;22:98–103. doi: 10.1038/nbt921. [DOI] [PubMed] [Google Scholar]
- Lehar J, et al. Chemical combination effects predict connectivity in biological systems. Mol. Syst. Biol. 2007;3:80. doi: 10.1038/msb4100116. [DOI] [PMC free article] [PubMed] [Google Scholar]
- Lehner B, et al. RNAi screens in Caenorhabditis elegans in a 96-well liquid format and their application to the systematic identification of genetic interactions. Nat. Protoc. 2006;1:1617–1620. doi: 10.1038/nprot.2006.245. [DOI] [PubMed] [Google Scholar]
- Pan X, et al. A robust toolkit for functional profiling of the yeast genome. Mol. Cell. 2004;16:487–496. doi: 10.1016/j.molcel.2004.09.035. [DOI] [PubMed] [Google Scholar]
- Raftery A, Dean N. Variable selection for model-based clustering. J. Am. Stat. Assoc. 2006;101:168–178. [Google Scholar]
- Schuldiner M, et al. Exploration of the function and organization of the yeast early secretory pathway through an epistatic miniarray profile. Cell. 2005;123:507–519. doi: 10.1016/j.cell.2005.08.031. [DOI] [PubMed] [Google Scholar]
- St Onge R, et al. Systematic pathway analysis using high-resolution fitness profiling of combinatorial gene deletions. Nat. Genet. 2007;39:199–206. doi: 10.1038/ng1948. [DOI] [PMC free article] [PubMed] [Google Scholar]
- Yeast GO-Slim. Yeast macromolecular complex go slim. 2008 Available at ftp://genome-ftp.stanford.edu/pub/yeast/data_download/literature_curation/go_protein_complex_slim.tab(last accessed date July 2008) [Google Scholar]
- Yeh P, et al. Functional classification of drugs by properties of their pairwise interactions. Nat. Genet. 2006;38:489–494. doi: 10.1038/ng1755. [DOI] [PubMed] [Google Scholar]