

Abstract
Celiac disease (CD) is frequently diagnosed in patients with type 1 diabetes (T1D), and T1D patients can exhibit Abs against tissue transglutaminase, the auto-antigen in CD. Thus, gliadin, the trigger in CD, has been suggested to have a role in T1D pathogenesis. The objective of this study was to investigate whether gliadin contributes to enteropathy and insulitis in NOD-DQ8 mice, an animal model that does not spontaneously develop T1D. Gliadin-sensitized NOD-DQ8 mice developed moderate enteropathy, intraepithelial lymphocytosis, and barrier dysfunction, but not insulitis. Administration of anti-CD25 mAbs before gliadin-sensitization induced partial depletion of CD25+Foxp3+ T cells and led to severe insulitis, but did not exacerbate mucosal dysfunction. CD4+ T cells isolated from pancreatic lymph nodes of mice that developed insulitis showed increased proliferation and proinflammatory cytokines after incubation with gliadin but not with BSA. CD4+ T cells isolated from nonsensitized controls did not response to gliadin or BSA. In conclusion, gliadin sensitization induced moderate enteropathy in NOD-DQ8 mice. However, insulitis development required gliadin-sensitization and partial systemic depletion of CD25+Foxp3+ T cells. This humanized murine model provides a mechanistic link to explain how the mucosal intolerance to a dietary protein can lead to insulitis in the presence of partial regulatory T cell deficiency.
The environmental factors that trigger most autoimmune diseases remain unknown. One exception is celiac disease (CD), which is one of the most common autoimmune disorders (1). CD is caused by the ingestion of gluten, a mixture of wheat proteins composed of gliadin and glutenin (1–4). Genetic factors also have a crucial role in CD pathogenesis (4). Almost all patients with CD carry HLA-DQ2 or HLA-DQ8, and these alleles contribute 40% of disease susceptibility (5). HLA-DQ8 and -DQ2 heterodimers confer susceptibility to CD by presenting a set of toxic gliadins and glutenins to specific CD4+ T lymphocytes. Adult CD diagnoses have dramatically increased in North America because of increased diagnostic efficiency and increased prevalence. CD is now a public health concern with a prevalence of ~1% among North Americans (2, 6).
Type 1 diabetes (T1D) is an autoimmune disease that results from a T cell-mediated attack of β cells in pancreatic islets. As with CD, there is a strong genetic component to T1D, of which the HLA class II genes DQ and DR play a major role (7). These susceptibility genes are thought to be important regulators of immune responses (8). However, the declining proportion of newly diagnosed disease in children with high-risk genotypes suggests that environmental factors have an important pathogenic role in T1D, but the exact triggers remain largely unclear (9).
CD and T1D are comorbid conditions (10–12). CD is diagnosed in 3–11% of T1D patients, and ~10% of children and 2% of adults with T1D exhibit Abs against tissue transglutaminase (tTG), the autoantigen in CD (3, 10, 13–15). The association between CD and T1D has been attributed to their similar genetic basis (16–18). HLA haplotypes, such as DR3-DQ2, have been associated with defective oral tolerance and enhanced immune responses to dietary proteins (19, 20). Intriguingly, parallel birth cohort studies showed that infants at genetic risk for CD and T1D are at greater risk of either disease when exposed early to dietary cereals (21, 22). A genotyping study that enrolled 8064 T1D patients and 9339 control subjects showed that patients with T1D and CD express seven common alleles that regulate autoimmune responses (23, 24). Thus, genetic predisposition may confer susceptibility through DQ2/DQ8 HLA and non-HLA mechanisms that involve dysregulated immune responses to gut-encountered Ags (25). Studies in clinical and T1D animal models have proposed that exposure to gliadin in the diet contributes to diabetes in genetically susceptible hosts (22, 23, 26–29).
In this study, we used mice that lack all mouse endogenous class II molecules, but express the human DQ8 gene, in the autoimmune predisposing background of NOD mice (30) to investigate the role of gliadin-sensitization in the development of enteropathy and insulitis. In contrast to NOD mice, a validated animal model of diabetes (31, 32), NOD-DQ8 mice do not spontaneously develop diabetes (33, 34). Our findings demonstrate that gliadin-sensitization resulted in barrier dysfunction and moderate enteropathy, but no insulitis. However, a partial depletion of regulatory T cells before gliadin sensitization induced severe insulitis. The presence of gliadin-responsive T cells in the pancreatic lymph nodes (PLNs) of mice that develop insulitis suggests that gliadin-specific T cell reactivity has a role in insulitis development in this model.
Materials and Methods
Mice
Transgenic male mice that express HLA-DQ8 in an endogenous MHC class II-deficient background were backcrossed to NOD mice for 10 generations and intercrossed to produce congenic NOD AB° DQ8 mice (33). Eight- to 10-wk-old male mice were used for experiments. Mice were weaned and maintained on a low-fat (4.4%), gluten-free diet, purchased from Harlan Laboratories and bred in a conventional, specific pathogen-free colony at McMaster University. Fourteen-week-old male NOD mice, 6-wk-old NOD mice, and 14-wk-old nonobese resistant (NOR) mice (obtained from Dr. J. Danska, Hospital for Sick Children, Toronto, ON, Canada) were used in additional experiments as positive and negative controls, respectively, for the development and evaluation of insulitis. Glycemic status was monitored weekly using a glucometer (Abbott Diabetes Care) and was determined at the time of sacrifice using a Roche modular instrument. All experiments were conducted with approval from the McMaster University Animal Care Committee.
Anti-CD25 Ab treatment
Prior to gliadin sensitization, mice received two i.p. injections of mono-clonal anti-CD25 Abs (PC61, 250 μg; Leinco Technologies, St. Louis, MO), 1 wk apart. This procedure induces a partial depletion of CD4+ CD25+Foxp3+ T cells and induces an immune dysregulation. Control groups were pretreated with two i.p. injections of PBS (250 μl) 1 wk apart.
Gliadin sensitization
One week after anti-CD25 Ab treatment, mice were sensitized with a peptic-tryptic digest of gliadin (PT-gliadin). PT-gliadin was prepared as described previously (35). Gliadin (Sigma-Aldrich) was dissolved in endotoxin-free 0.2 N HCl for 2 h in a 37°C water bath with 1 g pepsin (Sigma-Aldrich). After 2 h of digestion, the pH was adjusted to 7.4 using endotoxin-free 2 M NaOH. Trypsin (Sigma-Aldrich) was added, the solution was boiled vigorously for 30 min, and the PT-gliadin was stored at −20°C. To sensitize the mice, they were gavaged with 500 μg PT-gliadin plus 25 μg cholera toxin (Sigma-Aldrich) once per week for 3 wk. Gliadin-sensitized mice were switched to a gluten-containing diet at the time of sensitization. Another set of mice was sensitized with 500 μg BSA (Sigma-Aldrich) plus 25 μg cholera toxin once per week for 3 wk. Control groups were gavaged with 25 μg cholera toxin only. Control groups were maintained on a gluten-free diet throughout the experiments.
Glucose tolerance test
To determine impaired glucose tolerance, mice were fasted for 6 h. Mice were then injected with glucose (Sigma-Aldrich) i.p. at a dose of 1 g/kg. Venous plasma glucose was checked prior to glucose injection, and at 20, 40, 60, 90, and 120 min after glucose injection (36). Blood glucose levels were tested using a glucometer (Abbott Diabetes Care). Glucose tolerance tests were conducted after the third gliadin-sensitization.
FACS analysis
One week after the second anti-CD25 Ab injections, cell suspensions of spleen, mesenteric lymph nodes (MLNs) and PLNs were prepared in RPMI 1640 (1% Penstrep, 10% FCS, 2 mM L-glutamine) by passing organs through a 100-μm nylon mesh screen to dissociate the cells. Suspensions were depleted of RBCs by lysis and resuspended in FACS buffer (PBS containing 0.1% azide and 2% BSA). Cells were stained with fluorochrome-labeled cell-surface Abs including CD4-allophycocyanin (RM4-5), CD8a-PerCP (53-6.7), and CD25-PE (7D4) for 30 min at 4°C (BD Biosciences-Pharmingen). For intracellular staining, cells were permeabilized using the Foxp3 staining buffer set (eBioscience) and incubated with FITC-conjugated Abs toward Foxp3 (FJK-16s; eBioscience) for 90 min at 4°C. Stained cells were acquired using the LSR II (BD Biosciences) and analyzed with FlowJo software (TreeStar).
Histologic evaluation
Cross-sections of the proximal small intestine were fixed in 10% formalin, embedded in paraffin, and stained with H&E for histologic evaluation by light microscopy. Two sections of the proximal small intestine were evaluated for evidence of inflammation, and villus-to-crypt ratios were determined. Twenty villus-to-crypt ratios were measured for each mouse in a blinded fashion. CD3+ intraepithelial lymphocytes (IELs) per 20 enterocytes in five randomly chosen villus tips were counted according to the previously described methods and expressed as IEL/100 enterocytes (37).
The pancreas was removed, fixed in 10% formalin, and embedded in paraffin. Sections of the pancreas were stained with H&E for histologic evaluation and assessment of insulitis. As described previously, insulitis was determined by evaluating islet infiltration from grade 0–4: 0, no in-filtration; 1, perivascular or periductal infiltrates; 2, leukocyte penetration of up to 25% islet mass; 3, leukocytes penetration of up to 75% of islet mass; 4, end-stage insulitis with <20% of islet mass remaining (38–40). An average insulitis score was determined for each group of mice. The liver and lungs were also removed and fixed in formalin. Sections were embedded in paraffin and stained with H&E and evaluated for signs of inflammation. Slides were viewed by light microscopy (Olympus), and images were acquired and analyzed using Image Pro Plus.
Immunohistochemistry for CD3+ cells
Immunostaining for CD3+ cells was performed on paraffin sections to detect the presence of IELs in sections of the proximal small intestine as described previously (41). Paraffin sections were incubated overnight at 4°C with rabbit anti-mouse primary Abs to CD3 (1:2000; Dako); this was followed by incubation with HRP conjugated anti-rabbit Abs. The Abs were visualized using 3-amino-9-ethylcarbazole and counterstained with Mayer hematoxylin. Negative controls were performed in the absence of primary Ab. Immunostaining for CD3+ cells was performed on paraffin sections of the pancreas as described above. Slides were viewed by light microscopy (Olympus) under 40× magnification. Images were acquired and analyzed using Image Pro Plus.
Anti-tTg ELISA
tTg was derived from guinea pig liver (Sigma-Aldrich). Transglutaminase was diluted in PBS and 0.1 μg was added to each well of a 96-well Nunc-Immuno plate (Nunc). Plates were incubated overnight at 4°C. Plates were washed five times with PBS and blocked with 1% BSA in PBS for 1 h at room temperature. Serum was added to the plates at 50 μl per well and incubated for 1 h at room temperature. Plates were washed five times, and secondary anti-mouse IgA (Sigma-Aldrich) Abs were added and incubated an additional 2 h. Secondary Abs were HRP conjugated, and tetrame-thylbenzidine was the substrate (SurModics). Positive reactivity was determined using a positive cutoff value of ≥3 SD above the mean of the control group (42).
Anti-gliadin ELISA
Gliadin (Sigma-Aldrich) was dissolved in 70% ethanol and then diluted in PBS. Ninety-six–well Nunc-Immuno plates (Nunc) were coated with gliadin by adding 5 μg to each well. The plate was incubated overnight at 4°C. Plates were washed with PBS-0.05% Tween-20 (PBS-T) and blocked using 1%BSA in PBS for 1 h at room temperature. Serum was diluted into 1% BSA in PBS either 1:10 for detection of IgA or 1:50 for detection of IgG and added to plates for 2 h at room temperature. Plates were washed with PBS-T, and HRP conjugated secondary anti-mouse IgA (Sigma-Aldrich) or anti-mouse IgG (Sigma-Aldrich) Abs were added to the wells for 1 h at room temperature. Plates were washed with PBS-T, and tetramethylbenzidine (SurModics) was used as the substrate.
Ussing chambers
Two sections of jejunum from each mouse were used for Ussing chamber experiments as described previously (41, 43). A 3–4-cm piece of jejunum was collected, cut into two sections, and placed in Krebs buffer aerated with 95% O2 and 5% CO2 (pH 7.3–7.4). Each segment of intestine was cut open along the mesenteric border to form a flat mucosal sheet and mounted into an Ussing chamber. The chamber exposed 0.6 cm2 of tissue surface area to 8 ml of circulating oxygenated Krebs buffer containing 10 mM glucose (serosal side) and 10 mM mannitol (mucosal side) maintained at 37°C. Net active transport across the epithelium was measured via a short circuit current response (Isc, μA) injected through the tissue under voltage-clamp conditions. Tissue conductance (the passive permeability to ions) was calculated using Ohm’s law. Baseline Isc (μA/cm2) and conductance (mS/cm2) were recorded at equilibrium, 20 min after mounting jejunum sections.
In vitro proliferation assay and cytokine analysis
Cell suspensions of PLNs were prepared in RPMI 1640 (1% penicillin/ streptomycin, 10% FCS, 2 mM L-glutamine) by passing organs through a 100-μm nylon mesh screen to dissociate cells. CD4+ T cells were isolated from PLNs through negative selection (EasySep Mouse CD4+ T Cell Enrichment Kit; Stemcell). Cell yield was assessed by FACS analysis, with an enriched population of 89–96% CD4+ T cells. Isolated CD4+ T cells were labeled with CFSE as previously described and washed three times with RPMI 1640 (44). Splenocytes were treated with mitomycin C (Sigma-Aldrich), and dendritic cells were isolated through positive selection (Easysep Mouse CD11c Selection Kit, Stemcell). Dendritic cells (5 × 10⁴ cells/well) were cocultured with isolated CD4+ T cells (2 × 10⁵ cells/well) in the presence of PT-gliadin (500 μg/ml), BSA (500 μg/ml), media alone in a round-bottom 96-well plate. For positive controls, cells were cultured with Con A. Cells were cultured for 4 d at 37°C, 5% CO2. Cells were harvested on day 4 to assess proliferation by FACS analysis. Cells were resuspended in FACS buffer and stained with anti–CD4-allophycocyanin (BD Biosciences-Pharmingen) and 7-AAD (Sigma-Aldrich). CFSE-labeled cells were acquired using the LSR II (BD Biosciences). Viable cells, as determined by 7AAD exclusion, were gated on CD4+ T cells. CFSE intensity for this population was determined using FlowJo software (TreeStar).
Supernatants from cell cultures were collected at 48 and 96 h. The presence of proinflammatory cytokines in the supernatant was determined using a cytometric bead array inflammation kit (BD Biosciences) and analyzed using BD FACSarray Bioanalyzer System (BD Biosciences). The presence of TGF-β was determined by ELISA (R&D Systems).
Statistical analysis
Statistical analysis was performed with GraphPad Prism software. For more than two treatment groups, an ANOVA with a Bonferroni post hoc test for multiple comparisons was used. When two groups were compared, an unpaired t test was used; p < 0.05 was considered significant. Data are displayed as mean ± SEM.
Results
Gliadin-sensitized NOD-DQ8 mice developed barrier dysfunction and altered villus/crypt ratios
We have shown previously that HLA-DQ8 mice develop activation of the innate and adaptive arms of the immune system, and increased tissue conductance after gliadin sensitization (41, 43, 45). Despite this finding, gliadin-sensitized HLA-DQ8 mice develop only a mild enteropathy, characterized by increased IELs, similar to a Marsh I lesion in CD (46). To determine whether NOD-DQ8 mice develop gliadin-induced barrier dysfunction and enteropathy, mice were sensitized with a peptic-tryptic digested form of gliadin once per week for 3 wk. Cholera toxin was used as a mucosal adjuvant. A group of mice was pretreated with anti-CD25 mAbs to determine whether a preexisting immune dysregulation could exacerbate gliadin-induced mucosal dysfunction and enteropathy. Regulatory T cells (Tregs) are marked by the expression of CD4, CD25, and the transcription factor Foxp3. Therefore, we define a Treg as a CD4+CD25+Foxp3+ T cell, and will refer to CD4+ CD25+Foxp3+ T cells as Tregs or CD4+CD25+Foxp3+ Tregs hereafter. Furthermore, CD25 (IL-2R α subunit) is essential for the generation, peripheral expansion, and maintenance of Tregs (47–52). Monoclonal anti-CD25 Abs have been used to deplete the Treg population (47, 49, 53). Therefore, NOD-DQ8 mice were treated with two i.p. doses of anti-CD25 mAbs, 1 wk apart, prior to gliadin sensitization. We used Ussing chambers to measure tissue conductance in sections of the small intestine. Enteropathy was evaluated by villus-to-crypt ratios and by immunostaining for CD3+ IELs (37, 41).
Gliadin-sensitized NOD-DQ8 mice had increased tissue conductance compared with untreated controls and to anti-CD25 treated mice (Fig. 1). No difference in conductance was seen between untreated controls and anti-CD25 mAb-treated plus BSA-sensitized mice. There was also no difference in tissue conductance between gliadin-sensitized mice and sensitized mice that were pretreated with anti-CD25 mAbs, suggesting that barrier dysfunction was gliadin-dependent and was not induced by anti-CD25 mAb treatment. Gliadin-sensitized mice developed lower villus-to-crypt ratios (Fig. 2) and increased IEL counts (Fig. 3), reminiscent of a Marsh II lesion, compared with untreated control mice, anti-CD25 mAb treated mice, and anti-CD25 mAb-treated plus BSA-sensitized mice. Previous Treg depletion did not further increase the severity of gliadin-induced enteropathy in NOD-DQ8 mice. These results suggest that, compared with HLA-DQ8 mice, DQ8 mice on the NOD background are more sensitive to gliadin-induced enteropathy, and partial depletion of Tregs has no evident role in the induction of enteropathy in the model.
FIGURE 1.
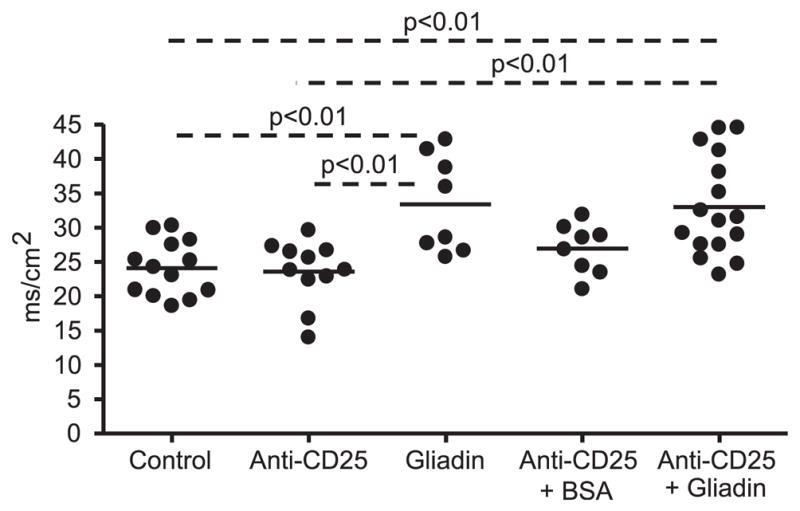
Impaired intestinal barrier function in gliadin-sensitized NOD-DQ8 mice. Sections of small intestine were mounted in Ussing chambers and tissue conductance (mS/cm2) was measured 24 h after the final gavage. Each dot represents an individual mouse; p values were computed using an ANOVA with a post hoc test for multiple comparisons.
FIGURE 2.

Histopathology of the small intestine showing decreased villus-to-crypt ratio in gliadin-sensitized NOD-DQ8 mice. H&E-stained sections of the proximal small intestine in untreated controls (A) and anti-CD25 mAb-treated (B), gliadin-sensitized (C), anti-CD25 mAb treated plus BSA-sensitized (D), and anti-CD25 mAb treated plus gliadin-sensitized mice (E). Original magnification ×10. F, Quantification of villus/ crypt ratios (n = 8 for each group). Data represented as mean ± SEM; p values were computed using an ANOVA with a post hoc test for multiple comparisons. *p < 0.05 versus control mice, anti-CD25 mAb treated mice, and anti-CD25 + BSA-treated mice.
FIGURE 3.

Immunohistochemistry showing increased number of CD3+ IELs in gliadin-sensitized mice. CD3+-stained sections of the proximal small intestine in untreated controls (A), anti-CD25 mAb-treated (B), gliadin-sensitized (C), anti-CD25 mAb-treated plus BSA-sensitized (D), and anti-CD25 mAb-treated plus gliadin-sensitized mice (E). Original magnification ×40. Black arrows indicate IELs. F, Quantification of CD3+ cells in villi tips, expressed as IEL per 100 enterocytes (n = 8 for each group). Data are represented as mean ± SEM; p values were computed using an ANOVA with a post hoc test for multiple comparisons. **p < 0.01 versus control mice, anti-CD25 mAb treated mice, and anti-CD25 + BSA-treated mice.
Gliadin-sensitized NOD-DQ8 mice develop anti-gliadin and anti-tTG Abs
In contrast to anti-gliadin IgA and IgG Abs, IgA autoantibodies toward tTG are highly specific for CD (54). HLA-DQ8 mice develop anti-gliadin IgG Abs after gliadin-sensitization (41, 45). We tested whether gliadin sensitization in NOD-DQ8 mice led to the production of Abs toward gliadin and tTG. Four of 11 gliadin-sensitized mice developed anti-gliadin IgG Abs in the serum and three of nine anti-CD25 plus gliadin-sensitized mice developed anti-gliadin IgG Abs. Anti-gliadin IgG Abs were not detected in the serum of nonsensitized mice (Fig. 4A). Anti-tTG IgA Abs were found in the serum of three gliadin-sensitized mice and two anti-CD25 mAb-treated plus gliadin-sensitized mice. No control, anti-CD25 mAb treated only, or BSA-sensitized mouse tested positive for anti-tTG Abs (Fig. 4B). The presence of anti-tTG Abs in a proportion of gliadin-sensitized mice is in accordance with the more moderate enteropathy observed in these mice compared with HLA-DQ8 mice (41).
FIGURE 4.

Anti-gliadin and anti-tTG ELISAs. Serum was collected from NOD-DQ8 mice, and the presence of anti-gliadin IgG Abs (A) and anti-tTG IgA Abs (B) was determined by ELISA. Anti-gliadin and anti-tTG positive reactivity was determined using a positive cutoff value of ≥3 SD above the mean of control mice (dotted line) (40). Each dot represents an individual mouse.
Anti-CD25 Ab treatment partially depleted CD4+CD25+ Foxp3+ T cells
To confirm that anti-CD25 mAb treatment depleted the regulatory population, NOD-DQ8 mice were treated with two i.p. doses of anti-CD25 mAbs, each 1 wk apart. Cells were collected 1 wk following the second Ab treatment, and the percentage of Tregs was determined. Similar to previous findings, we showed a partial depletion of CD4+CD25+Foxp3+ Tregs (Supplemental Fig. 1) (47, 49). Compared with PBS-treated controls, the CD25+Foxp3+ cells decreased from 10.57 to 2.32% of the total CD4+ lymphocyte population in the spleen of anti-CD25 mAb-treated mice (Supplemental Fig. 1A, left panels). The remaining Foxp3+ cells expressed low levels of CD25 or no CD25. In addition, anti-CD25 mAb treatment resulted in the partial depletion of Tregs in the MLN and PLN. In the MLN, the CD25+Foxp3+ cells decreased from 11.54 to 3.27% of the CD4+ T cell population (Supplemental Fig. 1A, center panels). In the PLN, the CD25+Foxp3+ cells decreased from 11.94 to 3.0% of the CD4+ T cell population (Supplemental Fig. 1A, right panels). Thus, anti-CD25 mAb treatment before gliadin sensitization led to a partial, but significant depletion of Tregs in the spleen, MLN, and PLN (Supplemental Fig. 1B).
Partial Treg depletion and gliadin sensitization was associated with insulitis in NOD-DQ8 mice
NOR and NOD mice were used as negative and positive controls, respectively, to validate the insulitis grading in NOD-DQ8 mice. At 6 wk of age, NOD mice had developed mild periinsulitis (Supplemental Fig. 2A, 2D), while severe insulitis developed at 14 wk of age (Supplemental Fig. 2B, 2D). NOR mice developed mild periinsulitis at 14 wk of age (Supplemental Fig. 2C, 2D), as previously reported (55). Intestinal tissue conductance was significantly higher in 14-wk-old NOD mice, but not in 6-wk-old NOD mice, compared with NOR controls. NOR mice displayed normal barrier function (Supplemental Fig. 3). Thus, although NOD mice displayed higher tissue conductance values at the preinsulitis stage, only at 14 wk of age (insulitis stage) did this difference become statistically significant.
We investigated whether gliadin-induced mucosal changes were linked to insulitis in NOD-DQ8 mice. Previous studies have shown that NOD-DQ8 mice on a gluten-containing diet develop a gliadin-dependent blistering of the skin, but do not develop diabetes (33). In addition, gliadin-sensitized HLA-DQ8 mice have shown increased IL-10 production and increased recruitment of regulatory Foxp3+ cells within the lamina propria. It has been hypothesized that this regulatory immune response to gliadin may protect mice from overt autoimmunity (41, 45). Thus, we used anti-CD25 mAbs to partially deplete the Tregs, which we defined as CD4+ CD25+Foxp3+ T cells (47, 56) prior to gliadin sensitization. Pancreatic islets were analyzed for infiltration of immune cells 24 h after the final gavage. Untreated control mice had normal islets (Fig. 5A). Anti-CD25 treated mice also had normal islets with no significant infiltration (Fig. 5B). Similar to the findings of Marietta et al. (33), gliadin-sensitized mice did not develop severe insulitis (Fig. 5C). However, mice that were pretreated with anti-CD25 mAbs and subsequently sensitized with gliadin developed severe insulitis (Fig. 5E). The insulitis scores of anti-CD25 plus gliadin-sensitized mice were similar to those of 14-wk-old NOD mice (Supplemental Fig. 2). Treatment of anti-CD25 mAbs plus BSA sensitization did not lead to insulitis, suggesting that the response was not induced by an unrelated Ag and was gliadin-dependent (Fig. 5D). The insulitis scores of anti-CD25 mAb treated plus gliadin-sensitized mice were greater than those in untreated controls, anti-CD25 mAb treated mice, gliadin-sensitized, and to anti-CD25 mAb treated plus BSA-sensitized mice (Fig. 5F). The infiltrates were composed of CD3+ lymphocytes (Fig. 6). No differences were seen in blood glucose levels (data not shown) or glucose tolerance between groups (data not shown). These results suggest that NOD-DQ8 mice are susceptible to developing an inflammatory response in β-cell islets when systemic partial depletion of CD4+CD25+Foxp3+ cells is induced prior to gliadin sensitization.
FIGURE 5.

Gliadin-sensitized NOD-DQ8 mice develop severe insulitis in the presence of an immune dysregulation. Insulitis was determined by evaluating H&E-stained sections of the pancreas for islet infiltration, scoring each islet from grade 0 (no infiltration) to grade 4 (end-stage insulitis with <20% of islet mass remaining) (38–40). An average insulitis score was determined for each group of mice: untreated controls (A), anti-CD25 mAb treated mice (B), gliadin-sensitized mice (C), anti-CD25 mAb-treated plus BSA-sensitized mice (D), and anti-CD25 mAb treated plus gliadin-sensitized mice (E). Original magnification ×10. F, Quantification of insulitis scores for multiple mice (n = 9 per group). Data are represented as mean ± SEM; p values were computed using an ANOVA with a post hoc test for multiple comparisons.
FIGURE 6.

Immunohistochemistry showing the presence of CD3+ lymphocytes in pancreatic islets in NOD-DQ8 mice. Representative CD3+-stained sections of the pancreas in untreated controls (A), anti-CD25 mAb-treated (B), gliadin-sensitized mice (C), anti-CD25 mAb plus BSA-sensitized (D), and anti-CD25 mAb-treated plus gliadin-sensitized mice (E). Original magnification ×20.
Partial CD4+CD25+Foxp3+ cell depletion and gliadin sensitization did not lead to widespread autoimmunity
To determine whether inflammation was present in other organs, H&E-stained sections of the liver and lungs were examined for signs of infiltration and inflammation. There was no significant infiltration observed in the liver of nonsensitized controls, anti-CD25 mAb treated mice, gliadin-sensitized mice, anti-CD25 mAb treated plus BSA-sensitized mice, or in anti-CD25 mAb plus gliadin-sensitized mice (data not shown). Similarly, none of the groups exhibited inflammation within the lungs (data not shown). Thus, the infiltration observed in anti-CD25 mAb-treated plus gliadin-sensitized mice was restricted to the pancreas, indicating an absence of generalized autoimmunity.
T cells from PLNs of NOD-DQ8 mice that developed insulitis exhibit increased proliferation and proinflammatory cytokine production when incubated with gliadin
HLA-DQ8 mice have shown increased proliferative responses toward gliadin peptides in both the spleen and MLN (45, 57). Evidence suggests that the gut and the pancreas are immunologically linked. In NOD mice, islet-infiltrating lymphocytes express the α4β7 integrin, a gut-homing receptor (58). The ligand for α4β7, MAdCAM-1, is expressed within the pancreas and is upregulated during insulitis (59). These findings suggest that lymphocytes displaying gut homing markers are able to circulate between the gut and the pancreas, and that immune responses to dietary Ags may modulate insulitis. We therefore determined whether cells in the PLNs of gliadin-sensitized NOD-DQ8 mice responded to gliadin by measuring proliferation and cytokine production. CD4+ T cells were isolated from the PLNs of control mice and anti-CD25 mAb plus gliadin-sensitized mice and incubated with gliadin, BSA, or media alone. In anti-CD25 mAb plus gliadin-sensitized mice, gliadin stimulation led to increased proliferation compared with BSA and media alone. In control mice, no increase in proliferation was observed in gliadin-stimulated cultures (Fig. 7A, 7B). Compared with untreated controls, gliadin stimulation increased proliferation in anti-CD25 plus gliadin-sensitized mice. Cytokine production was measured in the PLN cell culture supernatants. There was a significant increase in production of the proinflammatory cytokine TNF-α in the cell cultures from mice that developed insulitis and were incubated with gliadin compared with BSA (Fig. 7C). In cultures from mice that developed insulitis and were cultured with media or BSA, the production of MCP-1 and IL-6 was below the limit of detection, whereas incubation with gliadin resulted in detectable levels of both MCP-1 and IL-6 in some of the mice (Fig. 7D, 7E). No differences were found in IL-10 or TGF-β production (data not shown). In PLN cell cultures from control mice, all cytokine levels were below the limit of detection (data not shown). These results suggest that gliadin-specific T-cells are found within the PLNs of mice that develop insulitis and that these cells produce a Th1 cytokine response.
FIGURE 7.

T cells isolated from the PLNs of mice that develop insulitis respond to gliadin stimulation. A, CD4+ T cells were isolated from the PLNs of control and anti-CD25 mAb-treated plus gliadin-sensitized mice and labeled with CFSE. CD4+ T cells were incubated with APCs with PT gliadin (right panels), BSA (center panels), or media alone (left panels) for 4 d. Proliferation was assessed with FACS analysis. Cells were gated on live CD4+ lymphocytes. Gated population represents the percentage of proliferated cells. B, Quantification of proliferation in A for control mice (n = 5) and anti-CD25+ gliadin mice (n = 5). Data are represented as mean ± SEM; p values were computed using an ANOVA for multiple comparisons. **p < 0.01 versus other groups. TNF-α (C), IL-6 (D), and MCP-1 (E) production was assessed in cell culture supernatants from mice that developed insulitis, using a cytometric bead array inflammation kit. The dotted line represents the limit of detection; p values were computed using an unpaired t test.
Discussion
The main objective of this study was to investigate the role of gliadin in the development of enteropathy and insulitis in NOD-DQ8 mice. T cells in NOD-DQ8 mice are selected in the thymus in a DQ8-restricted manner. The presence of the DQ8 gene ensures efficient gliadin Ag presentation by APCs to CD4+ T cells (45, 57, 60). We found that gliadin sensitization in NOD-DQ8 mice induced moderate enteropathy, characterized by decreased villus-to-crypt ratios and increased IEL counts in the proximal small intestine. Similar to other DQ8 transgenic mouse models, NOD-DQ8 mice developed gliadin-induced intestinal barrier dysfunction. These changes were induced by gliadin, as the immune and functional changes were not observed after sensitization with an unrelated Ag—BSA. Development of severe insulitis, however, required partial depletion of CD25+Foxp3+ T cells prior to gliadin sensitization. T cells isolated from the PLNs of mice that developed insulitis exhibited enhanced proinflammatory cytokine production and proliferation when cultured with gliadin, compared with culture with BSA or media alone. CD4+ T cells isolated from the PLNs of control mice did not respond to gliadin or BSA. These data suggest that a combination of mucosal damage and breakdown in tolerance to gliadin led to insulitis in NOD-DQ8 mice.
There is mounting evidence that a defect in the intestinal barrier can promote T1D (61, 62). Several animal models of T1D have demonstrated that increased intestinal permeability can be detected prior to the clinical onset of diabetes (63–65). Barrier dysfunction has also been observed in patients with T1D and in their relatives (66, 67). A recent study in NOD mice has shown that infection with Citrobacter rodentium resulted in increased intestinal permeability and accelerated onset of insulitis and diabetes (68). The results suggest an adjuvant role of intestinal barrier dysfunction in diabetes development. In our study, 14-wk-old NOD mice used as positive controls for insulitis exhibited barrier dysfunction and severe insulitis. Because gliadin is known to affect intestinal permeability in animal models of gluten sensitivity and in humans with CD (41, 65, 69–71), we investigated whether NOD-DQ8 mice developed gliadin-induced barrier dysfunction and insulitis. It has been suggested that the patients with CD and the greatest risk of developing extraintestinal autoimmunity are those who have had a longer duration of gluten exposure (72). Studies in animal models and humans have shown a reduction in T1D risk following implementation of a gluten-free diet (29, 73, 74). We found that gliadin sensitization led to increased tissue conductance and an enteropathy, characterized by decreased villus-to-crypt ratios and increased IELs, that is reminiscent of moderate gluten sensitive enteropathy (75). In addition, a proportion of gliadin-sensitized mice developed both anti-gliadin IgG and anti-tTG IgA Abs. Similarly, a recent article using DQ8 transgenic mice that overexpress IL-15 in the lamina propria found that mice fed gliadin developed anti-gliadin and anti-tTG Abs, intraepithelial lymphocytosis, and IFN-γ–producing T cells, but lacked overt villous atrophy (76). Innate immune responses toward gliadin can directly cause mucosal damage, a process that involves production of IL-15. tTg also plays a key role in modifying the anti-gliadin immune response in CD. Whether these key innate immune responses have critical roles in the development of mucosal damage in NOD-DQ8 still needs to be elucidated. Despite these mucosal abnormalities in gliadin-sensitized NOD-DQ8 mice, insulitis did not develop. These findings suggest that loss of barrier function and moderate enteropathy induced by gliadin are not sufficient, on their own, to induce insulitis.
Recent studies have shown that inducible Tregs have a crucial role in maintaining oral tolerance (77). In the MLNs, IL-2 and TGF-β are required to induce production of CD4+CD25+Foxp3+ inducible Tregs from naive CD4+CD25− T cells (78). Migration to the gut and expansion of these cells in the lamina propria by intestinal dendritic cells is crucial for the generation of oral tolerance (77, 78). In accordance with previous results using this technique, we showed that treatment with anti-CD25 mAbs led to partial depletion of Foxp3+ Tregs (47, 49, 52). Importantly, this includes the inducible Treg population, which is critical for controlling the immune response in the intestinal mucosa against oral Ags (52, 77). The partial depletion was likely sufficient to disrupt the immunologic balance between proinflammatory and regulatory mediators in NOD-DQ8 mice because insulitis developed after sensitization with the relevant Ag in this model—gliadin. However, anti-CD25 mAb-treated plus gliadin-sensitized mice did not develop hyperglycemia or impaired glucose tolerance and were not, therefore, clinically diabetic at the time they were analyzed. Similarly, a study using anti-CD25 mAbs demonstrated severe autoimmune gastritis only after administration of autoimmune gastritis target Ag plus anti-CD25 mAb treatment (53). Although insulitis was evident in anti-CD25 mAb plus gliadin-sensitized mice, a longer follow-up time after gliadin sensitization may be needed for development of hyperglycemia and progression to diabetes. However, the degree of insulitis in anti-CD25 plus gliadin-sensitized mice was similar to the insulitis seen in 14-wk-old NOD mice in our study and reported elsewhere (79). Importantly, several studies suggest that a proinflammatory environment within the pancreatic islets can promote the development of diabetes. NOD-DQ8 mice have been shown to develop diabetes if TNF-α is overexpressed in β islets (34). Other studies have shown that the expression of the costimulatory molecule, B7-1, or IFN-α within the islets can promote diabetes development, even in a diabetes-resistant background (80, 81). Our results indicate that partial CD25+Foxp3+ T cell depletion prior to gliadin sensitization was associated with islet infiltration in NOD-DQ8 mice. Extra-intestinal inflammation in gliadin-sensitized NOD-DQ8 mice with prior CD25+Foxp3+ cell depletion was localized to the pancreas, as liver and lung tissues were normal.
CD4+ T cells isolated from the PLNs of mice that developed insulitis responded to gliadin, and not to BSA. In NOD mice and patients with T1D, diabetogenic T cells within the islets display the gut homing marker α4β7 (82). Furthermore, the ligand for the α4β7 integrin, MadCam-1, is expressed on the endothelium in the pancreas and is upregulated during insulitis (83). It has been shown that T cells isolated from the MLNs of 3-wk-old NOD mice are able to induce the development of diabetes in NOD.SCID mice more efficiently than lymphocytes isolated from peripheral lymph nodes, pancreatic lymph nodes, and the spleen (84). This finding suggests the initial priming of diabetogenic T cells may take place in the gut and that activated T cells can home to the pancreas to cause insulitis (84). In our model, oral sensitization to gliadin in mice with partially depleted Tregs led to the production of gliadin-responding T cells in the PLN. This gliadin-associated insulitis could be permissive of T1D development in a genetically predisposed host. Gliadin predominantly activates innate mechanisms in animal models, but the adaptive immune system has also been shown to be activated in transgenic HLA DQ8 mice (41, 45). We demonstrate the presence of gliadin-responsive T cells in the PLNs of NOD-DQ8 mice, providing an experimental setting where both innate and adaptive immune mechanisms can be studied within and outside the gut.
The current prevalence of T1D is estimated to double by 2020 in children younger than 5 y, and ~10% of children with T1D have documented CD (10, 85). CD is common worldwide, with a dramatic increase in prevalence from just 0.2–0.9% during the last five decades (6). With 95% of CD cases estimated to be currently undiagnosed in North America, and the increasing incidence of both diseases, the potential effects of gliadin intolerance on T1D are alarming. Diabetes imposes a substantial cost burden on society, in part because of its complications and comorbidities (86, 87). Our results provide a model to elucidate the mechanisms through which a common dietary intolerance may increase T1D risk and test innovative dietary approaches to prevent and improve metabolic control in T1D (88).
Supplementary Material
Acknowledgments
This work was supported by grants from the Canadian Celiac Association, Canadian Association of Gastroenterology/Canadian Institutes of Health Research, and an Internal Medicine Career award from McMaster University (to E.F.V.); by an Ontario Graduate Scholarship (to H.J.G.), Canadian Institutes of Health Research and Canada Research Chairs (to K.D.M.); and National Institutes of Health Grant DK 71003 (to J.A.M. and C.S.D.).
NOD and NOR mice were originally obtained from Prof. Jayne Danska (The Hospital for Sick Children, Toronto, ON, Canada) through funding from Genome Canada and the Ontario Genomics Institute and were bred in the Axenic and Gnotobiotic Unit, McMaster University. We thank Dr. Gregory Steinberg and Palanivel Rengasamy (McMaster University) for technical advice regarding the glucose tolerance test.
Abbreviations used in this article
- CD
celiac disease
- IEL
intraepithelial lymphocyte
- MLN
mesenteric lymph node
- NOR
nonobese resistant
- PBS-T
PBS-0.05% Tween-20
- PLN
pancreatic lymph node
- PT-gliadin
peptic-tryptic digest of gliadin
- T1D
type 1 diabetes
- Treg
regulatory T cell
- tTG
tissue transglutaminase
Footnotes
The online version of this article contains supplemental material.
Disclosures
The authors have no financial conflicts of interest.
References
- 1.Green PHR, Jabri B. Coeliac disease. Lancet. 2003;362:383–391. doi: 10.1016/S0140-6736(03)14027-5. [DOI] [PubMed] [Google Scholar]
- 2.Fasano A, Berti I, Gerarduzzi T, Not T, Colletti RB, Drago S, Elitsur Y, Green PH, Guandalini S, DHill I, et al. Prevalence of celiac disease in at-risk and not-at-risk groups in the United States: a large multicenter study. Arch Intern Med. 2003;163:286–292. doi: 10.1001/archinte.163.3.286. [DOI] [PubMed] [Google Scholar]
- 3.Not T, Horvath K, Hill ID, Partanen J, Hammed A, Magazzu G, Fasano A. Celiac disease risk in the USA: high prevalence of anti-endomysium antibodies in healthy blood donors. Scand J Gastroenterol. 1998;33:494–498. doi: 10.1080/00365529850172052. [DOI] [PubMed] [Google Scholar]
- 4.Schuppan D, Junker Y, Barisani D. Celiac disease: from pathogenesis to novel therapies. Gastroenterology. 2009;137:1912–1933. doi: 10.1053/j.gastro.2009.09.008. [DOI] [PubMed] [Google Scholar]
- 5.Kagnoff MF. Celiac disease: pathogenesis of a model immunogenetic disease. J Clin Invest. 2007;117:41–49. doi: 10.1172/JCI30253. [DOI] [PMC free article] [PubMed] [Google Scholar]
- 6.Rubio-Tapia A, Kyle RA, Kaplan EL, Johnson DR, Page W, Erdtmann F, Brantner TL, Kim WR, Phelps TK, Lahr BD, et al. Increased prevalence and mortality in undiagnosed celiac disease. Gastroenterology. 2009;137:88–93. doi: 10.1053/j.gastro.2009.03.059. [DOI] [PMC free article] [PubMed] [Google Scholar]
- 7.Lambert AP, Gillespie KM, Thomson G, Cordell HJ, Todd JA, Gale EAM, Bingley PJ. Absolute risk of childhood-onset type 1 diabetes defined by human leukocyte antigen class II genotype: a population-based study in the United Kingdom. J Clin Endocrinol Metab. 2004;89:4037–4043. doi: 10.1210/jc.2003-032084. [DOI] [PubMed] [Google Scholar]
- 8.Daneman D. Type 1 diabetes. Lancet. 2006;367:847–858. doi: 10.1016/S0140-6736(06)68341-4. [DOI] [PubMed] [Google Scholar]
- 9.Borchers AT, Uibo R, Gershwin ME. The geoepidemiology of type 1 diabetes. Autoimmun Rev. 2010;9:A355–A365. doi: 10.1016/j.autrev.2009.12.003. [DOI] [PubMed] [Google Scholar]
- 10.Larsson K, Carlsson A, Cederwall E, Jönsson B, Neiderud J, Jonsson B, Lernmark Å, Ivarsson SA Skåne Study Group. Annual screening detects celiac disease in children with type 1 diabetes. Pediatr Diabetes. 2008;9:354–359. doi: 10.1111/j.1399-5448.2008.00367.x. [DOI] [PubMed] [Google Scholar]
- 11.Güvenç S, Kaymakoğlu S, Gürel N, Karşidağ K, Demir K, Dinçer D, Kekik C, Salman S, Yilmaz T, Beşişik F, Cakaloğlu Y. The prevalence of manifest and latent celiac disease in type 1 diabetes mellitus. Turk J Gastroenterol. 2002;13:103–107. [PubMed] [Google Scholar]
- 12.Spiekerkoetter U, Seissler J, Wendel U. General screening for celiac disease is advisable in children with type 1 diabetes. Horm Metab Res. 2002;34:192–195. doi: 10.1055/s-2002-26709. [DOI] [PubMed] [Google Scholar]
- 13.Collin P, Salmi J, Hällström O, Oksa H, Oksala H, Mäki M, Reunala T. High frequency of coeliac disease in adult patients with type-I diabetes. Scand J Gastroenterol. 1989;24:81–84. doi: 10.3109/00365528909092243. [DOI] [PubMed] [Google Scholar]
- 14.Mahmud FH, Murray JA, Kudva YC, Zinsmeister AR, Dierkhising RA, Lahr BD, Dyck PJ, Kyle RA, El-Youssef M, Burgart LJ. Celiac disease in type 1 diabetes mellitus in a North American community: prevalence, serologic screening, and clinical features. Mayo Clin Proc. 2005;80:1429–1434. doi: 10.4065/80.11.1429. [DOI] [PMC free article] [PubMed] [Google Scholar]
- 15.Dieterich W, Ehnis T, Bauer M, Donner P, Volta U, Riecken EO, Schuppan D. Identification of tissue transglutaminase as the autoantigen of celiac disease. Nat Med. 1997;3:797–801. doi: 10.1038/nm0797-797. [DOI] [PubMed] [Google Scholar]
- 16.Doolan A, Donaghue K, Fairchild J, Wong M, Williams AJ. Use of HLA typing in diagnosing celiac disease in patients with type 1 diabetes. Diabetes Care. 2005;28:806–809. doi: 10.2337/diacare.28.4.806. [DOI] [PubMed] [Google Scholar]
- 17.Saukkonen T, Ilonen J, Åkerblom HK, Savilahti E. Prevalence of coeliac disease in siblings of patients with Type I diabetes is related to the prevalence of DQB1*02 allele. Diabetologia. 2001;44:1051–1053. doi: 10.1007/s001250100591. [DOI] [PubMed] [Google Scholar]
- 18.Shanahan F, McKenna R, McCarthy CF, Drury MI. Coeliac disease and diabetes mellitus: a study of 24 patients with HLA typing. Q J Med. 1982;51:329–335. [PubMed] [Google Scholar]
- 19.Harrison LC, Honeyman MC. Cow’s milk and type 1 diabetes: the real debate is about mucosal immune function. Diabetes. 1999;48:1501–1507. doi: 10.2337/diabetes.48.8.1501. [DOI] [PubMed] [Google Scholar]
- 20.Mojibian M, Chakir H, Lefebvre DE, Crookshank JA, Sonier B, Keely E, Scott FW. Diabetes-specific HLA-DR-restricted proinflammatory T-cell response to wheat polypeptides in tissue transglutaminase antibody-negative patients with type 1 diabetes. Diabetes. 2009;58:1789–1796. doi: 10.2337/db08-1579. [DOI] [PMC free article] [PubMed] [Google Scholar]
- 21.Norris JM, Barriga K, Hoffenberg EJ, Taki I, Miao D, Haas JE, Emery LM, Sokol RJ, Erlich HA, Eisenbarth GS, Rewers M. Risk of celiac disease autoimmunity and timing of gluten introduction in the diet of infants at increased risk of disease. JAMA. 2005;293:2343–2351. doi: 10.1001/jama.293.19.2343. [DOI] [PubMed] [Google Scholar]
- 22.Norris JM, Barriga K, Klingensmith G, Hoffman M, Eisenbarth GS, Erlich HA, Rewers M. Timing of initial cereal exposure in infancy and risk of islet autoimmunity. JAMA. 2003;290:1713–1720. doi: 10.1001/jama.290.13.1713. [DOI] [PubMed] [Google Scholar]
- 23.Smyth DJ, Plagnol V, Walker NM, Cooper JD, Downes K, Yang JH, Howson JM, Stevens H, McManus R, Wijmenga C, et al. Shared and distinct genetic variants in type 1 diabetes and celiac disease. N Engl J Med. 2008;359:2767–2777. doi: 10.1056/NEJMoa0807917. [DOI] [PMC free article] [PubMed] [Google Scholar]
- 24.Plenge RM. Shared genetic risk factors for type 1 diabetes and celiac disease. N Engl J Med. 2008;359:2837–2838. doi: 10.1056/NEJMe0809719. [DOI] [PubMed] [Google Scholar]
- 25.Mackay IR. Clustering and commonalities among autoimmune diseases. J Autoimmun. 2009;33:170–177. doi: 10.1016/j.jaut.2009.09.006. [DOI] [PubMed] [Google Scholar]
- 26.Ventura A, Neri E, Ughi C, Leopaldi A, Città A, Not T. Gluten-dependent diabetes-related and thyroid-related autoantibodies in patients with celiac disease. J Pediatr. 2000;137:263–265. doi: 10.1067/mpd.2000.107160. [DOI] [PubMed] [Google Scholar]
- 27.Füchtenbusch M, Ziegler AG, Hummel M. Elimination of dietary gluten and development of type 1 diabetes in high risk subjects. Rev Diabet Stud. 2004;1:39–41. doi: 10.1900/RDS.2004.1.39. [DOI] [PMC free article] [PubMed] [Google Scholar]
- 28.Bosi E, Pastore MR, Molteni L, Bazzigaluppi E, Bonifacio E, Piemonti L. Gluten-free diet in subjects at risk for type 1 diabetes: a tool for delaying progression to clinical disease? Adv Exp Med Biol. 2005;569:157–158. doi: 10.1007/1-4020-3535-7_23. [DOI] [PubMed] [Google Scholar]
- 29.Funda DP, Kaas A, Bock T, Tlaskalová-Hogenová H, Buschard K. Gluten-free diet prevents diabetes in NOD mice. Diabetes Metab Res Rev. 1999;15:323–327. doi: 10.1002/(sici)1520-7560(199909/10)15:5<323::aid-dmrr53>3.0.co;2-p. [DOI] [PubMed] [Google Scholar]
- 30.Kudva YC, Rajagopalan G, Raju R, Abraham RS, Smart M, Hanson J, David CS. Modulation of insulitis and type 1 diabetes by transgenic HLA-DR3 and DQ8 in NOD mice lacking endogenous MHC class II. Hum Immunol. 2002;63:987–999. doi: 10.1016/s0198-8859(02)00435-4. [DOI] [PubMed] [Google Scholar]
- 31.Giarratana N, Penna G, Adorini L. Animal models of spontaneous autoimmune disease: type 1 diabetes in the nonobese diabetic mouse. Methods Mol Biol. 2007;380:285–311. doi: 10.1007/978-1-59745-395-0_17. [DOI] [PubMed] [Google Scholar]
- 32.Cheţa D. Animal models of type I (insulin-dependent) diabetes mellitus. J Pediatr Endocrinol Metab. 1998;11:11–19. doi: 10.1515/jpem.1998.11.1.11. [DOI] [PubMed] [Google Scholar]
- 33.Marietta E, Black K, Camilleri M, Krause P, Rogers RS, III, David C, Pittelkow MR, Murray JA. A new model for dermatitis herpetiformis that uses HLA-DQ8 transgenic NOD mice. J Clin Invest. 2004;114:1090–1097. doi: 10.1172/JCI21055. [DOI] [PMC free article] [PubMed] [Google Scholar]
- 34.Rajagopalan G, Kudva YC, Flavell RA, David CS. Accelerated diabetes in rat insulin promoter-tumor necrosis factor-alpha transgenic nonobese diabetic mice lacking major histocompatibility class II molecules. Diabetes. 2003;52:342–347. doi: 10.2337/diabetes.52.2.342. [DOI] [PubMed] [Google Scholar]
- 35.Thomas KE, Sapone A, Fasano A, Vogel SN. Gliadin stimulation of murine macrophage inflammatory gene expression and intestinal permeability are MyD88-dependent: role of the innate immune response in Celiac disease. J Immunol. 2006;176:2512–2521. doi: 10.4049/jimmunol.176.4.2512. [DOI] [PubMed] [Google Scholar]
- 36.Bollyky PL, Bice JB, Sweet IR, Falk BA, Gebe JA, Clark AE, Gersuk VH, Aderem A, Hawn TR, Nepom GT. The toll-like receptor signaling molecule Myd88 contributes to pancreatic beta-cell homeostasis in response to injury. PLoS ONE. 2009;4:e5063. doi: 10.1371/journal.pone.0005063. [DOI] [PMC free article] [PubMed] [Google Scholar]
- 37.Biagi F, Luinetti O, Campanella J, Klersy C, Zambelli C, Villanacci V, Lanzini A, Corazza GR. Intraepithelial lymphocytes in the villous tip: do they indicate potential coeliac disease? J Clin Pathol. 2004;57:835–839. doi: 10.1136/jcp.2003.013607. [DOI] [PMC free article] [PubMed] [Google Scholar]
- 38.Goudy KS, Burkhardt BR, Wasserfall C, Song S, Campbell-Thompson ML, Brusko T, Powers MA, Clare-Salzler MJ, Sobel ES, Ellis TM, et al. Systemic overexpression of IL-10 induces CD4+CD25+ cell populations in vivo and ameliorates type 1 diabetes in nonobese diabetic mice in a dose-dependent fashion. J Immunol. 2003;171:2270–2278. doi: 10.4049/jimmunol.171.5.2270. [DOI] [PubMed] [Google Scholar]
- 39.Leiter EH. The NOD mouse: a model for insulin-dependent diabetes mellitus. Curr Protoc Immunol. 2001;Chapter 15(Unit 15.9) doi: 10.1002/0471142735.im1509s24. [DOI] [PubMed] [Google Scholar]
- 40.Esensten JH, Lee MR, Glimcher LH, Bluestone JA. T-bet-deficient NOD mice are protected from diabetes due to defects in both T cell and innate immune system function. J Immunol. 2009;183:75–82. doi: 10.4049/jimmunol.0804154. [DOI] [PMC free article] [PubMed] [Google Scholar]
- 41.Verdu EF, Huang X, Natividad J, Lu J, Blennerhassett PA, David CS, McKay DM, Murray JA. Gliadin-dependent neuromuscular and epithelial secretory responses in gluten-sensitive HLA-DQ8 transgenic mice. Am J Physiol Gastrointest Liver Physiol. 2008;294:G217–G225. doi: 10.1152/ajpgi.00225.2007. [DOI] [PubMed] [Google Scholar]
- 42.de Kauwe AL, Chen Z, Anderson RP, Keech CL, Price JD, Wijburg O, Jackson DC, Ladhams J, Allison J, McCluskey J. Resistance to celiac disease in humanized HLA-DR3-DQ2-transgenic mice expressing specific anti-gliadin CD4+ T cells. J Immunol. 2009;182:7440–7450. doi: 10.4049/jimmunol.0900233. [DOI] [PubMed] [Google Scholar]
- 43.Natividad JM, Huang X, Slack E, Jury J, Sanz Y, David C, Denou E, Yang P, Murray J, McCoy KD, Verdú EF. Host responses to intestinal microbial antigens in gluten-sensitive mice. PLoS ONE. 2009;4:e6472. doi: 10.1371/journal.pone.0006472. [DOI] [PMC free article] [PubMed] [Google Scholar]
- 44.Parish CR, Glidden MH, Quah BJ, Warren HS. Use of the intracellular fluorescent dye CFSE to monitor lymphocyte migration and proliferation. Curr Protoc Immunol. 2001;4:4.9. doi: 10.1002/0471142735.im0409s84. [DOI] [PubMed] [Google Scholar]
- 45.Black KE, Murray JA, David CS. HLA-DQ determines the response to exogenous wheat proteins: a model of gluten sensitivity in transgenic knockout mice. J Immunol. 2002;169:5595–5600. doi: 10.4049/jimmunol.169.10.5595. [DOI] [PubMed] [Google Scholar]
- 46.Green PHR, Rostami K, Marsh MN. Diagnosis of coeliac disease. Best Pract Res Clin Gastroenterol. 2005;19:389–400. doi: 10.1016/j.bpg.2005.02.006. [DOI] [PubMed] [Google Scholar]
- 47.McNeill A, Spittle E, Bäckström BT. Partial depletion of CD69low-expressing natural regulatory T cells with the anti-CD25 monoclonal antibody PC61. Scand J Immunol. 2007;65:63–69. doi: 10.1111/j.1365-3083.2006.01870.x. [DOI] [PubMed] [Google Scholar]
- 48.Morris GP, Brown NK, Kong YC. Naturally-existing CD4(+) CD25(+)Foxp3(+) regulatory T cells are required for tolerance to experimental autoimmune thyroiditis induced by either exogenous or endogenous autoantigen. J Autoimmun. 2009;33:68–76. doi: 10.1016/j.jaut.2009.03.010. [DOI] [PMC free article] [PubMed] [Google Scholar]
- 49.Setiady YY, Coccia JA, Park PU. In vivo depletion of CD4+ FOXP3+ Treg cells by the PC61 anti-CD25 monoclonal antibody is mediated by FcγRIII+ phagocytes. Eur J Immunol. 2009;40:780–786. doi: 10.1002/eji.200939613. [DOI] [PubMed] [Google Scholar]
- 50.Sakaguchi S, Ono M, Setoguchi R, Yagi H, Hori S, Fehervari Z, Shimizu J, Takahashi T, Nomura T. Foxp3+ CD25+ CD4+ natural regulatory T cells in dominant self-tolerance and autoimmune disease. Immunol Rev. 2006;212:8–27. doi: 10.1111/j.0105-2896.2006.00427.x. [DOI] [PubMed] [Google Scholar]
- 51.Piccirillo CA, Thornton AM. Cornerstone of peripheral tolerance: naturally occurring CD4+CD25+ regulatory T cells. Trends Immunol. 2004;25:374–380. doi: 10.1016/j.it.2004.04.009. [DOI] [PubMed] [Google Scholar]
- 52.Horwitz DA, Zheng SG, Gray JD. Natural and TGF-beta-induced Foxp3(+)CD4(+) CD25(+) regulatory T cells are not mirror images of each other. Trends Immunol. 2008;29:429–435. doi: 10.1016/j.it.2008.06.005. [DOI] [PubMed] [Google Scholar]
- 53.McHugh RS, Shevach EM. Cutting edge: depletion of CD4+ CD25+ regulatory T cells is necessary, but not sufficient, for induction of organ-specific autoimmune disease. J Immunol. 2002;168:5979–5983. doi: 10.4049/jimmunol.168.12.5979. [DOI] [PubMed] [Google Scholar]
- 54.Hadjivassiliou M, Sanders DS, Grünewald RA, Woodroofe N, Boscolo S, Aeschlimann D. Gluten sensitivity: from gut to brain. Lancet Neurol. 2010;9:318–330. doi: 10.1016/S1474-4422(09)70290-X. [DOI] [PubMed] [Google Scholar]
- 55.Fox CJ, Danska JS. Independent genetic regulation of T-cell and antigen-presenting cell participation in autoimmune islet inflammation. Diabetes. 1998;47:331–338. doi: 10.2337/diabetes.47.3.331. [DOI] [PubMed] [Google Scholar]
- 56.Montero E, Nussbaum G, Kaye JF, Perez R, Lage A, Ben-Nun A, Cohen IR. Regulation of experimental autoimmune encephalomyelitis by CD4+, CD25+ and CD8+ T cells: analysis using depleting antibodies. J Autoimmun. 2004;23:1–7. doi: 10.1016/j.jaut.2004.05.001. [DOI] [PubMed] [Google Scholar]
- 57.Senger S, Maurano F, Mazzeo MF, Gaita M, Fierro O, David CS, Troncone R, Auricchio S, Siciliano RA, Rossi M. Identification of immunodominant epitopes of alpha-gliadin in HLA-DQ8 transgenic mice following oral immunization. J Immunol. 2005;175:8087–8095. doi: 10.4049/jimmunol.175.12.8087. [DOI] [PubMed] [Google Scholar]
- 58.Hänninen A, Salmi M, Simell O, Jalkanen S. Mucosa-associated (beta 7-integrinhigh) lymphocytes accumulate early in the pancreas of NOD mice and show aberrant recirculation behavior. Diabetes. 1996;45:1173–1180. doi: 10.2337/diab.45.9.1173. [DOI] [PubMed] [Google Scholar]
- 59.Hänninen A, Jaakkola I, Jalkanen S. Mucosal addressin is required for the development of diabetes in nonobese diabetic mice. J Immunol. 1998;160:6018–6025. [PubMed] [Google Scholar]
- 60.Taneja V, Behrens M, Cooper LT, Yamada S, Kita H, Redfield MM, Terzic A, David C. Spontaneous myocarditis mimicking human disease occurs in the presence of an appropriate MHC and non-MHC background in transgenic mice. J Mol Cell Cardiol. 2007;42:1054–1064. doi: 10.1016/j.yjmcc.2007.03.898. [DOI] [PMC free article] [PubMed] [Google Scholar]
- 61.Vaarala O. Leaking gut in type 1 diabetes. Curr Opin Gastroenterol. 2008;24:701–706. doi: 10.1097/MOG.0b013e32830e6d98. [DOI] [PubMed] [Google Scholar]
- 62.Visser J, Rozing J, Sapone A, Lammers K, Fasano A. Tight junctions, intestinal permeability, and autoimmunity: celiac disease and type 1 diabetes paradigms. Ann N Y Acad Sci. 2009;1165:195–205. doi: 10.1111/j.1749-6632.2009.04037.x. [DOI] [PMC free article] [PubMed] [Google Scholar]
- 63.Neu J, Reverte CM, Mackey AD, Liboni K, Tuhacek-Tenace LM, Hatch M, Li N, Caicedo RA, Schatz DA, Atkinson M. Changes in intestinal morphology and permeability in the biobreeding rat before the onset of type 1 diabetes. J Pediatr Gastroenterol Nutr. 2005;40:589–595. doi: 10.1097/01.mpg.0000159636.19346.c1. [DOI] [PubMed] [Google Scholar]
- 64.Graham S, Courtois P, Malaisse WJ, Rozing J, Scott FW, Mowat AM. Enteropathy precedes type 1 diabetes in the BB rat. Gut. 2004;53:1437–1444. doi: 10.1136/gut.2004.042481. [DOI] [PMC free article] [PubMed] [Google Scholar]
- 65.Watts T, Berti I, Sapone A, Gerarduzzi T, Not T, Zielke R, Fasano A. Role of the intestinal tight junction modulator zonulin in the pathogenesis of type I diabetes in BB diabetic-prone rats. Proc Natl Acad Sci USA. 2005;102:2916–2921. doi: 10.1073/pnas.0500178102. [DOI] [PMC free article] [PubMed] [Google Scholar]
- 66.Sapone A, de Magistris L, Pietzak M, Clemente MG, Tripathi A, Cucca F, Lampis R, Kryszak D, Cartenì M, Generoso M, et al. Zonulin upregulation is associated with increased gut permeability in subjects with type 1 diabetes and their relatives. Diabetes. 2006;55:1443–1449. doi: 10.2337/db05-1593. [DOI] [PubMed] [Google Scholar]
- 67.Bosi E, Molteni L, Radaelli MG, Folini L, Fermo I, Bazzigaluppi E, Piemonti L, Pastore MR, Paroni R. Increased intestinal permeability precedes clinical onset of type 1 diabetes. Diabetologia. 2006;49:2824–2827. doi: 10.1007/s00125-006-0465-3. [DOI] [PubMed] [Google Scholar]
- 68.Lee AS, Gibson DL, Zhang Y, Sham HP, Vallance BA, Dutz JP. Gut barrier disruption by an enteric bacterial pathogen accelerates insulitis in NOD mice. Diabetologia. 2010;53:741–748. doi: 10.1007/s00125-009-1626-y. [DOI] [PubMed] [Google Scholar]
- 69.Vogelsang H, Schwarzenhofer M, Oberhuber G. Changes in gastrointestinal permeability in celiac disease. Dig Dis. 1998;16:333–336. doi: 10.1159/000016886. [DOI] [PubMed] [Google Scholar]
- 70.Drago S, El Asmar R, Di Pierro M, Grazia Clemente M, Tripathi A, Sapone A, Thakar M, Iacono G, Carroccio A, D’Agate C, et al. Gliadin, zonulin and gut permeability: Effects on celiac and non-celiac intestinal mucosa and intestinal cell lines. Scand J Gastroenterol. 2006;41:408–419. doi: 10.1080/00365520500235334. [DOI] [PubMed] [Google Scholar]
- 71.Clemente MG, De Virgiliis S, Kang JS, Macatagney R, Musu MP, Di Pierro MR, Drago S, Congia M, Fasano A. Early effects of gliadin on enterocyte intracellular signalling involved in intestinal barrier function. Gut. 2003;52:218–223. doi: 10.1136/gut.52.2.218. [DOI] [PMC free article] [PubMed] [Google Scholar]
- 72.Ventura A, Magazzù G, Greco L SIGEP Study Group for Autoimmune Disorders in Celiac Disease. Duration of exposure to gluten and risk for autoimmune disorders in patients with celiac disease. Gastroenterology. 1999;117:297–303. doi: 10.1053/gast.1999.0029900297. [DOI] [PubMed] [Google Scholar]
- 73.Pastore MR, Bazzigaluppi E, Belloni C, Arcovio C, Bonifacio E, Bosi E. Six months of gluten-free diet do not influence autoantibody titers, but improve insulin secretion in subjects at high risk for type 1 diabetes. J Clin Endocrinol Metab. 2003;88:162–165. doi: 10.1210/jc.2002-021177. [DOI] [PubMed] [Google Scholar]
- 74.Toscano V, Conti FG, Anastasi E, Mariani P, Tiberti C, Poggi M, Montuori M, Monti S, Laureti S, Cipolletta E, et al. Importance of gluten in the induction of endocrine autoantibodies and organ dysfunction in adolescent celiac patients. Am J Gastroenterol. 2000;95:1742–1748. doi: 10.1111/j.1572-0241.2000.02187.x. [DOI] [PubMed] [Google Scholar]
- 75.Marsh MN. Gluten, major histocompatibility complex, and the small intestine. A molecular and immunobiologic approach to the spectrum of gluten sensitivity (‘celiac sprue’) Gastroenterology. 1992;102:330–354. [PubMed] [Google Scholar]
- 76.DePaolo RW, Abadie V, Tang F, Fehlner-Peach H, Hall JA, Wang W, Marietta EV, Kasarda DD, Waldmann TA, Murray JA, et al. Co-adjuvant effects of retinoic acid and IL-15 induce inflammatory immunity to dietary antigens. Nature. 2011;471:220–224. doi: 10.1038/nature09849. [DOI] [PMC free article] [PubMed] [Google Scholar]
- 77.Hadis U, Wahl B, Schulz O, Hardtke-Wolenski M, Schippers A, Wagner N, Müller W, Sparwasser T, Förster R, Pabst O. Intestinal tolerance requires gut homing and expansion of FoxP3+ regulatory T cells in the lamina propria. Immunity. 2011;34:237–246. doi: 10.1016/j.immuni.2011.01.016. [DOI] [PubMed] [Google Scholar]
- 78.Zheng SG, Wang J, Wang P, Gray JD, Horwitz DA. IL-2 is essential for TGF-beta to convert naive CD4+CD25− cells to CD25+Foxp3+ regulatory T cells and for expansion of these cells. J Immunol. 2007;178:2018–2027. doi: 10.4049/jimmunol.178.4.2018. [DOI] [PubMed] [Google Scholar]
- 79.Planas R, Alba A, Carrillo J, Puertas MC, Ampudia R, Pastor X, Okamoto H, Takasawa S, Gurr W, Pujol-Borrell R, et al. Reg (regenerating) gene overexpression in islets from non-obese diabetic mice with accelerated diabetes: role of IFNbeta. Diabetologia. 2006;49:2379–2387. doi: 10.1007/s00125-006-0365-6. [DOI] [PubMed] [Google Scholar]
- 80.Wen L, Wong FS, Tang J, Chen NY, Altieri M, David C, Flavell R, Sherwin R. In vivo evidence for the contribution of human histocompatibility leukocyte antigen (HLA)-DQ molecules to the development of diabetes. J Exp Med. 2000;191:97–104. doi: 10.1084/jem.191.1.97. [DOI] [PMC free article] [PubMed] [Google Scholar]
- 81.Stewart TA, Hultgren B, Huang X, Pitts-Meek S, Hully J, MacLachlan NJ. Induction of type I diabetes by interferon-alpha in transgenic mice. Science. 1993;260:1942–1946. doi: 10.1126/science.8100367. [DOI] [PubMed] [Google Scholar]
- 82.Hänninen A, Salmi M, Simell O, Andrew D, Jalkanen S. Recirculation and homing of lymphocyte subsets: dual homing specificity of beta 7-integrin(high)-lymphocytes in nonobese diabetic mice. Blood. 1996;88:934–944. [PubMed] [Google Scholar]
- 83.Hänninen A, Nurmela R, Maksimow M, Heino J, Jalkanen S, Kurts C. Islet beta-cell-specific T cells can use different homing mechanisms to infiltrate and destroy pancreatic islets. Am J Pathol. 2007;170:240–250. doi: 10.2353/ajpath.2007.060142. [DOI] [PMC free article] [PubMed] [Google Scholar]
- 84.Jaakkola I, Jalkanen S, Hänninen A. Diabetogenic T cells are primed both in pancreatic and gut-associated lymph nodes in NOD mice. Eur J Immunol. 2003;33:3255–3264. doi: 10.1002/eji.200324405. [DOI] [PubMed] [Google Scholar]
- 85.Patterson CC, Dahlquist GG, Gyürüs E, Green A, Soltész G EURODIAB Study Group. Incidence trends for childhood type 1 diabetes in Europe during 1989–2003 and predicted new cases 2005-20: a multicentre prospective registration study. Lancet. 2009;373:2027–2033. doi: 10.1016/S0140-6736(09)60568-7. [DOI] [PubMed] [Google Scholar]
- 86.Green PH. Where are all those patients with Celiac disease? Am J Gastroenterol. 2007;102:1461–1463. doi: 10.1111/j.1572-0241.2007.01167.x. [DOI] [PubMed] [Google Scholar]
- 87.Johnson JA, Pohar SL, Majumdar SR. Health care use and costs in the decade after identification of type 1 and type 2 diabetes: a population-based study. Diabetes Care. 2006;29:2403–2408. doi: 10.2337/dc06-0735. [DOI] [PubMed] [Google Scholar]
- 88.Pinier M, Verdu EF, Nasser-Eddine M, David CS, Vézina A, Rivard N, Leroux JC. Polymeric binders suppress gliadin-induced toxicity in the intestinal epithelium. Gastroenterology. 2009;136:288–298. doi: 10.1053/j.gastro.2008.09.016. [DOI] [PubMed] [Google Scholar]
Associated Data
This section collects any data citations, data availability statements, or supplementary materials included in this article.