

We investigated the association between human immunodeficiency virus (HIV) and prevalence of elevated biomarkers of inflammation, altered coagulation, and monocyte activation in a cohort of HIV-infected and uninfected veterans who had a comparable burden of comorbid conditions.
Abstract
Background. Biomarkers of inflammation, altered coagulation, and monocyte activation are associated with mortality and cardiovascular disease (CVD) in the general population and among human immunodeficiency virus (HIV)–infected people. We compared biomarkers for inflammation, altered coagulation, and monocyte activation between HIV-infected and uninfected people in the Veterans Aging Cohort Study (VACS).
Methods. Biomarkers of inflammation (interleukin-6 [IL-6]), altered coagulation (d-dimer), and monocyte activation (soluble CD14 [sCD14]) were measured in blood samples from 1525 HIV-infected and 843 uninfected VACS participants. Logistic regression was used to determine the association between HIV infection and prevalence of elevated (>75th percentile) biomarkers, adjusting for confounding comorbidities.
Results. HIV-infected veterans had less prevalent CVD, hypertension, diabetes, obesity, hazardous drinking, and renal disease, but more dyslipidemia, hepatitis C, and current smoking than uninfected veterans. Compared to uninfected veterans, HIV-infected veterans with HIV-1 RNA ≥500 copies/mL or CD4 count <200 cells/µL had a significantly higher prevalence of elevated IL-6 (odds ratio [OR], 1.54; 95% confidence interval [CI],1.14–2.09; OR, 2.25; 95% CI, 1.60–3.16, respectively) and d-dimer (OR, 1.97; 95% CI, 1.44–2.71, OR, 1.68; 95% CI, 1.22–2.32, respectively) after adjusting for comorbidities. HIV-infected veterans with a CD4 cell count <200 cells/µL had significantly higher prevalence of elevated sCD14 compared to uninfected veterans (OR, 2.60; 95% CI, 1.64–4.14). These associations still persisted after restricting the analysis to veterans without known confounding comorbid conditions.
Conclusions. These data suggest that ongoing HIV replication and immune depletion significantly contribute to increased prevalence of elevated biomarkers of inflammation, altered coagulation, and monocyte activation. This contribution is independent of and in addition to the substantial contribution from comorbid conditions.
Untreated human immunodeficiency virus (HIV) infection and resulting immune depletion are associated with mortality and cardiovascular diseases (CVD) [1]. Biomarkers of inflammation and altered coagulation are associated with mortality and CVD within the general population [2–5] and among HIV-infected people [6–9]. Further, soluble CD14 (sCD14), a biomarker of monocyte activation, is linked with increased mortality risk among HIV-infected individuals [10] and the general population [11]. However, it is unknown whether inflammation, altered coagulation, and monocyte activation are primary mechanisms driving the association between HIV infection and mortality and CVD.
Prior studies comparing HIV-infected to uninfected individuals suggest that HIV infection is associated with inflammation, altered coagulation, and monocyte activation [10, 12–14]. However, these studies were limited by the comparison of HIV-infected and uninfected populations from different cohorts [10, 12, 14] and by their inability to consider degree of viral RNA suppression and immune depletion [13], or comorbid conditions that also influence levels of these biomarkers [14]. The latter limitation is particularly problematic in the study of HIV because those with HIV likely have a greater burden of disease related to behaviors like smoking, alcohol, and drug use. Comparing HIV-infected people to uninfected people who have a lower burden of non–HIV-related disease makes it difficult to determine whether elevated biomarkers in those with HIV are driven by HIV infection or by the increased comorbidity burden among the HIV infected.
The objective of this study was to investigate the effect of HIV status on biomarkers of inflammation, altered coagulation, and monocyte activation in the Veterans Aging Cohort Study (VACS). VACS contains detailed clinical data on HIV measures, substance use, and comorbidity, and also an uninfected population with a comparable comorbidity burden.
METHODS
Subject Selection
Subjects were selected from the VACS [15]. Briefly, the VACS is an observational, prospective longitudinal study of HIV-infected and age, race/ethnicity, sex, and site-matched uninfected veterans in care from 8 US Department of Veterans Affairs (VA) medical centers across the United States. In 2005–2006, the VACS collected and banked blood and DNA specimens on enrolled subjects from these sites. A total of 1525 HIV-infected and 843 uninfected VACS participants consented to provide blood specimens for future studies. These specimens were collected using serum separator and ethylenediaminetetraacetic acid blood collection tubes, and shipped to a central repository at the Massachusetts Veterans Epidemiology Research and Information Center in Boston, Massachusetts.
Independent Variable
HIV status was our primary independent variable. To understand the effects of poor viral suppression and immune depletion, we stratified HIV by viral RNA (uninfected; HIV-infected with RNA <500 or ≥500 copies/mL) and by CD4 lymphocyte count (uninfected; HIV-infected with CD4 count <200, 200–499, or ≥500 cells/µL). We further stratified these variables by antiretroviral therapy (ART) to understand the impact of ART among those with poor viral suppression or immune depletion. Current ART status was defined as taking ART within 90 days before or up to 7 days after blood specimen collection.
Dependent Variables
Biomarkers of inflammation (interleukin 6 [IL-6]), altered coagulation (d-dimer), and monocyte activation (soluble CD14 [sCD14]) were our dependent variables (Laboratory for Clinical Biochemistry Research, University of Vermont). IL-6 was measured using a chemiluminescent immunoassay (QuantiGlo IL-6 immunoassay, R&D Systems, Minneapolis, MN). Calibration was performed by the manufacturer and is traceable to National Institute for Biological Standards and Control 89/548 (IU/mL). Four levels of controls were run per sample, with the interassay coefficients of variability (CVs) ranging from 7.68% to 12.29%. d-dimer was measured using the STAR automated coagulation analyzer (Diagnostica Stago), using an immunoturbidometric assay (Liatest D-DI; Diagnostica Stago, Parsippany, NJ). Four controls, with interassay CVs ranging from 2.77% to 14.78%, were used. The lab measured sCD14 with an enzyme-linked immunosorbent assay (Quantikine sCD14 Immunoassay, R&D Systems) with a detectable range of 40–3200 ng/mL, using a standard 200-fold sample dilution. Again, 4 controls were used, with interassay CVs ranging from 7.19% to 8.11%.
Covariates
Sociodemographic data included age, sex, and race/ethnicity. We defined prevalent CVD as any of the following occurring prior to the date of blood specimen collection: (1) a myocardial infarction as defined by the VA Ischemic Heart Disease Quality Enhancement Research Initiative (IHD-QUERI) [16]; (2) International Classification of Disease (ICD-9) or Current Procedural Terminology (CPT) codes for unstable angina (not acute myocardial infarction), congestive heart failure, coronary artery bypass graft, percutaneous coronary intervention, and ischemic stroke.
Blood pressure was averaged over the 3 routine outpatient blood pressure measurements performed closest to the date of blood specimen collection. Hypertension was categorized on the basis of Joint National Committee on Prevention, Detection, Evaluation, and Treatment of High Blood Pressure thresholds as no hypertension (blood pressure <120/80 mm Hg and no documentation of antihypertensive medication), prehypertension (120–139/80–89 mm Hg and no antihypertensive medication), controlled hypertension (<140/90 mm Hg and documentation of antihypertensive medication), or uncontrolled hypertension (blood pressure ≥140/90 mm Hg) [17].
Diabetes was diagnosed using glucose measurements, use of insulin or oral hypoglycemic agents, and/or ≥1 inpatient and/or 2 outpatient ICD-9 codes [18]. Body mass index (BMI) and current, past, and never smoking were determined from the VA Health Factors data set [19].
Cholesterol-lowering medication use was assessed using patient pharmacy data. Cholesterol measurements (ie, high-density lipoprotein [HDL], low-density lipoprotein [LDL], and serum triglycerides) were obtained from the VA Decision Support System (DSS). HDL was categorized as high, medium, or low (≥60, 40–59, <40 mg/dL, respectively); LDL as optimal, near optimal, borderline high, or high/very high (<100, 100–129, 130–159, ≥160 mg/dL, respectively); and serum triglycerides as normal, borderline high, or high/very high (<150, 150–199, ≥200 mg/dL, respectively) per National Cholesterol Education Program Adult Treatment Panel III criteria [20].
Cocaine and alcohol use were determined by self-report. We categorized alcohol use with data from the Alcohol Use Disorders Identification Test (AUDIT-C) and alcohol abuse and dependence diagnoses using ICD-9 codes on the basis of prior work in VACS [21]: (1) current infrequent/moderate drinking without alcohol abuse/dependence diagnosis, (2) current infrequent/moderate drinking with abuse/dependence diagnosis, (3) current hazardous drinking with or without abuse/dependence diagnosis, and (4) past drinking. Hepatitis C virus (HCV) infection was defined as a positive HCV antibody test or at least 1 inpatient and/or 2 outpatient ICD-9 codes [22]. Renal disease was defined as an estimated glomerular filtration rate (eGFR) of <60 mL/min/1.73m2 per National Kidney Foundation Kidney Disease Outcomes Quality Initiative thresholds for chronic kidney disease [23].
We collected data on HIV-1 RNA, CD4 lymphocyte count, and current antiretroviral therapy (ART). We used CD4 lymphocyte counts and HIV-1 RNA measurements obtained as part of clinical care at the closest time point within 180 days before or after the date of the blood specimen collection.
Statistical Analysis
Variables that were normally distributed, continuous but not normally distributed, or categorical were compared by HIV status using t tests, Wilcoxon rank sum tests, or χ2 tests, respectively. Mean age and race/ethnicity-adjusted biomarker levels were compared by linear regression after transforming biomarker variables to approximate normality.
We used multivariable logistic regression to estimate the association between HIV infection and prevalence of elevated (ie, >75th percentile) IL-6, d-dimer, and sCD14. For each biomarker, we assessed the association between the biomarker and (1) HIV status, (2) HIV stratified by RNA, (3) HIV stratified by CD4 lymphocyte count, and (4) HIV stratified by CD4 lymphocyte count or RNA and ART. Uninfected veterans were the reference group for all HIV comparisons. All regression models were adjusted for (1) age, race/ethnicity; and (2) age, race/ethnicity, prevalent CVD, hypertension, diabetes, smoking, BMI, cholesterol lowering medication use, HDL, LDL, triglycerides, cocaine use in the past year, alcohol use, HCV infection, and renal disease. We analyzed 2-way interactions between HIV and each covariate, and included significant interactions (P < .05) in the final regression models.
We also performed secondary analyses excluding comorbid conditions associated with our outcomes to better understand the independent effect of HIV infection on prevalence of elevated IL-6, d-dimer, and sCD14. Specifically, we excluded veterans with confounding comorbid behaviors (current hazardous drinking or smoking) or diseases (CVD, uncontrolled hypertension, diabetes, BMI ≥30 kg/m2, BMI <18 kg/m2, HCV, renal disease).
To address missing covariate data, we used multiple imputation to generate 10 complete data sets to increase the robustness of estimated associations. Multiple imputation was performed using the ICE command [24] (Stata v11.0; StataCorp).
RESULTS
We collected 2345 IL-6 measurements, 2352 d-dimer measurements, and 2357 sCD14 measurements. Compared to uninfected veterans, HIV-infected veterans were slightly younger (51.8 vs 53.5 years; P < .01), more likely to be male (97.3% vs 90.4%), and had less prevalent CVD (6.3% vs 12.8%), uncontrolled hypertension (24.3% vs 28.7%), diabetes (19.5% vs 31.8%), BMI ≥30 kg/m2 (14.2% vs 42.9%), cholesterol-lowering medication use (26.9% vs 40.1%), current hazardous drinking (24.7% vs 27.2%), and renal disease (8.1% vs 10.2%) (P < .05 for all; Table 1).
Table 1.
Baseline Characteristics of Study Population
| Characteristics | HIV Infected (N = 1525) | HIV Uninfected (N = 843) | P Value |
|---|---|---|---|
| Demographics (%) | |||
| Age, years (mean ± SD) | 51.8 ± 8.2 | 53.5 ± 9.3 | <.01 |
| Male | 97.3 | 90.4 | <.01 |
| Race | |||
| White | 19.0 | 20.9 | |
| Black | 69.0 | 67.3 | .69 |
| Hispanic | 8.3 | 7.8 | |
| Other | 3.8 | 4.0 | |
| CVD risk factors (%) | |||
| Prevalent CVD | 6.3 | 12.8 | <.01 |
| Hypertension | <.01 | ||
| No hypertension | 17.8 | 9.9 | |
| Prehypertension | 25.2 | 18.9 | |
| Controlled hypertension | 32.5 | 42.6 | |
| Uncontrolled hypertension | 24.3 | 28.7 | |
| Diabetes | 19.5 | 31.8 | <.01 |
| Smokinga | <.01 | ||
| Current | 50.6 | 47.3 | |
| Past | 28.3 | 29.1 | |
| Never | 8.9 | 22.1 | |
| BMI, kg/m2a | <.01 | ||
| <18 | 2.0 | 0.6 | |
| 18–24.9 | 45.3 | 22.1 | |
| 25–29.9 | 36.5 | 33.1 | |
| ≥30 | 14.2 | 42.9 | |
| Cholesterol-lowering agent use | 26.9 | 40.1 | <.01 |
| HDL cholesterol, mg/dLa | <.01 | ||
| High (≥60) | 11.2 | 10.6 | |
| Medium (40–59) | 40.7 | 51.4 | |
| Low (<40) | 44.8 | 33.6 | |
| LDL cholesterol, mg/dLa | <.01 | ||
| Optimal (<100) | 33.3 | 31.6 | |
| Near optimal (100–129) | 18.8 | 18.3 | |
| Borderline high (130–159) | 8.8 | 8.8 | |
| High/very high (≥160) | 10.4 | 5.2 | |
| Triglycerides, mg/dLa | <.01 | ||
| Normal (<150) | 42.3 | 44.5 | |
| Borderline high (150–199) | 13.2 | 9.1 | |
| High/very high (≥200) | 22.7 | 12.0 | |
| Other risk factors (%) | |||
| Cocaine in past year (%) | 20.3 | 17.6 | .03 |
| Hazardous drinking(%)a | .04 | ||
| Current infrequent/moderate drinking | 24.4 | 19.2 | |
| Abuse/dependence; no current hazardous drinking | 8.3 | 9.3 | |
| Current hazardous drinking | 24.7 | 27.2 | |
| Past drinking | 9.9 | 9.0 | |
| HCV (%) | 45.1 | 30.8 | <.01 |
| eGFR<60 (%) | 8.1 | 10.2 | .03 |
| Laboratory analysis | |||
| CD4+ T-lymphocyte count, cells/µLa | |||
| Median (mean ± SD) | 392 (432.0 ± 278.1) | – | |
| ≥500 (%) | 33.4 | – | |
| 200–499 (% ) | 43.8 | – | |
| <200 (%) | 20.4 | – | |
| HIV RNA, copies/mLa | |||
| Median (mean ± SD) | 75 (20 633 ± 73 540) | – | |
| <500 (%) | 65.3 | – | |
| ≥500 (%) | 33.0 | – | |
| Class of antiretroviral therapy (%) | |||
| Protease inhibitors | 45.7 | – | |
| Nonnucleoside reverse transcriptase inhibitors | 34.7 | – | |
| Nucleoside analog reverse transcriptase inhibitors | 76.7 | – | |
| Biomarkers of inflammation, altered coagulation, monocyte activation | |||
| IL-6, pg/mL median (mean ± SD)a | 2.08 (3.36 ± 7.47) | 1.79 (3.70 ± 14.82) | <.01 |
| >75th percentile IL-6 (%) | 25.8 | 22.9 | <.01 |
| d-dimer, μg/mL median (mean ± SD)a | 0.26 (0.50 ± 1.08) | 0.30 (0.54 ± 0.93) | <.01 |
| >75th percentile d-dimer (%) | 23.7 | 26.0 | <.01 |
| sCD14, μg/mL median (mean ± SD)a | 1.72 (1.82 ± 0.55) | 1.73 (1.81 ± 0.49) | .95 |
| >75th percentile sCD14 (%) | 25.8 | 23.3 | <.01 |
Abbreviations: BMI, body mass index; CVD, cardiovascular disease; eGFR, estimated glomerular filtration rate; HCV, hepatitis C virus; HDL, high-density lipoprotein; HIV, human immunodeficiency virus; HIV-1, human immunodeficiency virus type-1; LDL, low-density lipoprotein; SD, standard deviation.
a For smoking (N = 1340 HIV infected, 830 HIV uninfected); BMI (N = 1493 HIV infected, 832 HIV uninfected); HDL cholesterol (N = 1173 HIV infected, 590 HIV uninfected); LDL cholesterol (N = 1086 HIV infected, 538 HIV uninfected); triglycerides (N = 1191 HIV infected, 553 HIV uninfected); cocaine (N = 1468 HIV infected, 795 HIV uninfected); hazardous drinker (N = 1017 HIV infected; 536 HIV uninfected); EGFR (N = 1525 HIV infected, 841 HIV uninfected); CD4+ lymphocyte count (N = 1488); HIV-1 RNA (N = 1499); IL-6 (N = 1521 HIV infected, 824 HIV uninfected); d-dimer (N = 1523 HIV infected, N = 829 HIV uninfected); sCD14 (N = 1525 HIV infected; N = 832 HIV uninfected).
HIV-infected veterans had more prevalent current smoking (50.6% vs 47.3%), low HDL (44.8% vs 33.6%), high/very high LDL (10.4% vs 5.2%), high/very high triglycerides (22.7% vs 12.0%), cocaine use in the past year (20.3% vs 17.6%), and HCV infection (45.1% vs 30.8%) (P < .05 for all; Table 1).
Differences in median biomarker levels between infected and uninfected veterans were most apparent when HIV was stratified by HIV-1 RNA or CD4 lymphocyte count (Figure 1). Median IL-6 was greater in HIV-infected compared to uninfected veterans (2.08 vs 1.79 pg/mL; P < .01), whereas the reverse was true for median d-dimer (0.26 vs 0.30 μg/mL; P < .01). There was no difference between the 2 groups for median sCD14 (1.72 vs 1.73 μg/mL; P = .95) (Table 1).
Figure 1.
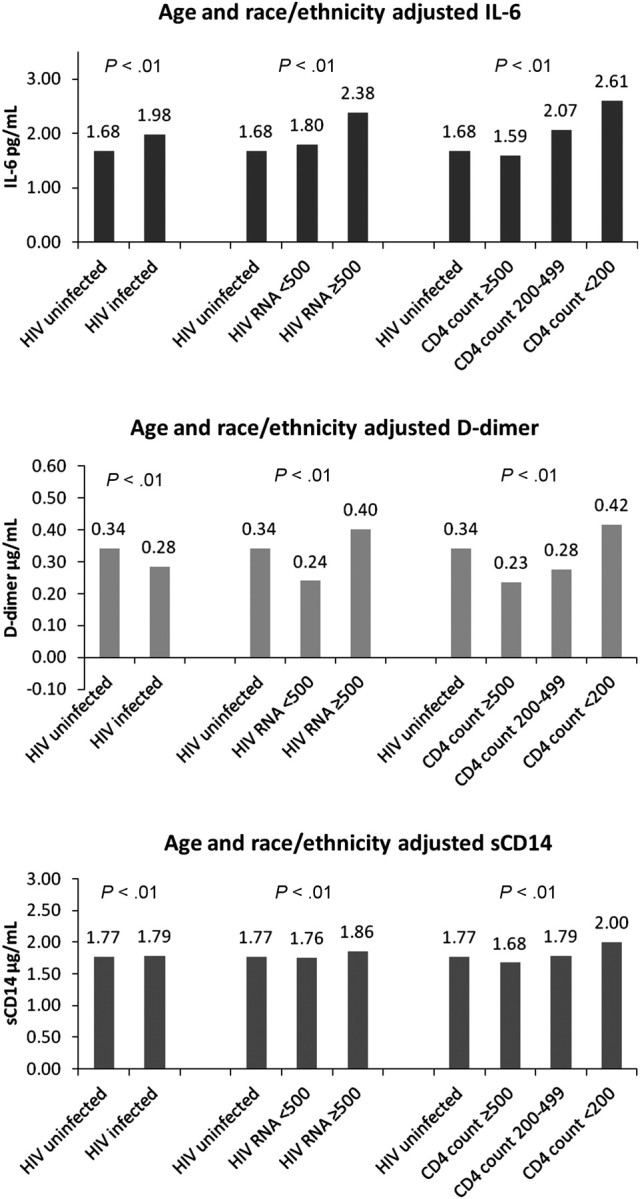
Distribution of age- and race/ethnicity-adjusted interleukin 6 (IL-6), d-dimer, and soluble CD14 (sCD14) levels by human immunodeficiency virus (HIV) status, HIV-1 RNA level, and CD4 lymphocyte count.
In age- and race/ethnicity-adjusted logistic regression models, HIV status was not associated with a higher prevalence of elevated IL-6 (OR, 1.18; 95% CI, .96–1.44), d-dimer (0.91; 0.74–1.11), or sCD14 (1.16; 0.95–1.42). After full covariate adjustment, the ORs (95% CI) for the association with IL-6, d-dimer, and sCD14 were 0.81 (.55–1.19), 0.95 (.75–1.20), and 0.79 (.62–1.02), respectively (Table 2).
Table 2.
The Association Between HIV Infection and Elevated (>75th Percentile) Biomarkers of Inflammation (IL-6), Altered Coagulation (d-dimer), and Monocyte Activation (sCD14)
| IL-6 |
D-dimer |
sCD14 |
||||
|---|---|---|---|---|---|---|
| Characteristics | OR | 95% CI | OR | 95% CI | OR | 95% CI |
| HIV uninfected | 1.00 | – | 1.00 | – | 1.00 | – |
| HIV infected | 0.81 | (.55–1.19) | 0.95 | (.75–1.20) | 0.79 | (.62–1.02) |
| Age <40, years | 1.00 | – | 1.00 | – | 1.00 | – |
| 40–49 | 0.93 | (.57–1.52) | 0.86 | (.53–1.40) | 1.10 | (.67–1.82) |
| 50–59 | 1.36 | (.84–2.22) | 1.28 | (.79–2.07) | 1.24 | (.75–2.04) |
| 60–69 | 1.80 | (1.05–3.08) | 1.51 | (.88–2.57) | 1.26 | (.72–2.20) |
| ≥70 | 2.15 | (1.07–4.31) | 2.23 | (1.15–4.32) | 1.30 | (.64–2.65) |
| White race | 1.00 | – | 1.00 | – | 1.00 | – |
| Blacka | 0.59 | (.40–.88) | 1.63 | (1.22–2.18) | 0.85 | (.65–1.11) |
| Hispanic | 1.22 | (.81–1.82) | 1.29 | (.83–2.01) | 0.98 | (.65–1.46) |
| Other | 0.73 | (.42–1.28) | 1.21 | (.68–2.14) | 0.76 | (.44–1.31) |
| Prevalent CVD | 1.39 | (.98–1.98) | 1.89 | (1.35–2.65) | 1.17 | (.82–1.66) |
| Normal BP, mm Hg | 1.00 | – | 1.00 | – | 1.00 | – |
| Prehypertension | 0.68 | (.48–.96) | 0.86 | (.60–1.22) | 0.88 | (.63–1.23) |
| Controlled hypertension | 1.01 | (.73–1.40) | 1.14 | (.82–1.58) | 1.19 | (.86–1.64) |
| Uncontrolled hypertension | 1.21 | (.87–1.68) | 1.44 | (1.02–2.02) | 0.91 | (.64–1.28) |
| Diabetes | 1.19 | (.93–1.54) | 0.99 | (.77–1.28) | 1.26 | (.98–1.62) |
| Never smoker | 1.00 | – | 1.00 | – | 1.00 | – |
| Current | 1.67 | (1.17–2.37) | 1.28 | (0.92–1.79) | 1.23 | (.88–1.73) |
| Past | 1.06 | (.74–1.53) | 1.19 | (.83–1.72) | 1.15 | (.81–1.63) |
| BMI 18–25, kg/m2 | 1.00 | – | 1.00 | – | 1.00 | – |
| <18 | 1.23 | (.58–2.60) | 1.72 | (.83–3.58) | 0.78 | (.35–1.73) |
| 25–29 | 0.85 | (.67–1.09) | 0.72 | (.57–.93) | 0.55 | (.43–.70) |
| >30 | 1.33 | (1.00–1.78) | 0.98 | (.74–1.31) | 0.43 | (.32–.59) |
| Cholesterol-lowering medication | 0.64 | (.50–.83) | 0.89 | (.69–1.14) | 1.10 | (.86–1.41) |
| High HDL (>60), mg/dL | 1.00 | – | 1.00 | – | 1.00 | – |
| Medium (40–59) | 1.39 | (.98–1.98) | 1.01 | (.72–1.41) | 1.14 | (.78–1.65) |
| Low (<40) | 1.69 | (1.16–2.48) | 1.79 | (1.25–2.56) | 1.28 | (.88–1.87) |
| Optimal LDL(<100), mg/dL | 1.00 | – | 1.00 | – | 1.00 | – |
| Near optimal (100–129) | 0.88 | (.66–1.18) | 0.77 | (.58–1.02) | 0.91 | (.69–1.18) |
| Borderline high (130–159) | 0.84 | (.57–1.26) | 1.23 | (.84–1.80) | 0.86 | (.58–1.27) |
| High or very high (≥160) | 0.82 | (.57–1.19) | 0.94 | (.65–1.36) | 0.81 | (.59–1.11) |
| Normal triglyceride (<150), mg/dL | 1.00 | – | 1.00 | – | 1.00 | – |
| Borderline high (150–199) | 1.05 | (.76–1.44) | 0.79 | (.56–1.11) | 1.36 | (1.00–1.84) |
| High or very high (≥200) | 0.90 | (.68–1.20) | 0.74 | (.55–.99) | 1.60 | (1.19–2.14) |
| Cocaine use in last year | 1.25 | (.94–1.65) | 1.25 | (.94–1.65) | 0.93 | (.70–1.23) |
| Infrequent/moderate drinking | 1.00 | – | 1.00 | – | 1.00 | – |
| Abuse/dependence; no current hazardous drinking | 1.24 | (.81–1.91) | 0.94 | (.61–1.43) | 1.20 | (.79–1.83) |
| Current hazardous drinking | 1.67 | (1.22–2.29) | 1.21 | (.88–1.67) | 1.30 | (.95–1.77) |
| Past drinking | 1.94 | (1.45–2.58) | 1.25 | (.95–1.65) | 1.19 | (.90–1.57) |
| HCVa | 1.05 | (.84–1.32) | 0.89 | (.71–1.13) | 1.51 | (1.20–1.89) |
| eGFR <60 mL/min/1.73 m2a | 1.06 | (.61–1.86) | 2.54 | (1.84–3.48) | 1.86 | (1.11–3.11) |
IL-6 (N = 2345); d-dimer (N = 2352); sCD14 (N = 2357).
Abbreviations: BMI, body mass index; CI, confidence interval; CVD, cardiovascular disease; eGFR, estimated glomerular filtration rate; HCV, hepatitis C virus infection; HDL, high-density lipoprotein; HIV, human immunodeficiency virus; LDL, low-density lipoprotein; OR, odds ratio.
a Significant interactions with HIV infection: IL-6 (black race and eGFR<60 mL/min/1.73 m2); d-dimer (none); sCD14 (eGFR<60 mL/min/1.73 m2).
However, compared to uninfected veterans, HIV-infected veterans with HIV-1 RNA ≥500 copies/mL or CD4 count <200 cells/µL had a significantly higher prevalence of elevated IL-6 (OR, 1.54; 95% CI, 1.14–2.09; and OR, 2.25; 95% CI, 1.60–3.16, respectively) and d-dimer (OR, 1.97; 95% CI, 1.44–2.71; and OR, 1.68; 95% CI, 1.22–2.32, respectively) after adjusting for confounders. HIV-infected veterans with a CD4 cell count <200 cells/µL had significantly higher prevalence of elevated sCD14 compared to uninfected veterans (OR, 2.60; 95% CI, 1.64–4.14).
In the adjusted HIV status model, the covariates age ≥60 years, current smoking, low HDL, and current hazardous or past drinking were also associated with higher prevalence of elevated IL-6 (P < .05 for all; Table 2). Age ≥70 years, black race/ethnicity, prevalent CVD, uncontrolled hypertension, low HDL, and renal disease were significantly associated with d-dimer (P < .05 for all; Table 2). High/very high triglycerides, HCV infection, and renal disease were significantly associated with sCD14 (P < .05 for all; Table 2). These covariate associations were of comparable (or greater) magnitude to associations for the HIV variables. The magnitudes of the covariate associations were similar in the models stratified by HIV-1 RNA or CD4 lymphocyte count.
HIV status had significant interactions with black race and renal disease (P < .05 for both; Table 2). HIV-1 RNA had significant interactions with renal disease, diabetes, and HCV infection (P < .05 for all; Table 3). CD4 lymphocyte count had significant interactions with renal disease, current hazardous drinking, and HCV infection (P < .05 for all; Table 3).
Table 3.
Association Between HIV Infection Stratified by (a) HIV-1 RNA, and (b) CD4 Lymphocyte Count and Elevated (>75th Percentile) Biomarkers of Inflammation (IL-6), Altered Coagulation (d-dimer), and Monocyte Activation (sCD14)
| IL-6 |
d-dimer |
sCD14 |
||||
|---|---|---|---|---|---|---|
| Model | OR | 95% CI | OR | 95% CI | OR | 95% CI |
| (a) | ||||||
| (i) Age- and race/ethnicity-adjusted model | ||||||
| HIV uninfected | 1.00 | – | 1.00 | – | 1.00 | – |
| HIV infected; RNA < 500 | 0.97 | (.77–1.21) | 0.64 | (.51–0.81) | 1.09 | (.88–1.35) |
| HIV infected; RNA ≥ 500 | 1.69 | (1.31–2.18) | 1.61 | (1.26–2.06) | 1.40 | (1.08–1.81) |
| (ii) Fully adjusted model | ||||||
| HIV uninfected | 1.00 | – | 1.00 | – | 1.00 | – |
| HIV infected; RNA < 500 | 1.04 | (.79–1.36) | 0.71 | (.53–.97) | 0.89 | (.63–1.26) |
| HIV infected; RNA ≥ 500 | 1.54 | (1.14–2.09) | 1.97 | (1.44–2.71) | 1.48 | (1.00–2.20) |
| (b) | ||||||
| (i) Age- and race/ethnicity-adjusted model | ||||||
| HIV uninfected | 1.00 | – | 1.00 | – | 1.00 | – |
| HIV infected; CD4+ count ≥ 500 | 0.57 | (.42–.76) | 0.56 | (.42–.74) | 0.76 | (.58–1.01) |
| HIV infected; CD4+ count 200–499 | 1.31 | (1.04–1.66) | 0.89 | (.70–1.14) | 1.06 | (.83–1.35) |
| HIV infected; CD4+ count <200 | 2.30 | (1.73–3.06) | 1.76 | (1.33–2.34) | 2.51 | (1.89–3.32) |
| (ii) Fully adjusted model | ||||||
| HIV uninfected | 1.00 | – | 1.00 | – | 1.00 | – |
| HIV infected; CD4+ count ≥500 | 0.58 | (.41–.82) | .61 | (.45–.84) | 1.04 | (.67–1.60) |
| HIV infected; CD4+ count 200–499 | 1.41 | (1.06–1.88) | .97 | (.74–1.27) | 1.25 | (.83–1.87) |
| HIV infected; CD4+ count <200 | 2.25 | (1.60–3.16) | 1.68 | (1.22–2.32) | 2.60 | (1.64–4.14) |
Reference for all comparisons is HIV uninfected. HIV-1 RNA (copies/mL), CD4 count (cells/µL).
Models are adjusted for (i) age and race/ethnicity, and (ii) all covariates.
a) IL-6 (N = 2319); d-dimer (N = 2326); sCD14 (N = 2331).
Significant interactions in fully adjusted model (ii): IL-6 (HIV-1 RNA < or ≥500 and eGFR<60 mL/min/1.73 m2; P < .05), D-dimer (HIV-1 RNA ≥500 and diabetes; P < .05), sCD14 (HIV-1 RNA < or ≥500 and HCV, HIV-1 RNA <500 and eGFR <60 mL/min/1.73 m2; P ≤ .05 for all).
b) IL-6 (N = 2308); d-dimer (N = 2315); sCD14 (N = 2320).
Significant interactions in fully adjusted model ii: IL-6 (CD4 ≥ 200 and eGFR < 60 mL/min/1.73 m2; P ≤ .05), sCD14 (CD4 ≥200 and current hazardous drinking, any CD4 count and HCV; P < .05 for all).
Abbreviations: CI, confidence interval; eGFR, estimated glomerular filtration rate; HCV, hepatitis C virus; HIV, human immunodeficiency virus; IL-6, interleukin 6; OR, odds ratio; sCD14, soluble CD14.
When we stratified HIV-1 RNA and CD4 lymphocyte counts by current ART status, only modest differences in the prevalence of elevated IL-6 and d-dimer between those on ART and not on ART were observed (Table 4).
Table 4.
Association Between HIV Infection and Elevated (>75%) Biomarkers of Inflammation (IL-6), Altered Coagulation (d-dimer), and Monocyte Activation (sCD14)
| IL-6 |
d-dimer |
sCD14 |
||||
|---|---|---|---|---|---|---|
| OR | 95% CI | OR | 95% CI | OR | 95% CI | |
| (a) | ||||||
| HIV uninfected | 1.00 | – | 1.00 | – | 1.00 | – |
| HIV-1 RNA <500; ART– | 0.82 | (.47–1.42) | 0.58 | (.33–1.03) | 0.57 | (.33–.99) |
| HIV-1 RNA <500; ART+ | 1.19 | (.92–1.55) | 0.71 | (.54–0.92) | 0.87 | (.67–1.12) |
| HIV-1 RNA ≥500; ART– | 1.40 | (.97–2.02) | 1.54 | (1.08–2.19) | 0.62 | (.42–.93) |
| HIV-1 RNA ≥500; ART+ | 2.04 | (1.45–2.88) | 1.62 | (1.15–2.27) | 1.54 | (1.10–2.15) |
| (b) | ||||||
| HIV uninfected | 1.00 | – | 1.00 | – | 1.00 | – |
| CD4≥200; ART– | 0.95 | (.66–1.38) | 1.03 | (.73–1.47) | 0.37 | (.24–.57) |
| CD4≥200; ART+ | 1.16 | (.89–1.50) | 0.73 | (.56–.95) | 0.82 | (.63–1.06) |
| CD4<200; ART– | 2.73 | (1.60–4.65) | 1.85 | (1.08–3.18) | 1.96 | (1.14–3.36) |
| CD4<200; ART+ | 2.31 | (1.62–3.27) | 1.60 | (1.12–2.26) | 1.82 | (1.29–2.56) |
Stratified by (a) HIV-1 RNA (copies/mL) and (b) CD4 lymphocyte count (cells/µL) and use of antiretroviral therapy (ART) and adjusted for all covariates.
a) IL-6 (N = 2319); d-dimer (N = 2326); sCD14 (N = 2331).
b) IL-6 (N = 2308); d-dimer (N = 2315); sCD14 (N = 2320).
Abbreviations: ART, antiretroviral therapy; CI, confidence interval; HIV-1, human immunodeficiency virus-1; OR, odds ratio.
To assess the impact of HIV on elevated biomarker independent of confounding comorbidities, we excluded veterans with prevalent comorbid behaviors or diseases (Table 5) that were associated with elevated biomarkers. Among these subsets of “healthier” veterans, the magnitude of the association between HIV infection and prevalence of elevated biomarkers persisted, and in some cases, was increased.
Table 5.
Effect of Excluding Veterans With Selected Comorbid Behaviors and Diseases on the Association Between HIV Infection and Prevalence of Elevated (>75th%) Biomarkers of Inflammation (IL-6), Altered Coagulation (d-dimer), and Monocyte Activation (sCD14) Stratified by (a) HIV Status, (b) HIV-1 RNA, and (c) CD4 Count and Adjusted for All Covariates
| Adjusted OR (95% CI) |
||||||||
|---|---|---|---|---|---|---|---|---|
| Reference |
Model 1 |
Model 2 |
Model 3 |
|||||
| Biomarkers | Comorbidities Omitted | HIV Uninfected | HIV Infected | HIV-1 RNA <500 | HIV-1 RNA ≥500 | CD4 Count ≥500 | CD4 Count 200–499 | CD4 Count <200 |
| IL-6 | ||||||||
| None | 1.00 | 0.81 | 1.04 | 1.54 | 0.58 | 1.41 | 2.25 | |
| – | (0.55–1.19) | (0.79–1.36) | (1.14–2.09) | (0.41–0.82) | (1.06–1.88) | (1.60–3.16) | ||
| Behaviors | 1.00 | 1.39 | 1.24 | 1.84 | 0.73 | 1.61 | 2.82 | |
| – | (0.91–2.12) | (0.79–1.94) | (1.03–3.27) | (0.41–1.28) | (0.98–2.64) | (1.53–5.19) | ||
| Diseases | 1.00 | 1.36 | 0.92 | 2.37 | 0.64 | 1.26 | 3.95 | |
| – | (0.77–2.39) | (0.49–1.73) | (1.23–4.57) | (0.29–1.41) | (0.65–2.44) | (1.91–8.2) | ||
| d-dimer | ||||||||
| None | 1.00 | 0.95 | 0.71 | 1.97 | 0.61 | 0.97 | 1.68 | |
| – | (0.75–1.20) | (0.53–0.97) | (1.44–2.71) | (0.45–0.84) | (0.74–1.27) | (1.22–2.32) | ||
| Behaviors | 1.00 | 0.71 | 0.56 | 1.27 | 0.49 | 0.75 | 1.21 | |
| – | (0.48–1.05) | (0.36–0.85) | (0.75–2.17) | (0.29–0.82) | (0.47–1.22) | (0.66–2.25) | ||
| Diseases | 1.00 | 1.33 | 0.67 | 3.04 | 0.60 | 1.14 | 3.67 | |
| – | (0.76–2.32) | (0.35–1.26) | (1.61–5.74) | (0.28–1.30) | (0.60–2.18) | (1.82–7.38) | ||
| sCD14 | ||||||||
| None | 1.00 | 0.79 | 0.89 | 1.48 | 1.04 | 1.25 | 2.60 | |
| – | (0.62–1.02) | (0.63–1.26) | (1.00–2.20) | (0.67–1.60) | (0.83–1.87) | (1.64–4.14) | ||
| Behaviors | 1.00 | 1.39 | 1.23 | 2.08 | 1.17 | 1.28 | 2.43 | |
| – | (0.91–2.14) | (0.79–1.92) | (1.17–3.72) | (0.7–1.94) | (0.78–2.12) | (1.32–4.49) | ||
| Diseases | 1.00 | 0.92 | 0.72 | 1.51 | 0.76 | 0.67 | 2.36 | |
| – | (0.56–1.52) | (0.42–1.24) | (0.83–2.75) | (0.41–1.42) | (0.36–1.22) | (1.21–4.58) | ||
Reference for all models is HIV uninfected.
Independent variables: Model 1 (HIV status); Model 2 (HIV status stratified by HIV-1 RNA [copies/mL]); Model 3 (HIV status stratified by CD4 lymphocyte count [cells/µL]).
Covariates: All models were adjusted for the following covariates excluding the comorbidities omitted: age, race/ethnicity, prevalent CVD, hypertension, diabetes, smoking, BMI, cholesterol lowering medication use, HDL, LDL, triglycerides, cocaine use in the past year, hazardous drinking, HCV, and renal disease.
Comorbid behaviors omitted: current smoking, current hazardous alcohol drinking. Regression sample size ranges from 891 to 908 due to covariate variation between imputed datasets and missingness of outcomes and independent variables.
Comorbid diseases omitted: CVD, uncontrolled hypertension, diabetes, BMI ≥30 kg/m2, BMI <18 kg/m2, HCV, renal disease. Regression sample size ranges from 574 to 587 due to covariate variation between imputed datasets and missingness of outcomes and independent variables.
Abbreviations: BMI, body mass index; CI, confidence interval; CVD, cardiovascular disease; eGFR, estimated glomerular filtration rate; HCV, hepatitis C virus; HDL, high-density lipoprotein; HIV-1, human immunodeficiency virus type-1; LDL, low-density lipoprotein; OR, odds ratio.
DISCUSSION
Compared to uninfected veterans, infected veterans with HIV-1 RNA ≥500 copies/mL had a higher prevalence of elevated IL-6 and d-dimer. HIV-infected veterans with CD4 lymphocyte counts <200 cells/µL had a higher prevalence of elevated IL-6, d-dimer, and sCD14 compared to uninfected veterans. Importantly, the increased prevalence of these elevated biomarkers among HIV-infected veterans occurred despite the fact that the uninfected veterans had similar or higher prevalence of comorbid conditions that were also strongly and significantly associated with prevalence of elevated biomarkers.
Our data confirm that comorbid conditions like CVD and renal disease are important contributors to the prevalence of elevated biomarkers. However, excluding veterans with confounding comorbid behaviors or diseases did not diminish the associations between HIV and increased prevalence of elevated biomarkers. The magnitude of some associations actually increased among veterans with high viremia or immune depletion. Together, these findings point to the importance of addressing both HIV- and non–HIV-related morbidity in clinical practice to potentially minimize elevations in these biomarkers that are associated with mortality and cardiovascular disease.
Our findings are consistent with prior studies demonstrating a significant association between HIV infection and elevated IL-6 and d-dimer. Neuhaus et al [12] showed that IL-6 and d-dimer levels were 152% and 94%, respectively—higher among HIV-infected individuals in the Strategies for Management of Antiretroviral Therapy (SMART) study compared to levels in uninfected individuals of similar age in the Multi Ethnic Study of Atherosclerosis (MESA) (P < 0.001 for both). Our study of veterans found age and race/ethnicity adjusted IL-6 and D-dimer levels were 18% higher and lower, respectively, in infected veterans. The smaller difference in these biomarkers in the VACS may be explained by the fact that our uninfected veterans came from the same healthcare clinics as our HIV-infected veterans and thus had a more comparable burden of comorbid disease. For example, smoking and dyslipidemia were less prevalent among uninfected veterans but they also had a higher burden of CVD, obesity and diabetes. In contrast, Neuhaus et al [12] reported that uninfected participants in MESA had a lower prevalence of CVD, diabetes, and smoking compared to HIV-infected participants in the SMART study. Selecting population-based controls or participants from established cohort studies could result in a relatively “healthier” uninfected referent group. Because comorbidities like CVD risk factors are associated with elevated biomarkers of inflammation [25–27], altered coagulation [28–30], and/or monocyte activation [31, 32], the effects of HIV on these biomarkers in HIV-infected veterans may have partially been balanced by the effects of these comorbidities among uninfected veterans in the VACS.
Our results are also consistent with findings by Kuller et al [6], demonstrating that higher levels of IL-6 and d-dimer occurred in participants randomized to the SMART study drug conservation arm (intermittent ART), compared to those in the viral suppression arm (ongoing ART). In our study, unsuppressed HIV-1 RNA and low CD4 lymphocyte counts were each associated with a significantly higher prevalence of elevated IL-6 and d-dimer. It should be noted that our reference group (uninfected individuals) was different from the reference group in SMART (virally suppressed HIV-infected individuals).
Prior studies in HIV-infected and uninfected people reported higher biomarkers of monocyte activation among those infected with HIV [14, 33, 34]. Our results suggest that this phenomenon is specific to those with low CD4 lymphocyte counts as there was no difference in the prevalence of elevated sCD14 by HIV status unless the CD4 lymphocyte count was <200 cells/µL. Although sCD14 is a biomarker of monocyte activation rather than a specific biomarker for microbial translocation, this finding among immune-depleted veterans is consistent with prior work, demonstrating that microbial translocation is associated with chronic HIV infection and substantial CD4 cell depletion in the gastrointestinal tract [35–37]. Differences between our study and prior reports may partially be explained by their smaller sample sizes, restricted generalizability, and the greater comorbid disease burden among their infected versus uninfected participants. Our lack of a significant difference in sCD14 between infected veterans with a CD4 count ≥200 cells/µL and uninfected veterans may partially be explained by the relatively balanced number of risk factors for microbial translocation between the 2 groups—infected veterans had a higher prevalence of HCV infection, whereas uninfected veterans had a higher prevalence of obesity and diabetes, with current hazardous drinking being fairly similar between the 2 groups (Table 1).
Strengths of our study include a large cohort, providing excellent power to detect clinically important differences between HIV-infected and uninfected participants. The cohort also contains important subgroups—particularly blacks and people with HCV infection and/or substance use disorders. Our uninfected veterans have a comparable burden of comorbid conditions to infected veterans. We know this because we have detailed data on important comorbidities such as prevalent CVD, diabetes, blood pressure values, lipid levels, smoking data, and pharmacy refill data on ART.
There are limitations that warrant discussion. First, the cross-sectional study design does not allow us to determine cause and effect. Second, the time window between ART ascertainment and blood specimen collection may have resulted in some misclassification by ART status. Third, it is likely that each biomarker is neither unique to, nor does it completely describe, the complex biologic process of inflammation, altered coagulation, or monocyte activation. The inclusion of lipopolysaccharide and 16S recombinant DNA in combination with sCD14 may provide more accurate insights into the microbial translocation process. Fourth, this study also lacked biomarkers of immune activation (eg, tumor necrosis factor α, interleukin 1β, interleukin 10). Such biomarkers would be valuable for providing insights into the immune response to the inflammatory processes studied. Finally, as our cohort is overwhelmingly male, our results may not be generalizable to women.
In conclusion, HIV-infected veterans with unsuppressed HIV viremia or a low CD4 lymphocyte count had a significantly higher prevalence of elevated IL-6 and d-dimer as compared to uninfected veterans. This was true despite the fact that uninfected veterans had a similar or higher burden of comorbid diseases that were associated with elevations in these biomarkers. Increased monocyte activation as measured by sCD14 only differed by HIV status when infected veterans had CD4 counts <200 cell/µL. These data suggest that both ongoing HIV replication and immune depletion and comorbid conditions like CVD and renal disease, contribute to elevated biomarkers associated with inflammation, altered coagulation, and monocyte activation. Focusing on viremia reduction, CD4 cell restoration, and treatment of non–HIV-related comorbidity may be an important strategy to reduce mortality and CVD risk.
Notes
Disclaimer. The views expressed in this article are those of the authors and do not necessarily reflect the position or policies of the Department of Veterans Affairs.
Acknowledgments. We acknowledge the veterans who participate in the Veterans Aging Cohort Study and the study coordinators and staff at each of our sites and at the West Haven Coordinating Center. Without the commitment and care of these individuals, this research would not be possible. We would also like to acknowledge the substantial in-kind support we receive from the Veterans Affairs Healthcare System.
Financial support. This work was supported by the National Institute on Alcohol Abuse and Alcoholism (NIAAA) and National Heart Lung and Blood Institute (NHLBI) at the National Institutes of Health (NIH; grant numbers K23AA015914–0651, R01HC095136-04, 5R01HC095126-04 to M. F.; and U10AA013566-10 to A. J.).
Potential conflict of interest. K. A., K. A. O., A. G., K. K., S. B., S. D., A. J., and M. F. received NIH/NHLBI/NIAAA grant funding for this work. M. G. has received grant funding and support from Yale University for this work. R. T. has received grant funding from the US Department of Veterans Affairs (VA) through the University of Pittsburgh for this work. R. T. owns Haematologic Technologies and has received funding from Tibotec, Merck, and Abbott, none of which pertain to this work. All other authors report no potential conflicts.
All authors have submitted the ICMJE Form for Disclosure of Potential Conflicts of Interest. Conflicts that the editors consider relevant to the content of the manuscript have been disclosed.
References
- 1.El-Sadr WM, Lundgren JD, Neaton JD, et al. CD4+ count-guided interruption of antiretroviral treatment. N Engl J Med. 2006;355:2283–96. doi: 10.1056/NEJMoa062360. [DOI] [PubMed] [Google Scholar]
- 2.Cushman M, Lemaitre RN, Kuller LH, et al. Fibrinolytic activation markers predict myocardial infarction in the elderly. The Cardiovascular Health Study . Arterioscler Thromb Vasc Biol. 1999;19:493–8. doi: 10.1161/01.atv.19.3.493. [DOI] [PubMed] [Google Scholar]
- 3.Luc G, Bard JM, Juhan-Vague I, et al. C-reactive protein, interleukin-6, and fibrinogen as predictors of coronary heart disease: the PRIME Study. Arterioscler Thromb Vasc Biol. 2003;23:1255–61. doi: 10.1161/01.ATV.0000079512.66448.1D. [DOI] [PubMed] [Google Scholar]
- 4.Wannamethee SG, Whincup PH, Shaper AG, Rumley A, Lennon L, Lowe GD. Circulating inflammatory and hemostatic biomarkers are associated with risk of myocardial infarction and coronary death, but not angina pectoris, in older men. J Thromb Haemost. 2009;7:1605–11. doi: 10.1111/j.1538-7836.2009.03574.x. [DOI] [PMC free article] [PubMed] [Google Scholar]
- 5.Ridker PM, Rifai N, Stampfer MJ, Hennekens CH. Plasma concentration of interleukin-6 and the risk of future myocardial infarction among apparently healthy men. Circulation. 2000;101:1767–72. doi: 10.1161/01.cir.101.15.1767. [DOI] [PubMed] [Google Scholar]
- 6.Kuller LH, Tracy R, Belloso W, et al. Inflammatory and coagulation biomarkers and mortality in patients with HIV infection. PLoS Med. 2008;5:e203. doi: 10.1371/journal.pmed.0050203. [DOI] [PMC free article] [PubMed] [Google Scholar]
- 7.Ford ES, Greenwald JH, Richterman AG, et al. Traditional risk factors and d-dimer predict incident cardiovascular disease events in chronic HIV infection. AIDS. 2010;24:1509–17. doi: 10.1097/QAD.0b013e32833ad914. [DOI] [PMC free article] [PubMed] [Google Scholar]
- 8.Baker J, Quick H, Hullsiek KH, et al. Interleukin-6 and d-dimer levels are associated with vascular dysfunction in patients with untreated HIV infection. HIV Med. 2010;11:608–9. doi: 10.1111/j.1468-1293.2010.00835.x. [DOI] [PMC free article] [PubMed] [Google Scholar]
- 9.Triant VA, Meigs JB, Grinspoon SK. Association of C-reactive protein and HIV infection with acute myocardial infarction. J Acquir Immune Defic Syndr. 2009;51:268–73. doi: 10.1097/QAI.0b013e3181a9992c. [DOI] [PMC free article] [PubMed] [Google Scholar]
- 10.Sandler NG, Wand H, Roque A, et al. Plasma levels of soluble CD14 independently predict mortality in HIV infection. J Infect Dis. 2011;203:780–90. doi: 10.1093/infdis/jiq118. [DOI] [PMC free article] [PubMed] [Google Scholar]
- 11.Raj DS, Carrero JJ, Shah VO, et al. Soluble CD14 levels, interleukin 6, and mortality among prevalent hemodialysis patients. Am J Kidney Dis. 2009;54:1072–80. doi: 10.1053/j.ajkd.2009.06.022. [DOI] [PMC free article] [PubMed] [Google Scholar]
- 12.Neuhaus J, Jacobs DR, Jr., Baker JV, et al. Markers of inflammation, coagulation, and renal function are elevated in adults with HIV infection. J Infect Dis. 2010;201:1788–95. doi: 10.1086/652749. [DOI] [PMC free article] [PubMed] [Google Scholar]
- 13.Baker J, Ayenew W, Quick H, et al. High-density lipoprotein particles and markers of inflammation and thrombotic activity in patients with untreated HIV infection. J Infect Dis. 2010;201:285–92. doi: 10.1086/649560. [DOI] [PMC free article] [PubMed] [Google Scholar]
- 14.Cassol E, Malfeld S, Mahasha P, et al. Persistent microbial translocation and immune activation in HIV-1-infected South Africans receiving combination antiretroviral therapy. J Infect Dis. 2010;202:723–33. doi: 10.1086/655229. [DOI] [PubMed] [Google Scholar]
- 15.Justice AC, Dombrowski E, Conigliaro J, et al. Veterans Aging Cohort Study (VACS): overview and description. Med Care. 2006;44:S13–24. doi: 10.1097/01.mlr.0000223741.02074.66. [DOI] [PMC free article] [PubMed] [Google Scholar]
- 16.Every NR, Fihn SD, Sales AE, Keane A, Ritchie JR. Quality Enhancement Research Initiative in ischemic heart disease: a quality initiative from the Department of Veterans Affairs. QUERI IHD Executive Committee. Med Care. 2000;38:I49–59. [PubMed] [Google Scholar]
- 17.Chobanian AV, Bakris GL, Black HR, et al. The Seventh Report of the Joint National Committee on prevention, detection, evaluation, and treatment of high blood pressure: the JNC 7 report. JAMA. 2003;289:2560–72. doi: 10.1001/jama.289.19.2560. [DOI] [PubMed] [Google Scholar]
- 18.Butt AA, McGinnis K, Rodriguez-Barradas MC, et al. HIV infection and the risk of diabetes mellitus. AIDS. 2009;23:1227–34. doi: 10.1097/QAD.0b013e32832bd7af. [DOI] [PMC free article] [PubMed] [Google Scholar]
- 19.McGinnis KA, Brandt CA, Skanderson M, et al. Validating smoking data from the Veterans Affairs Health Factors Dataset, an electronic data source. Nicotine Tob Res. 2011;13:1233–9. doi: 10.1093/ntr/ntr206. [DOI] [PMC free article] [PubMed] [Google Scholar]
- 20.Executive Summary of The Third Report of The National Cholesterol Education Program (NCEP) Expert Panel on detection, evaluation, and treatment of high blood cholesterol in adults (Adult Treatment Panel III) JAMA. 2001;285:2486–97. doi: 10.1001/jama.285.19.2486. [DOI] [PubMed] [Google Scholar]
- 21.Freiberg MS, McGinnis KA, Kraemer K, et al. The association between alcohol consumption and prevalent cardiovascular diseases among HIV-infected and HIV-uninfected men. J Acquir Immune Defic Syndr. 2010;53:247–53. doi: 10.1097/QAI.0b013e3181c6c4b7. [DOI] [PMC free article] [PubMed] [Google Scholar]
- 22.Goulet JL, Fultz SL, McGinnis KA, Justice AC. Relative prevalence of comorbidities and treatment contraindications in HIV-mono-infected and HIV/HCV-co-infected veterans. AIDS (London, England) 2005;19(suppl 3)):S99–105. doi: 10.1097/01.aids.0000192077.11067.e5. [DOI] [PubMed] [Google Scholar]
- 23.K/DOQI clinical practice guidelines for chronic kidney disease: evaluation, classification, and stratification. Am J Kidney Dis. 2002;39:S1–266. [PubMed] [Google Scholar]
- 24.Royston P. Multiple imputation of missing values: further update of ice, with an emphasis on interval censoring. Stata Journal. 2007;7:445–64. [Google Scholar]
- 25.Thorand B, Lowel H, Schneider A, et al. C-reactive protein as a predictor for incident diabetes mellitus among middle-aged men: results from the MONICA Augsburg cohort study, 1984–1998. Arch Intern Med. 2003;163:93–9. doi: 10.1001/archinte.163.1.93. [DOI] [PubMed] [Google Scholar]
- 26.Pradhan AD, Manson JE, Rifai N, Buring JE, Ridker PM. C-reactive protein, interleukin 6, and risk of developing type 2 diabetes mellitus. JAMA. 2001;286:327–34. doi: 10.1001/jama.286.3.327. [DOI] [PubMed] [Google Scholar]
- 27.Chae CU, Lee RT, Rifai N, Ridker PM. Blood pressure and inflammation in apparently healthy men. Hypertension. 2001;38:399–403. doi: 10.1161/01.hyp.38.3.399. [DOI] [PubMed] [Google Scholar]
- 28.Devaraj S, Xu DY, Jialal I. C-reactive protein increases plasminogen activator inhibitor-1 expression and activity in human aortic endothelial cells: implications for the metabolic syndrome and atherothrombosis. Circulation. 2003;107:398–404. doi: 10.1161/01.cir.0000052617.91920.fd. [DOI] [PubMed] [Google Scholar]
- 29.Abdollahi M, Cushman M, Rosendaal FR. Obesity: risk of venous thrombosis and the interaction with coagulation factor levels and oral contraceptive use. Thromb Haemost. 2003;89:493–8. [PubMed] [Google Scholar]
- 30.Varughese GI, Lip GY. Is hypertension a prothrombotic state? Curr Hypertens Rep. 2005;7:168–73. doi: 10.1007/s11906-005-0005-4. [DOI] [PubMed] [Google Scholar]
- 31.de Kort S, Keszthelyi D, Masclee AA. Leaky gut and diabetes mellitus: what is the link? Obes Rev. 2011;12:449–58. doi: 10.1111/j.1467-789X.2010.00845.x. [DOI] [PubMed] [Google Scholar]
- 32.Cani PD, Bibiloni R, Knauf C, et al. Changes in gut microbiota control metabolic endotoxemia-induced inflammation in high-fat diet-induced obesity and diabetes in mice. Diabetes. 2008;57:1470–81. doi: 10.2337/db07-1403. [DOI] [PubMed] [Google Scholar]
- 33.Lien E, Aukrust P, Sundan A, Muller F, Froland SS, Espevik T. Elevated levels of serum-soluble CD14 in human immunodeficiency virus type 1 (HIV-1) infection: correlation to disease progression and clinical events. Blood. 1998;92:2084–92. [PubMed] [Google Scholar]
- 34.Wallet MA, Rodriguez CA, Yin L, et al. Microbial translocation induces persistent macrophage activation unrelated to HIV-1 levels or T-cell activation following therapy. AIDS. 2010;24:1281–90. doi: 10.1097/QAD.0b013e328339e228. [DOI] [PMC free article] [PubMed] [Google Scholar]
- 35.Brenchley JM, Schacker TW, Ruff LE, et al. CD4+ T cell depletion during all stages of HIV disease occurs predominantly in the gastrointestinal tract. J Exp Med. 2004;200:749–59. doi: 10.1084/jem.20040874. [DOI] [PMC free article] [PubMed] [Google Scholar]
- 36.Guadalupe M, Reay E, Sankaran S, et al. Severe CD4+ T-cell depletion in gut lymphoid tissue during primary human immunodeficiency virus type 1 infection and substantial delay in restoration following highly active antiretroviral therapy. J Virol. 2003;77:11708–17. doi: 10.1128/JVI.77.21.11708-11717.2003. [DOI] [PMC free article] [PubMed] [Google Scholar]
- 37.Balagopal A, Philp FH, Astemborski J, et al. Human immunodeficiency virus-related microbial translocation and progression of hepatitis C. Gastroenterology. 2008;135:226–33. doi: 10.1053/j.gastro.2008.03.022. [DOI] [PMC free article] [PubMed] [Google Scholar]