Abstract
Three species of Nepenthes pitcher plants (Nepenthes rajah, Nepenthes lowii and Nepenthes macrophylla) specialize in harvesting nutrients from tree shrew excreta in their pitchers. In all three species, nectaries on the underside of the pitcher lid are the focus of the tree shrews' attention. Tree shrews are dichromats, with visual sensitivity in the blue and green wavebands. All three Nepenthes species were shown to produce visual signals, in which the underside of the pitcher lid (the area of highest nectar production) stood out in high contrast to the adjacent area on the pitcher (i.e., was brighter), in the blue and green wavebands visible to the tree shrews. N. rajah showed the tightest degree of “tuning,” notably in the green waveband. Conversely, pitchers of Nepenthes burbidgeae, a typical insectivorous species sympatric with N. rajah, did not produce a color pattern tuned to tree shrew sensitivity maxima.
Keywords: mutualism, Nepenthes, pitcher plants, tree shrews, Tupaia, visual signaling
Many plant species use visual signals to attract animals for purposes such as pollination and seed dispersal.1-3 For example, to maximize the probability of pollen transfer from anther to stigma, insect-pollinated flowers utilize sensory cues and morphological structures tailored to the physiology and behavior of the target species.4,5 The traps of carnivorous plants have evolved in response to a similar evolutionary pressure to that which shaped the flowers of animal- pollinated plants: the necessity to attract and retain the target animal at the site of maximum benefit to the plant. For example, in pitchers of Nepenthes rafflesiana Jack, the peristome (the collar-like structure surrounding the pitcher mouth, and the site of highest nectar production) stands out in high visual contrast to the pitcher body proper, in the UV, blue and green wavebands. These correspond to the visual sensitivity maxima of many of the targeted insect prey taxa.6,7 However, not all Nepenthes deploy strictly carnivorous pitchers: recent studies have demonstrated that those of four Bornean species, Nepenthes rafflesiana var elongata (recently renamed Nepenthes baramensis C. Clarke, J.A. Moran and Chi C. Lee8), Nepenthes rajah Hook. f., Nepenthes macrophylla (Marabini) Jebb and Cheek and Nepenthes lowii Hook. f., collect mammal excreta.9-12 The latter three species attract mountain tree shrews (Tupaia montana); in return for the nectar provided by the pitchers, the animals deposit excreta, from which the plants derive nitrogen.9,10 In these three species, the lid, rather than the peristome, is the site of greatest nectar production, and is therefore the “target” to which the tree shrews are required to orient themselves. This ensures that their hindquarters are positioned over the pitcher mouth, allowing capture of any excreta.9,10 Here, the hypothesis was tested that pitchers of these species produce color signals that are tuned to the visual sensitivity maxima of their diurnal partner. Tree shrews are dichromats- they have two types of cone cell in the retina, which are sensitive to blue light (S cones) and green light (L cones).13,14
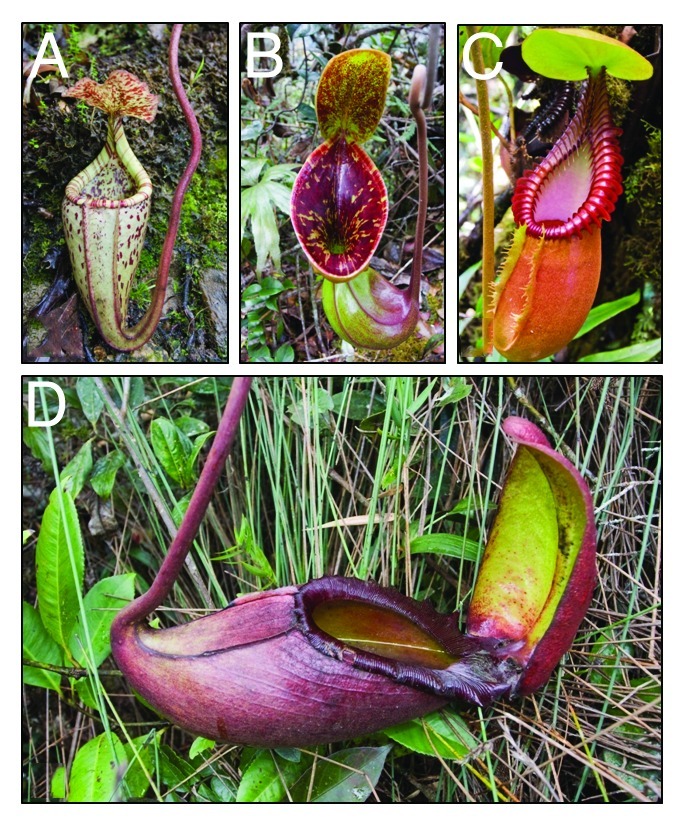
Specifically, the degree of color contrast between the area of greatest nectar production (the lid) and the closest adjacent area of the pitcher proper (i.e., the “background”), was quantified. In N. rajah and N. macrophylla, this was the peristome; in N. lowii, the peristome is vestigial,9 so the flared inner wall of the pitcher was scanned instead (Fig. 1). For comparison, pitchers of Nepenthes burbidgeae Hook. f. ex. Burb. were analyzed. This species is sympatric with N. rajah, but does not attract tree shrews, catching invertebrates in typical Nepenthes fashion (JM, pers. obs. Figure 1A). Thus, it was predicted that N. burbidgeae would not produce a color contrast signal tuned to tree shrew visual sensitivity maxima.

Figure 1. Pitchers of species used in the study. A Nepenthes burbidgeae. B Nepenthes lowii. C Nepenthes macrophylla. D Nepenthes rajah.
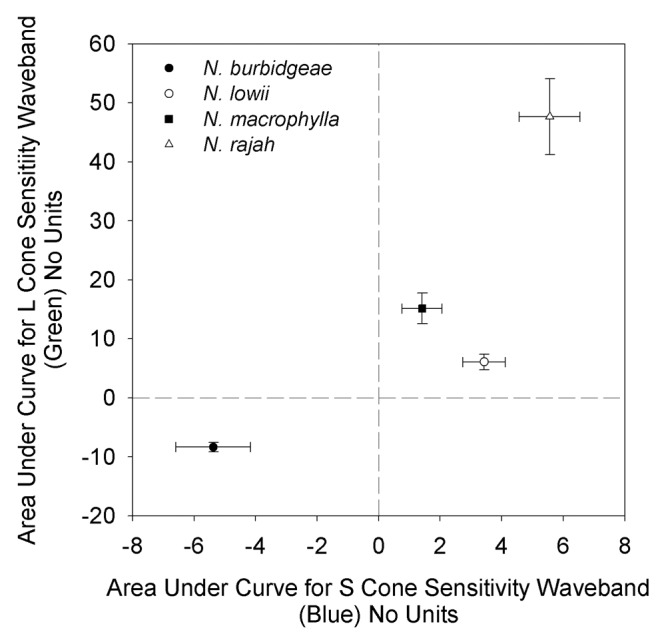
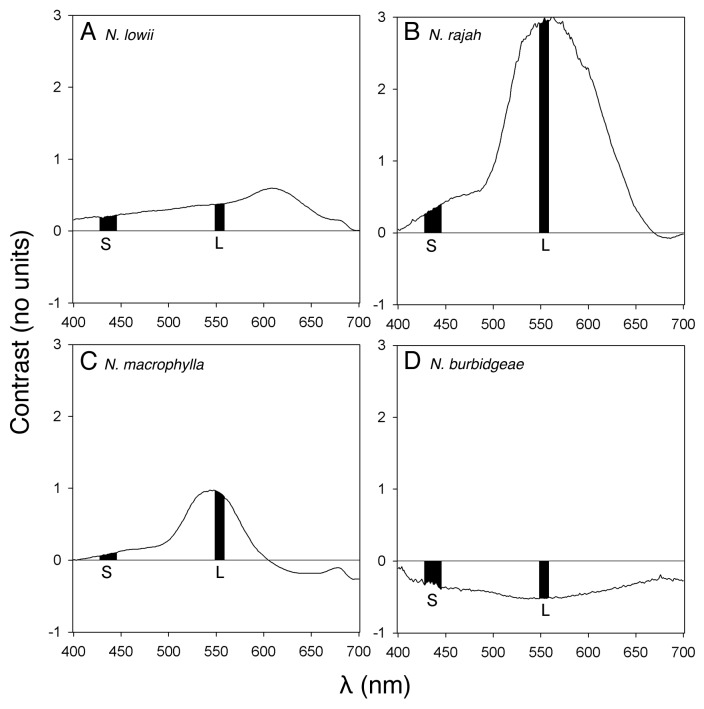
In all three of the tree shrew- attracting species, the pitcher lid was found to be brighter in the blue and green wavebands than the adjacent area of peristome (inner wall of the pitcher body for N. lowii), i.e., contrast values relative to background were positive (Figs. Two and 3). This was not the case for the typical, insectivorous N. burbidgeae, in which the lid was darker than the peristome in both wavebands (i.e., negative contrast values; Figures 2 and 3). Thus, in three tree shrew-specialized species, the lid, the site of the highest nectar production, was brighter than the adjacent background in the wavebands corresponding to the sensitivity maxima of the two types of cone present in the retina of the target animal.13,14 However, within this group, there were differences. N. rajah showed a contrast peak (ca. 560 nm), which corresponded almost exactly with the sensitivity region of the L cones in the tree shrew retina; N. macrophylla showed a similar pattern, although the contrast peak occurred at a slightly lower wavelength (ca. 535 nm) than the L cone sensitivity maxima. N. lowii showed the least tight “fit” between contrast peak and L cone sensitivity, with the former occurring at a longer wavelength (ca. 610 nm). For the waveband corresponding to the S cones, all three species showed positive contrast values, although to a lesser degree than for the L cone waveband, i.e., the contrast signal was more highly tuned to the latter, in all three species. In terms of overall “tuning” of the visual signal to the visual sensitivity of tree shrews, the tightest tuning was exhibited by N. rajah, while N. macrophylla and N. lowii showed less tight tuning, and the insectivorous N. burbidgeae exhibited none at all (Fig. 3).
Figure 2. Color contrast patterns (no units) across the waveband 400–700 nm, between pitcher lid and peristome (pitcher lid and flared inner section of pitcher body for Nepenthes lowii). (A) Nepenthes lowii (n = 33). (B) Nepenthes rajah (n = 31). (C) Nepenthes macropylla (n = 28). (D) Nepenthes burbidgeae (n = 10). The black bars denote the visual sensitivity regions of the S and L cones (sensitive to blue and green light, respectively) of tree shrew retinas.

Figure 3. Area under curve (AUC; no units) for color contrast between pitcher lid and peristome (pitcher lid and flared inner section of pitcher body for Nepenthes lowii) in wavebands corresponding to visual sensitivity regions of tree shrew S cones (sensitive to blue light; x axis) and L cones (sensitive to green light; y axis). Closed circle, Nepenthes burbidgeae (n = 10); open circle, Nepenthes lowii (n = 33); closed square, Nepenthes macrophylla (n = 28); open triangle, Nepenthes rajah (n = 31). Points represent mean values, bars represent 1 SE. Species sharing the same lower case italicized letter are not statistically different (p > 0.05, Dunn's test) with respect to L cones (above vertical bars), or S cones (to right of horizontal bars), respectively.
It is important to note that tree shrews are not the only mammalian visitors to one of the study species: summit rats (Rattus baluensis) have been shown to feed at, and defecate in, pitchers of N. rajah.11,18 Further, it has been demonstrated that N. rajah pitchers produce volatiles that attract small mammals.11 The possible role of volatiles in attraction of tree shrews to N. lowii and N. macrophylla pitchers awaits further investigation.
Materials and Methods
Fieldwork was undertaken in Sabah, Borneo in February 2011 at the Mesilau landslip, Mount Kinabalu (06° 03′ N, 116° 36′ E, 2050 min asl; N. rajah (n = 31 plants) and N. burbidgeae (n = 10)), and Mount Trus Madi (05° 33′ N, 116° 31′ E, 2500 min asl; N. macrophylla (n = 28) and N. lowii (n = 33)). One mature, fully-opened pitcher was selected per plant. A reflectance scan, ca. 0.3 cm2 in area, was then taken of the underside of the lid, and an adjacent area of peristome (N. rajah, N. macrophylla and N. burbidgeae) or the flared inner wall at the upper part of the pitcher (N. lowii). Scans were taken under natural light at 1-nm intervals from 400 to 700 nm using a spectroradiometer (USB4000, Ocean Optics Inc., Dunedin, FL) and fiber optic probe (BIF200-UV/VIS, Ocean Optics). A second scan was then taken of a Spectralon® white standard (WS-1, Ocean Optics). The dark signal was subtracted from each reflectance measurement, after which the reflectance values were divided by the white standard values to provide a normalized reflectance index. Color contrast (C) between lid and peristome (inner wall for N. lowii) was calculated at 1-nm intervals across the scanned waveband as follows:
| C = (Il - Ip) / Ip |
where Il and Ip are the reflected radiant flux values (W m−2 nm−1) for lid and peristome (inner wall for N. lowii), respectively, at a given wavelength.15 Tree shrew retinas contain two types of cone cell. The S cones (“Short waveband”) are sensitive to blue light (428 to 445 nm), whereas the L cones (“Long waveband”) are sensitive to green light (549 to 558 nm).13,14 No data exist for visual sensitivity in T. montana; available data from a congener, Tupaia belangeri, were used as a proxy. Area under curve (AUC) was calculated for each contrast curve in the wavebands corresponding to the sensitivity regions of tree shrew S and L cones, using the trapezoidal rule.16 The sensitivity waveband of the S cones is 18 nm in width (428–445), whereas that of the L cones is 10 nm (549–558). Therefore, to allow meaningful comparison between the two, a correction factor of 1.8 was applied to all AUC values for the latter. Data were analyzed using SigmaPlot v.12 (Systat Software Inc., San Jose, CA). AUC data were tested for homoscedasticity and normality using Levene's and Kolmogorov-Smirnov/Lilliefors tests, respectively. As transformation failed to make the data meet the assumptions of a parametric test, the nonparametric Kruskal-Wallis test was used in lieu of one-way ANOVA.17 This was followed by all-pairwise comparisons using Dunn's test.
Disclosure of Potential Conflicts of Interest
No potential conflicts of interest were disclosed.
Acknowledgments
We thank Sabah Parks for permission to carry out the work, Ansou Gunsalam for facilitating the research at Mesilau, and two anonymous reviewers for helping to improve the manuscript.
Footnotes
Previously published online: www.landesbioscience.com/journals/psb/article/21661
References
- 1.Schaefer HM, Schaefer V, Levey DJ. How plant-animal interactions signal new insights in communication. Trends Ecol Evol. 2004;19:577–84. doi: 10.1016/j.tree.2004.08.003. [DOI] [Google Scholar]
- 2.Schaefer HM, Levey DJ, Schaefer V, Avery ML. The role of chromatic and achromatic signals for fruit detection by birds. Behav Ecol. 2006;17:784–9. doi: 10.1093/beheco/arl011. [DOI] [Google Scholar]
- 3.Kudo G, Ishii HS, Hirabayashi Y, Ida TY. A test of the effect of floral color change on pollination effectiveness using artificial inflorescences visited by bumblebees. Oecologia. 2007;154:119–28. doi: 10.1007/s00442-007-0820-1. [DOI] [PubMed] [Google Scholar]
- 4.Corlett RT. Flower visitors and pollination in the Oriental (Indomalayan) Region. Biol Rev Camb Philos Soc. 2004;79:497–532. doi: 10.1017/S1464793103006341. [DOI] [PubMed] [Google Scholar]
- 5.Bronstein JL, Alarcón R, Geber M. The evolution of plant-insect mutualisms. New Phytol. 2006;172:412–28. doi: 10.1111/j.1469-8137.2006.01864.x. [DOI] [PubMed] [Google Scholar]
- 6.Moran JA. Pitcher dimorphism, prey composition and the mechanism of prey attraction in the pitcher plant Nepenthes rafflesiana in Borneo. J Ecol. 1996;84:515–25. doi: 10.2307/2261474. [DOI] [Google Scholar]
- 7.Moran JA, Booth WE, Charles JK. Aspects of pitcher morphology and spectral characteristics of six Bornean Nepenthes pitcher plant species: implications for prey capture. Ann Bot (Lond) 1999;83:521–8. doi: 10.1006/anbo.1999.0857. [DOI] [Google Scholar]
- 8.Clarke C, Moran JA, Lee CC. Nepenthes baramensis (Nepenthaceae) - a new species from north-western Borneo. Blumea. 2011;56:229–33. doi: 10.3767/000651911X607121. [DOI] [Google Scholar]
- 9.Clarke CM, Bauer U, Lee CC, Tuen AA, Rembold K, Moran JA. Tree shrew lavatories: a novel nitrogen sequestration strategy in a tropical pitcher plant. Biol Lett. 2009;5:632–5. doi: 10.1098/rsbl.2009.0311. [DOI] [PMC free article] [PubMed] [Google Scholar]
- 10.Chin L, Moran JA, Clarke C. Trap geometry in three giant montane pitcher plant species from Borneo is a function of tree shrew body size. New Phytol. 2010;186:461–70. doi: 10.1111/j.1469-8137.2009.03166.x. [DOI] [PubMed] [Google Scholar]
- 11.Wells K, Lakim MB, Schulz S, Ayasse M. Pitchers of Nepenthes rajah collect faecal droppings from both diurnal and nocturnal small mammals and emit fruity odour. J Trop Ecol. 2011;27:347–53. doi: 10.1017/S0266467411000162. [DOI] [Google Scholar]
- 12.Grafe TU, Schöner CR, Kerth G, Junaidi A, Schöner MG. A novel resource-service mutualism between bats and pitcher plants. Biol Lett. 2011;7:436–9. doi: 10.1098/rsbl.2010.1141. [DOI] [PMC free article] [PubMed] [Google Scholar]
- 13.Jacobs GH, Neitz J. Spectral mechanisms and color vision in the tree shrew (Tupaia belangeri) Vision Res. 1986;26:291–8. doi: 10.1016/0042-6989(86)90026-X. [DOI] [PubMed] [Google Scholar]
- 14.Petry HM, Hárosi FI. Visual pigments of the tree shrew (Tupaia belangeri) and greater galago (Galago crassicaudatus): a microspectrophotometric investigation. Vision Res. 1990;30:839–51. doi: 10.1016/0042-6989(90)90053-N. [DOI] [PubMed] [Google Scholar]
- 15.Dusenbery DB. Sensory ecology. New York: WH Freeman and Co. 1992. [Google Scholar]
- 16.Weideman JAC. Numerical integration of periodic functions: a few examples. Am Math Mon. 2002;109:21–36. doi: 10.2307/2695765. [DOI] [Google Scholar]
- 17.Sokal RR, Rohlf FJ. Biometry. 2nd edn. New York: WH Freeman and Co. 1981. [Google Scholar]
- 18.Greenwood M, Clarke C, Lee CC, Gunsalam A, Clarke RH. A unique resource mutualism between the giant Bornean pitcher plant, Nepenthes rajah, and members of a small mammal community. PLoS One. 2011;6:e21114. doi: 10.1371/journal.pone.0021114. [DOI] [PMC free article] [PubMed] [Google Scholar]


