Abstract
Background
In the Women’s Health Initiative Hormone Trials (WHI-HT), breast cancer risk was increased with estrogen plus progestin (E+P) but not with unopposed estrogen (E-alone). We hypothesized that E+P would preferentially metabolize to 16α-hydroxyestrone (16α-OHE1) rather than 2-hydroxyestrone (2-OHE1), and that breast cancer risk would be associated with baseline and 1 year changes in estrogen metabolites: positively for 16α-OHE1 levels and negatively for levels of 2-OHE-1 and the 2:16 ratio.
Methods
In a prospective case-control study nested in the WHI-HT, 845 confirmed breast cancer cases were matched to 1690 controls by age and ethnicity. Using stored serum, 2-OHE1 and 16α-OHE1 levels were measured by EIA at baseline, and for those randomized to active treatment (n=1259), at 1 year.
Results
The 1 year increase in 16α-OHE1 was greater with E+P than E-alone (median 55.5 vs. 43.5 pg/ml, p<0.001), but both increased 2-OHE1 by ~300 pg/ml. Breast cancer risk was modestly associated with higher baseline levels of 2-OHE1 and the 2:16 ratio, and. for estrogen receptor+/progesterone+ cases only, higher baseline 16α-OHE1 levels. For those randomized to active treatment, breast cancer risk was associated with greater increase in 2-OHE-1 and the 2:16 ratio, but associations were not significant.
Conclusions
Although E+P modestly increased 16α-OHE1 more than E-alone, increase in 16α-OHE1 was not associated with breast cancer.
Impact
Study results do not explain differences between the WHI E+P and WHI E-alone breast cancer results but metabolism of oral HT which may explain smaller than expected increase in breast cancer compared with endogenous estrogens.
Keywords: Breast cancer, estrogen metabolism, hormone therapy, postmenopausal
Introduction
Endogenous estrogen levels are positively associated with postmenopausal breast cancer for non-hormone users. (1;2) In the WHI randomized placebo-controlled clinical trials combined estrogen+progestin (E+P) was associated with increased breast cancer risk (relative risk (RR) of 1.26 (1.00-1.59)), (3;4) but unopposed estrogen (E-alone) was not (RR= 0.77 (0.59-1.01). (5) Breast cancer risk increases less with E+P postmenopausal hormone therapy (HT) than expected based on the increase in circulating estrogens. (6) Furthermore, a recent case-cohort study in the WHI-HT trial showed that 1-year increases in estrogens and sex hormone binding globulin (SHBG) were similar for E+P compared with E-alone, and that progesterone decreased slightly with E+P. (6) However, with both E+P and E-alone, bioavailable and free estradiol increased less than total estradiol, related to the 2.5-fold increase in SHBG with either HT regimen. (6) A case-cohort study of non-hormone users in the WHI Observational Study (WHI-OS) recently reported that median levels of bioavailable estradiol were significantly higher in invasive breast cancer cases than cohort controls, especially for estrogen receptor (ER)+ breast cancer, (adjusted HR 1.86(1.00,3.45), quartiles 4 versus 1.) (7) Therefore, the difference in the risk of breast cancer between E-alone (decreased risk) and in E+P (increased risk) in the WHI-HT do not appear to be explained by similar changes in hormone levels for E+P compared with E-alone.(6)
Therefore, we hypothesized that differences in estrogen metabolism might explain differences in breast cancer risk for E+P and E-alone. Estrogens (both estradiol and estrone) metabolize along several competing pathways including of 2-hydroxy estrone (2-OHE1), 16α- hydroxy estrone (16α-OHE1), and 4-hydroxy estrone (4-OHE1) that may vary in estrogenic and genotoxic potential. (8-10) Most studies of estrogen metabolites and breast cancer have focused on 2-OHE1, 16α-OHE1 and their ratio (2:16). 16α-OHE1 has strong estrogenic effects related to cell proliferation, and has a higher binding affinity for the estrogen receptor than 2- OHE1, which has limited proliferation effects and possibly even anti-estrogenic effects. (8;9;11) Several studies have reported that breast cancer risk was associated with higher levels of 16α- OHE1(12-16), and lower levels of the 2:16 ratio. (16-21) Other studies have found no associations, or a positive association of 2-OHE-1 or the 2:16 ratio with breast cancer risk.(22-25) Most studies have excluded hormone users. In a previous case-cohort study nested in the WHI Observational Study, HT users had substantially higher levels of levels of 2-OHE1 and higher levels of 16α-OHE1 than non-users, and combined E+P users had slightly higher 16α- OHE1 levels than E-alone users. (26) However, no prospective studies have assessed the effect of HT regimen on changes in estrogen metabolism and subsequent breast cancer risk within a randomized clinical trial of HT.
Therefore, we conducted a prospective case control study of 2,535 postmenopausal women nested within the randomized WHI-HTs to test three hypotheses: 1) incident breast cancer is associated with higher baseline levels of 16α-OHE1 and lower levels of the 2:16 ratio, 2) compared to E-alone, E+P is associated with a greater increase in 16α-OHE1 levels, and a smaller increase in levels of 2-OHE1 and the 2:16 ratio 1 year after randomization, and 3) for women randomized to active HT, incident breast cancer is associated with a larger 1 year increase in 16α-OHE1 levels, and a smaller 1 year increase in the 2:16 ratio. Finally, we hypothesized that associations are stronger for cases that are positive for estrogen receptor (ER+) and progesterone receptor (PR+).
Methods
Overview of the WHI Hormone Trials (WHI-HT)
Between 1993 and 1998, the WHI recruited 27,347 postmenopausal women aged 50 to 79 at 40 centers in the United States into 2 randomized clinical trials: E+P and E-alone. Details of the methods and results of these trials have been published. (27;28) Briefly, the E+P trial randomized 16,608 postmenopausal women to conjugated equine estrogen (CEE) (0.625 mg per day) plus medroxy-progesterone acetate (MPA) (2.5 mg/day) or placebo. The E-alone trial randomized 10,738 women with a prior hysterectomy to CEE (0.625 mg/day) or placebo. Women using hormones at the screening visit underwent a 3 month washout period prior to study randomization. The protocol and consent forms were approved by the institutional review boards of the participating institutions, and all women provided written informed consent. Follow-up contacts by telephone or clinic visit occurred every 6 months with clinic visits required annually. Covariates were collected via questionnaires or examinations and included age, ethnicity, BMI, waist circumference, reproductive history, alcohol intake, smoking status, physical activity, prior HT use, family history of breast cancer, and oophorectomy status. BMI and waist circumference were measured at clinic visits.
Outcomes
Baseline and annual mammograms were required for women in the WHI-HT to identify potential breast cancer cases. Details of breast cancer endpoints were abstracted and confirmed by review of medical records and pathology reports (available on 98.2% of participants) by physician adjudicators at local clinics masked to treatment assignments. Estrogen receptor/progesterone receptor (ER/PR) tumor status was obtained by pathology reports. Only ER+, PR+ and ER-, PR- status was specifically evaluated because of limited sample size in other groups.
Study Design and Participants
The current study selected breast cancer cases and controls from both the E+P and E- alone WHI-HT, to compare changes in metabolites and their associations with subsequent breast cancer risk according to HT regimen (E+P trial vs. E-alone trial). Estrogen metabolites were measured on breast cancer cases and controls at baseline, and for participants randomized to active treatment, metabolites were also measured at 1 year post-randomization. Cases (N=845) include all women diagnosed with breast cancer after study enrollment through August 2006 who met the following study eligibility criteria: diagnosis of breast cancer during WHI follow-up, breast cancer diagnosis that occurred at least 5 years after menopause, no diagnosis of other cancers during follow-up, no use of medications that could affect estrogen levels (i.e. anti-mycobacterial, imidazole-related anti-fungals, androgen-anabolic steroids, adrenal steroid inhibitors, hormone receptor modulators, histamine H2 receptor antagonists, cyclosporine analogs, and herbal estrogens), self-reported race or ethnicity other than “unknown,” and adequate serum available at baseline and year 1. To preserve the temporal relationship between exposure and incident breast cancer, the study design called for the exclusion of breast cancer cases with diagnosis ≤ 1 year post-randomization (n=48 at baseline, reducing the total number of cases to n=797 with baseline estrogen metabolites (n=627 invasive).
Potential controls were selected from participants who were free of breast cancer diagnosis through August 2006 and met the following criteria: postmenopausal for at least 5 years, no use of medications that could affect estrogen levels, self-reported race or ethnicity other than “unknown,” and with adequate serum available. For each case, 2 controls (N=1,690) were selected, frequency-matched for age and ethnicity. Approximately half of the controls were selected from existing WHI case-control studies of breast cancer and hip fracture that include measurements of both baseline and 1 year follow up sex steroid hormone levels, with the remainder (n=827) selected from the remaining risk set as of August, 2006. Among women randomized to active treatment (n=1259), 21 breast cancer cases were excluded for occurring ≤1 year follow-up, and 24 participants did not have 1 year samples available. Therefore 1 year change in estrogen metabolites were available on n =1214, including n=401 breast cancer cases.
Laboratory analyses
At baseline and 1 year post-randomization blood was drawn after a minimum 10 hours of fasting. Serum and plasma samples were shipped to a central repository and stored at −70°C and not previously thawed. (29) For the current study, stored serum from baseline (all participants) and 1 year (participants randomized to active HT) was shipped on dry ice to Immuna Care, Inc., (Tampa, FL) for measurement of estrogen metabolites under the direction of Dr. Thomas Klug. Using serum (150 μl per assay) 16α-OHE1 and 2-OHE1 were measured by immunoassay (ESTRAMET 2/16 kits, Immuna Care). The limits of detection are ~10 pg/ml for the 16αOHE1 assay and ~20 pg/ml for the 2-OHE1 assay. Postmenopausal women screened for WHI provided 210 additional samples that were split into duplicates for quality control (QC) testing. Vials were coded to provide no participant information to study investigators or laboratory staff. Cases, controls, intervention groups and QC samples were randomly distributed throughout each batch of specimens, and to minimize potential differences between cases and controls that might arise from batching on a plate, each plate batch contained a ratio of one breast cancer case to two controls (masked). Coefficients of variation (CV) and intraclass correlation coefficients (ICC) were calculated using the 210 pairs of split QC samples.
Statistical analysis
The characteristics of study participants according to HT arm and case/control status were compared using T-tests and Wilcoxon tests for normally and non-normally distributed continuous variables, respectively, and Chi-square and Fisher’s exact tests for categorical variables. (Table 1) Associations between the estrogen metabolites and breast cancer risk were assessed using conditional logistic regression models to account for the primary matching variables (age, ethnicity). Quartiles were defined based on the controls’ estrogen metabolite levels. For continuous models, metabolite values were log-transformed, and 1 year changes in metabolites were increased by a constant to create all positive values and then log transformed. Differences in by trial and active vs. placebo assignment were tested by including an interaction term in the logistic regression models. Sensitivity analyses included adjusting for BMI and treatment assignment, and for baseline levels in models assessing change in metabolites, and also stratifying by ER+/PR+ status, and restricting to invasive cancer only (n=697). All p-values are two sided. SAS 9.2 (SAS Institute) was used for analyses.
Table 1.
Baseline demographics of study participants by WHI Hormone Trials
| E-alone Trial | E+P Trial | |||||
|---|---|---|---|---|---|---|
| Variable | Breast Cancer n=269 |
Control n=639 |
p | Breast Cancer n=528 |
Control n=1051 |
p |
| Oophorectomy status - a part, one, or both ovaries removed, N, % |
145, 54.31 |
375, 58.6 | 0.06c | 21, 4.0 | 41, 3.6 | 0.73d |
| Age, years | 63.9 (0.43) |
65.3 (0.29) |
0.01 a |
64.1 (0.29) |
64.6 (0.22) |
0.16a |
| BMI, kg/m2 | 31.3 (0.37) |
29.2 (0.22) |
<0.0 001a |
29.3 (0.25) |
28.4 (0.18) |
0.001a |
| Waist circumference, cm | 95.1 (0.93) |
90.2 (0.51) |
<0.0 001a |
90.3 (0.57) |
87.8 (0.41) |
0.0005a |
| Family History breast cancer, N, % |
64, 46.7 | 101, 37.8 | 0.09c | 110, 45.3 | 167, 36.0 | 0.02c |
| Active treatment assignment, N, % |
115, 42.8 | 323, 50.6 | 0.03c | 310, 58.7 | 490, 46.6 | <.0001c |
| Age at first birth, N, % | ||||||
| No births | 8,3.7 | 11,2.0 | 14,3.3 | 33,3.8 | ||
| <20 years old | 59,27.4 | 128,23.8 | 14,3.3 | 33,3.8 | ||
| 20-<30 years old | 139,64.7 | 321,67.1 | 286,68.3 | 640,72.9 | ||
| 30 or more years old | 9, 4.2 | 38, 7.1 | 0.19c | 53, 12.7 | 85, 9.7 | 0.24c |
| Ethnicity, N, % | ||||||
| Amer. Indian/Alaskan | 2, 0.7 | 3, 0.5 | 1, 0.2 | 2, 0.2 | ||
| Native | ||||||
| Asian/Pacific Islander | 5, 1.9 | 10, 1.6 | 17, 3.2 | 23, 2.2 | ||
| Black/African American | 39, 14.5 | 77,12.1 | 38, 7.2 | 23, 2.2 | ||
| Hispanic/Latino | 10, 3.7 | 23,3.6 | 15, 2.8 | 26, 2.5 | ||
| White | 213, 79.2 | 525, 82.2 | 0.85 d |
457, 86.6 | 940, 89.4 | |
| Other | 0, 0 | 1, 0.2 | 0, 0 | 0, 0 | 0.45d | |
| Alcohol intake, N, % | ||||||
| Non-drinker | 46, 17.4 | 81, 12.8 | 56, 10.8 | 112, 10.8 | ||
| Past-drinker | 63, 23.9 | 132, 20.8 | 91, 17.5 | 168, 16.2 | ||
| <1 drink/month | 33, 12.5 | 98, 15.5 | 72, 13.9 | 164, 15.8 | ||
| <1 drink/week | ||||||
| 1-6 drinks/ week | 46, 17.4 | 122, 19.2 | 128, 24.7 | 297, 28.6 | ||
| 7 or more drinks/ week | 29, 11.0 | 50, 7.9 | 0.07c | 69, 13.3 | 107, 10.3 | 0.28c |
| Current smoker, N, % | 20, 7.5 | 55, 8.7 | 0.79c | 44, 8.5 | 93, 8.9 | 0.04c |
| Parity, children, N, % | ||||||
| Never pregnant | 21, 7.8 | 52, 8.2 | 44, 8.4 | 75, 7.2 | ||
| Never had term | 8, 3.0 | 11, 1.7 | 14, 2.7 | 33, 3.2 | ||
| Pregnancy | ||||||
| 1 | 16, 6.0 | 39, 6.2 | 48, 9.2 | 68, 6.5 | ||
| 2 | 51, 19.0 | 114, 18.0 | 115, 22.0 | 210, 20.1 | ||
| 3 | 62, 23.1 | 143, 22.6 | 131, 25.1 | 252, 24.1 | ||
| 4 | 59, 22.0 | 123, 19.4 | 95, 18.2 | 203, 19.4 | ||
| 5 or more | 51, 19.0 | 152, 24.0 | 0.64c | 76, 14.5 | 206, 19.7 | 0.10c |
| Recreational physical activity, minutes/week (SEM) |
132.9 (9.6) |
160.3 (7.30) |
0.07 b |
154.6 (7.56) |
171.6 (5.56) |
0.08b |
| Prior E+P use, years (SEM) | 2.7 (0.69) | 5.2 (1.06) | 0.57 b |
4.3 (0.55) | 3.9 (0.35) | 0.70b |
| Previous hormone use at baseline, N, % |
||||||
| Never used | 144, 53.5 | 331, 519 | 401, 76.0 | 782, 74.4 | ||
| <5 years ago | 24, 8.9 | 73, 11.4 | 38, 7.2 | 72, 6.9 | ||
| 5-<10 years ago | 17,6.3 | 29, 4.6 | 324, 4.6 | 41, 3.9 | ||
| 10 or more years ago | 49, 18.2 | 125, 19.6 | 41, 7.8 | 94, 8.9 | ||
| Current-user | 35, 13.0 | 80, 12.5 | 0.62c | 24, 4.6 | 62, 5.9 | 0.68c |
t-test
Wilcoxon test
Chi-square test
Fisher’s exact test
SEM=standard error of the mean P-values reflect comparisons between cases and controls within each HT trial arm.
Results
The overall CVs for 2-OHE1,16α-OHE1,and the 2:16 ratio were 26.4%, 15.2%, and 28.0% respectively, with intra-class correlations (ICCs) of 0.94, 0.86 and 0.90, respectively. Spearman correlations between 2-OHE-1 and 16αOHE-1 were ρ=0.18, p<0.0001 at baseline, not on HT, and ρ=0.24, p<0.0001 at 1 year for women randomized to HT.
Table 1 presents baseline characteristics of the study population, stratified by E+P versus E-alone trials and breast cancer case-control status. Study participants from the E-alone arm differed from those from the E+P arm, (e.g., ~60% of study participants had partial or total oophorectomy in addition to their eligibility-requirement of hysterectomy, compared with ~4% in the E+P arm). Women in the E-alone arm were also more likely to be non-white. These characteristics are similar to the overall sample of women in the HT clinical trials. For both trials, breast cancer cases were heavier, had larger waist circumference, and were more likely to have a family history of breast cancer than controls (p<0.05). Mean (SD) time to breast cancer was 4.6 (2.4) years, with similar overall follow-up time for cases (9.1(1.6)) and controls (9.0(1.5)) years, respectively.
Relationship of baseline estrogen metabolite levels to incident breast cancer
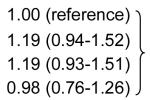
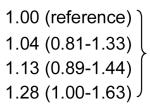
The median levels of serum 16α-OHE1, 2-OHE1 and the 2:16 ratio at baseline were not significantly different between women who developed breast cancer during follow-up compared with controls in both E-alone and E+P arms. (Table 2) In logistic models that accounted for age and ethnicity-matching, breast cancer risk was significantly higher for quartile 4 versus 1 of baseline levels of both 2-OHE1 and the 2:16 ratio, but not associated with baseline levels of 16α-OHE1. (Table 3) Higher baseline levels of 2-OHE1 and the 2:16 ratio (but not 16α-OHE1) were associated with breast cancer risk in models with the estrogen metabolites as continuous variables. These associations persisted after further adjustment for BMI, and for treatment assignment. The association of higher baseline 16αOHE-1 with increased odds of breast cancer was slightly stronger 1) if restricted to invasive cancer only, or 2) for women randomized to active treatment in the E-alone trial, but associations and interactions by treatment assignment, were not statistically significant (data not shown).
Table 2.
Median baseline levels of 16α-OHE1, 2-OHE1, and the 2:16 ratio by treatment assignment and breast cancer case/control status among study participants from the WHI Hormone Trials
| E-alone | E-alone Placebo | E+P | E+P Placebo | |||||
|---|---|---|---|---|---|---|---|---|
| N cases/ controls |
115/323 | 154/316 | 310/490 | 218/561 | ||||
| 16α-OHE1 (pg/ml) | ||||||||
| Median | p | Median | p | Median | p | Median | p | |
| Cases | 349.8 | 0.71 | 345.3 | 0.62 | 338.5 | 0.96 | 345.5 | 0.38 |
| Controls | 353.5 | 351.4 | 335.8 | 339.8 | ||||
|
| ||||||||
| 2-OHE1 (pg/ml) | ||||||||
| Median | p | Median | p | Median | p | Median | p | |
| Cases | 99.0 | 0.22 | 104.3 | 0.52 | 102.9 | 0.48 | 106.0 | 0.26 |
| Controls | 93.5 | 102.5 | 99.8 | 100.8 | ||||
|
| ||||||||
| 2:16 ratio | ||||||||
| Median | p | Median | p | Median | p | Median | p | |
| Cases | 0.30 | 0.38 | 0.32 | 0.28 | 0.31 | 0.51 | 0.31 | 0.77 |
| Controls | 0.29 | 0.30 | 0.31 | 0.30 | ||||
P value from Wilcoxon test
Table 3.
Association of baseline estrogen metabolite levels with breast cancer risk among study participants in the WHI Hormone Trials
| N Cases/Controls |
Median (IQR) | OR (95% CI) | p | |
|---|---|---|---|---|
| 16α-OHE1 (pg/ml) | ||||
| Quartile 1a | 177/423 | 239.0 (212.1, 257.3) |
|
0.21d |
| Quartile 2a | 219/420 | 309.5 (291.5, 327) | ||
| Quartile 3a | 217/425 | 377.5 (359, 397.5) | ||
| Quartile 4a | 184/422 | 489.5 (450, 564.5) | ||
| Continuousa | 0.96 (0.73-1.25) | 0.76 | ||
| Continuousb | 0.89 (0.68-1.17) | 0.40 | ||
| Continuousc | 0.91 (0.70-1.20) | 0.52 | ||
|
| ||||
| 2-OHE1 (pg/ml) | ||||
| Quartile 1a | 179/428 | 60 (49.5, 69) |
|
0.11d |
| Quartile 2a | 194/420 | 88 (81.7, 93.5) | ||
| Quartile 3a | 195/419 | 116 (107.5, 124.5) | ||
| Quartile 4a | 229/423 | 173.3 (151.6, 227.8) | ||
| Continuousa | 1.23 (1.04-1.45) | 0.01 | ||
| Continuousb | 1.20 (1.02-1.42) | 0.03 | ||
| Continuousc | 1.18 (0.99-1.40) | 0.05 | ||
|
| ||||
| 2:16 ratio | ||||
| Quartile 1a | 184/422 | 0.17 (0.13, 0.19) |

|
0.20d |
| Quartile 2a | 186/421 | 0.26 (0.24, 0.28) | ||
| Quartile 3a | 203/422 | 0.35 (0.32, 0.38) | ||
| Quartile 4a | 220/420 | 0.53 (0.47, 0.68) | ||
| Continuousa | 1.21 (1.04-1.41) | 0.02 | ||
| Continuousb | 1.21 (1.04-1.42) | 0.02 | ||
| Continuousc | 1.19 (1.01-1.39) | 0.03 | ||
All models include matching factors: age ethnicity. Estrogen metabolite levels are logtransformed for continuous models.
Unadjusted
Adjusted for BMI
Adjusted for BMI and treatment arm
p-value for Wald Χ2 test for differences among quartiles
IQR=interquartile range
OR=odds ratio
CI=confidence interval
Baseline Estrogen metabolite-breast cancer risk stratified by ER+/PR+ vs. ER-PR- status
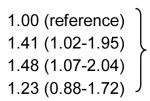
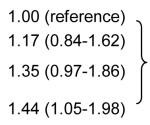
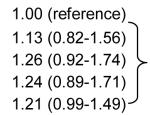
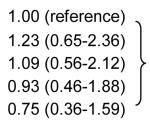
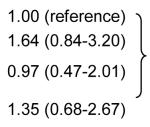
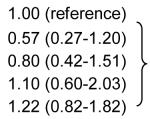
Associations between baseline estrogen metabolites and breast cancer risk were further evaluated after stratifying cases by ER and PR tumor status (ER+/PR+ vs. ER-/PR-)(Table 4). Associations were somewhat stronger for (ER+/PR+) cases and weaker for ER-/PR- cases. For ER+/PR+ cases, 16αOHE-1 was positively associated with breast cancer risk. Stratified by trial and treatment group, positive associations of 16αOHE-1 with breast cancer were stronger for women randomized to placebo in both trials, although interactions with treatment assignment were not statistically significant (data not shown). Among ER+/PR+ cases, higher baseline 2- OHE1 was also associated with increased breast cancer risk (p<.05) for the highest vs. lowest quartile, and also in continuous models adjusted for BMI and treatment assignment. Compared with the overall results, associations with the 2:16 ratio were slightly attenuated for ER+/PR+ cases and seemed absent for ER-/PR- cases. Overall results were similar when restricted to invasive cancer only, or when cases were stratified by median follow-up time (data not shown).
Table 4.
Association of baseline estrogen metabolite levels with breast cancer risk by ER/PR status among women in the WHI Hormone Trials
| Estrogen receptor (ER) Progesterone Receptor (PR) Status | |||||||||
|---|---|---|---|---|---|---|---|---|---|
| ER+/PR+ | ER-/PRN | ||||||||
| N case/ control |
Median (IQR) | OR (95% CI) | p | N Case/ Control |
Median (IQR) | OR (95% CI) | p | ||
| 16α-OHE1(pg/ml) | 16α-OHE1(pg/ml) | ||||||||
| Quartile 1a | 78/423 | 239.5 (212.3-257.5) |
|
0.09d | Quartile 1a | 18/423 | 238.8 (211.0, 257.0) |
|
0.86d |
| Quartile 2a | 109/420 | 309.5 (291.0-327.0) | Quartile 2a | 23/420 | 309.5 (291.0, 326.5) | ||||
| Quartile 3a | 115/425 | 378.0 (358.0-398.0) | Quartile 3a | 20/425 | 377.5 (359.0, 398.0) | ||||
| Quartile 4a | 97/422 | 492.0 (450.5-570.0) | Quartile 4a | 17/422 | 491.5 (450.5, 569.0) | ||||
| Continuousa | 1.23 (0.87-1.74) | 0.24 | Continuousa | 0.75 (0.36-1.59) | 0.46 | ||||
| Continuousb | 1.12 (0.79-1.59) | 0.53 | Continuousb | 0.75 (0.35-1.58) | 0.44 | ||||
| Continuousc | 1.17 (0.82-1.67) | 0.40 | Continuousc | 0.77 (0.36-1.64) | 0.50 | ||||
|
| |||||||||
| 2-OHE1(pg/ml) | 2-OHE1(pg/ml) | ||||||||
| Quartile 1a | 86/428 | 60.0 (49.0, 69.0) |
|
0.12d | Quartile 1a | 17/428 | 59.5 (48.5, 69.0) |
|
0.35d |
| Quartile 2a | 94/420 | 88.5 (82.0, 93.5) | Quartile 2a | 25/420 | 88.5 (82.0, 93.5) | ||||
| Quartile 3a | 105/419 | 116.0 (107.5, 125.0) |
Quartile 3a | 15/419 | 115.5 (107.3, 125.0) | ||||
| Quartile 4a | 114/423 | 174.5 (151.5, 227.0) |
Quartile 4a | 21/423 | 174.0 (153.0, 228.5) | ||||
| Continuousa | 1.35 (1.09-1.68) | 0.006 | Continuousa | 1.15 (0.75-1.76) | 0.54 | ||||
| Continuousb | 1.34 (1.08-1.66) | 0.008 | Continuousb | 1.12 (0.73-1.73) | 0.60 | ||||
|
| |||||||||
| Continuousc | 1.31 (1.05-1.63) | 0.02 | Continuousc | 1.13 (0.72-1.75) | 0.60 | ||||
| 2:16 ratio | 2:16 ratio | ||||||||
| Quartile 1a | 87/420 | 0.17 (0.13-0.19) |
|
0.48d | Quartile 1a | 24/420 | 0.17 (0.13-0.19) |
|
0.31d |
| Quartile 2a | 99/422 | 0.26 (0.24-0.28) | Quartile 2a | 11/422 | 0.26 (0.24-0.28) | ||||
| Quartile 3a | 107/422 | 0.35 (0.32-0.38) | Quartile 3a | 19/422 | 0.35 (0.33-0.38) | ||||
| Quartile 4a | 102/421 | 0.53 (0.47-0.67) | Quartile 4a | 24/421 | 0.53 (0.47-0.67) | ||||
| Continuousa | 1.21 (0.99-1.49) | 0.06 | Continuousa | 1.22 (0.82-1.82) | 0.33 | ||||
| Continuousb | 1.24 (1.01-1.53)e | 0.04 | Continuousb | 1.20 (0.81-1.79) | 0.37 | ||||
| Continuousc | 1.20 (0.98-1.49) | 0.08 | Continuousc | 1.20 (0.79-1.81) | 0.39 | ||||
All models account for age and ethnicity matching. Estrogen metabolite levels are log-transformed for continuous models.
Unadjusted
Adjusted for BMI
Adjusted for BMI and treatment arm
p-value for Wald Χ2 test for differences among quartiles
IQR=interquartile range
OR=odds ratio
CI=confidence interval
Change in estrogen metabolites following 1 year active HT treatment
Among those randomized to active hormone treatment (n=1259), estrogen metabolites were also measured in serum from the 1 year follow-up after starting HT. (Table 5) As hypothesized, the increase in 16α-OHE1 was greater with E+P vs. E-alone (median increase 58 vs. 44 pg/ml, p =0.0002). However, the increase in 16α-OHE1 was dwarfed by the approximately 4-fold increase in 2-OHE1 (median increase= ~ 300 pg/ml) that occurred with both E-alone and E+P. This is consistent with previous studies. Following 1 year of HT, levels of 2-OHE1 were similar to levels of 16α-OHE1, resulting in a 2:16 ratio = 1.0 for both treatment arms.
Table 5.
Median(IQR) baseline, 1-year, and 1-year change in 16α-OHE1, 2-OHE1, and the 2:16 ratio among study participants randomized to active treatment in the E-alone and E+P WHI Hormone Trials
| E-alone | E+P | pa | |
|---|---|---|---|
| N | 431 | 783 | |
| 16α-OHE1 (pg/ml) | |||
| Baseline | 352.0 (277.5, 434.5) | 337.5 (272.0, 412.0) | 0.045 |
| 1-year | 393.5 (322.5, 489.5) | 398.0 (327.5, 495.5) | 0.49 |
| Change | 43.8 (−4.5, 93.5) | 58.0 (12.0, 122.5) | 0.0002 |
|
| |||
| 2-OHE1 (pg/ml) | |||
| Baseline | 96.0 (74.5, 134.7) | 101.0 (77.0, 137.5) | 0.17 |
| 1-year | 390.5 (245.0, 537.5) | 410.8 (247.3, 573.0) | 0.14 |
| Change | 273.3 (142.0, 423.0) | 305.0 (151.5, 457.5) | 0.17 |
|
| |||
| 2:16 Ratio | |||
| Baseline | 0.30 (0.21, 0.40) | 0.31 (0.23, 0.43) | 0.02 |
| 1-year | 1.00 (0.60, 1.40) | 1.00 (0.57, 1.42) | 0.53 |
| Change | 0.66 (0.28, 1.06) | 0.66 (0.27, 1.08) | 0.94 |
IQR=interquartile range Wilcoxon test
Associations of 1- year change in estrogen metabolites to incident breast cancer
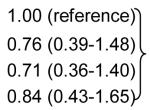
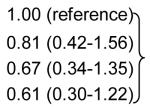
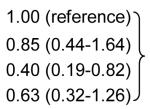
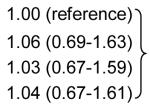
Overall, none of the 1-year changes in estrogen metabolites showed a clear pattern of association with breast cancer risk, evaluated in quartiles or per (log-transformed) unit change (Table 6). For E-alone, breast cancer risk was associated with smaller increase in 16αOHE-1, 2-OHE-1 and the 2:16 ratio, although ORs were generally not significant. ORs for a 1 ln-unit increase in estrogen metabolites generally showed a similar pattern that was relatively unaffected by adjusting for BMI. However, greater 1 year increase in both metabolites and the 2:16 ratio was associated with lower odds of breast cancer in models that adjusted for baseline levels, particularly for the E-alone arm. However, confidence intervals were wide and results were not significant. Results were similar if restricted to ER+/PR+ total or ER+/PR+ invasive cancer only (not shown). However, when stratified by median follow-up time (online Table 1), unadjusted ORs for quartiles of 1 year change in both 2-OHE-1 and the 2:16 ratio showed a stronger protective association with breast cancer that occurred before median follow-time compared with cases that occurred post-median follow-up time, or overall.
Table 6.
Association between 1-year HT-induced change in estrogen metabolites and breast cancer risk among study participants randomized to active treatment, stratified by WHI Hormone Trials (E-alone vs. E+P)
| N Cases/Controlsa |
Median (IQR) | OR (95% CI) | p | ||
|---|---|---|---|---|---|
| Change in 16α-OHE1 (pg/ml) | |||||
| E-alone | Quartile 1b | 32/80 | −36.0 (−64.5, −14.0) |
|
0.77e |
| Quartile 2b | 29/82 | 28.0 (8.0, 36.0) | |||
| Quartile 3b | 22/81 | 66.0 (55.0, 81.0) | |||
| Quartile 4b | 24/80 | 152.8 (117.8, 204.3) | |||
| Continuousb | 0.34 (0.008-13.8) | 0.57 | |||
| Continuousc | 0.42 (0.01-17.66) | 0.65 | |||
| Continuousd | 0.06 (0.00, 7.46) | 0.26 | |||
|
| |||||
| E+P | Quartile 1b | 74/122 | −20.0(−45.5, −2.5) |

|
0.45e |
| Quartile 2b | 69/123 | 32.8 (23.0, 45.1) | |||
| Quartile 3b | 85/125 | 87.0 (73.0, 104.4) | |||
| Quartile 4b | 65/120 | 185.0 (149.5, 240.0) | |||
| Continuousb | 0.39 (0.07-2.08) | 0.27 | |||
| Continuousc | 0.48 (0.09-2.40) | 0.37 | |||
| Continuousd | 0.38 (0.06, 2.27) | 0.29 | |||
|
| |||||
| Change in 2-OHE1 (pg/ml) | |||||
| E-alone | Quartile 1b | 32/80 | 18.5 (−8.6, 93.8) |
|
0.52e |
| Quartile 2b | 29/81 | 220.1 (181.5, 252.0) | |||
| Quartile 3b | 27/81 | 344.8 (313.7, 389.5) | |||
| Quartile 4b | 20/81 | 606.0 (503.5, 725.5) | |||
| Continuousb | 0.69 (0.18-2.64) | 0.58 | |||
| Continuousc | 0.70 (0.18-2.77) | 0.62 | |||
| Continuousd | 0.10 (0.00, 3.03) | 0.26 | |||
|
| |||||
| E+P | Quartile 1b | 69/122 | 17.0 (−10.7, 85.5) |

|
0.71e |
| Quartile 2b | 85/123 | 228.0 (182.3, 272.0) | |||
| Quartile 3b | 71/121 | 372.0 (340.0, 415.8) | |||
| Quartile 4b | 68/123f | 582.5 (506.0, 738.7) | |||
| Continuousb | 0.88 (0.50-1.54) | 0.65 | |||
| Continuousc | 1.02 (0.57-1.84) | 0.94 | |||
| Continuousd | 0.72 (0.35, 1.49) | 0.37 | |||
|
| |||||
| Change in 2:16 ratio | |||||
| E-alone | Quartile 1b | 32/81 | 0.08 (−0.02, 0.17) |
|
0.07e |
| Quartile 2b | 34/80 | 0.49 (0.40, 0.59) | |||
| Quartile 3b | 18/81 | 0.87 (0.77, 0.96) | |||
| Quartile 4b | 23/81 | 1.38 (1.20,1.70) | |||
| Continuousb | 0.57 (0.08-3.90) | 0.57 | |||
| Continuousc | 0.59 (0.08-4.17) | 0.59 | |||
| Continuousd | 0.07 (0.00, 6.56) | 0.25 | |||
|
| |||||
| E+P | Quartile 1b | 71/123 | 0.04 (−0.03-0.14) |
|
0.99e |
| Quartile 2b | 73/122 | 0.46 (0.37-0.54) | |||
| Quartile 3b | 73/122 | 0.83 (0.75-0.95) | |||
| Quartile 4b | 75/122 | 1.38 (1.21-1.74) | |||
| Continuousb | 1.01 (0.36-2.86) | 0.99 | |||
| Continuousc | 1.41 (0.47-4.23) | 0.54 | |||
| Continuousd | 0.60 (0.11, 3.38) | 0.56 | |||
1-year changes assessed only among those assigned to active treatment, not those assigned to placebo. All models account for age and ethnicity-matching. For continuous models, change in estrogen metabolite levels are log-transformed (after adding a constant).
n’s differ from total due to missing values: 16-OHE-1 (1 case and 1 control), 2-OHE-1 (1 control, and 2:16 ratio (2 cases, 1 control)
Unadjusted
Adjusted for BMI
Adjusted for ln-transformed baseline levels
p-value for Wald Χ2 test for differences among quartiles. HT= hormone therapy
IQR=interquartile range
OR=odds ratio
CI=confidence interval
Discussion
This is the first study to evaluate estrogen metabolites in relation to incident breast cancer within the context of a randomized clinical trial of HT. Incident breast cancer risk was modestly associated with higher baseline levels of 16-αOHE-1 among ER+/PR+ cases, but was also associated with higher baseline levels of 2-OHE-1 and the 2:16 ratio. For those randomized to active treatment, the 1-year increase in 16α-OHE1 was greater for E+P than for E-alone, but incident breast cancer was not associated with greater 1-year increases in 16α- OHE1 for either the E+P or the E-alone trial. Finally, greater 1-year increases in 2-OHE-1 or the 2:16 ratio were associated with lower odds of breast cancer but were generally not significant, although associations were stronger in the E-alone trial or for cases occurring before median follow-up time.
Although E+P treatment increased serum levels of 16α-OHE1 more than E-alone, this difference does not appear to explain the increased breast cancer risk with active treatment in the WHI E+P (E+P) trial vs. the decreased breast cancer risk in the WHI E-alone (E-alone) clinical trial. A noteworthy finding is that randomization to active treatment in either trial (E+P or E-alone) similarly increased 2-OHE1 ~4-fold, raising 2-OHE-1 to levels similar to 16α-OHE1, and changing the 2:16 ratio from ~0.35 at baseline to 1.0 at 1 year. The substantial increase in 2- compared to 16- is consistent with our previous reports from non-randomized HT (26;30) and the Woman On the Move through Activity and Nutrition (WOMAN) study, a randomized trial of weight loss among women on HT. (31) At baseline, compared with women not on HT, women on HT had 2-OHE1 levels five times higher but similar 16α-OHE1 levels. The WHI HT trial results were published shortly after randomization in the WOMAN study, and most of the participants stopped their HT, mostly E+P. There was a very substantial decline in levels of 2- OHE1 between baseline and the 18-month follow up visit for women who had stopped their HT. In contrast, for women not using HT at either visit, correlations between 2-OHE1 and 16α-OHE1 levels measured ~18 months apart were 0.54 and 0.85, respectively.
In the current study, the association of metabolites and risk of breast cancer were somewhat stronger among ER+/PR+ cases than ER-/PR- cases. For example, breast cancer risk was associated with higher levels of 16α-OHE1 among ER+/PR+ cases (not significant.) ER+/PR+ breast cancer also showed stronger associations with higher baseline 2-OHE1 levels, but there were n=423 ER+/PR+ cases and only n=67 ER-/PR- cases, so we had reduced power to detect a significant risk for ER-/PR- cases.
Several studies have reported results similar to our baseline estrogen metabolite associations. A large nested case-control study of postmenopausal breast cancer (n=426 cases and 426 controls) with urinary 2-OHE and 16α-OHE1 also found a positive association of 2-OHE with ER+ breast cancer, but among HT users only, with no associations among non-HT users or ER- cases.(24) Among postmenopausal non-HT users, the Nurses’ Health Study plasma levels of 2-OHE1 and the 2:16 ratio were positively associated with breast cancer, but only for ER-/PR- cases. (32) Studies that did not stratify by ER status have also reported a positive association of the 2:16 ratio with incident breast cancer for premenopausal women(25) and postmenopausal women. (18) Among postmenopausal non-HT users, Cauley et al. found a non-significant increased risk with increasing quartile of both 2-OHE1 and 16α-OHE1 but not with the 2:16 ratio. (23) The analyses did not stratify by ER status.
Our results are also in agreement with those of the Prostate, Lung, Colon and Ovary (PLCO) screening trial, which recently used new technologies to evaluate multiple estrogen metabolites in blood and urine. (10) The PLCO longitudinal study included 277 postmenopausal incident breast cancers and 433 controls, none of whom were using HT, and also found that incident breast cancer was associated with higher levels of serum 2-OHE1, and 16αOHE-1 (not statistically significant) as well as higher levels of total estrogens and unconjugated estradiol. (33) However, in the PLCO study, the ratio of the 2-OHE1 pathway to total estrogens was inversely related to breast cancer risk, as was the ratio of the entire 2-hydroxylation pathway to the 16 hydroxylation pathway, consistent with the current study’s original hypothesis that preferential metabolism to the 2-hydroxylation pathway is associated with lower breast cancer risk. In addition, both 4-OHE-1 and the ratio of 4-hydroxy pathway catechols to methylated catechols were positively related to breast cancer risk. (33) These results from the PLCO Study suggest that the evaluation of estrogen metabolites may need to be done in the context of total estrogen or unconjugated estrogen levels, and may explain, in part, the negative results in this study and previous studies.
Our results showing that in among women randomized to HT, 2-OHE1 increases much more than 16α-OHE1 suggests that differences in metabolism of exogenous estrogens may be a partial explanation for the apparent smaller increased risk of breast cancer with oral HT, compared with the more substantial increase in breast cancer associated with higher levels of endogenous estrone and estradiol. (1) It is possible that other estrogen metabolites, i.e. 4-OH pathway, not measured in this study could contribute to an increased or decreased risk of breast cancer. Some of the metabolites resulting from HT could be acting as a selective estrogen receptor modulator (SERM), decreasing both breast cancer risk and osteoporotic fracture with small effect on CHD. Another possible contributor to smaller than expected HT-related increased breast cancer risk is that although total estradiol increases substantially with both E- alone and E+P, free or bioavailable estradiol increases only slightly because of the concomitant increase in SHBG. Oral estrogen therapy clearly has estrogenic effects on bone, uterus and other tissues. It is very possible that the balance of the effects of the specific metabolites of oral E-alone and E+P, both estrogenic and anti-estrogenic effects, the effects of oral estrogens by their first pass from gut to liver, i.e. increased SHBG and other proteins, and host susceptibility (genetics), play a key role in the specific health effects of oral E-alone or E+P therapy. The WHI is currently measuring unconjugated estradiol, estrone, progesterone, testosterone and SHBG in the HT arm at baseline and 1 year. Further evaluation of estrogen metabolites, especially in relation to tumor characteristics, may provide a better rationale for effects of oral E-alone or E+P on breast cancer risks. Most important, it may be possible to individualize therapy based on both risk and metabolism of hormones.
A possible limitation of the study is the measurement of the metabolites in serum, whereas many previous studies have used plasma or urine specimens. The correlation between plasma and urine estrogen metabolites has been studied and found to be only fair (0.52 for the 2:16 ratio, 0.60 for 2:OHE1 and only 0.22 for 16α-OHE1) and to differ according to baseline urinary 2:16 ratio and other covariates. (34) The relationship of serum, plasma or urinary metabolites to metabolite levels in tissue is relatively unknown, although a recent study showed a fair correlation between urinary 2:16 ratio and breast tissue ratio levels. (35) Reproducibility of the estrogen metabolites was very good, judging by high intraclass correlations (ICCs)(86-94%), which were higher than in a previous study,(32) but %CVs (15-28%), while in the acceptable range, were lower than previous reports. A possible explanation for both is probable HT use by some of the women providing QC samples, particularly for the 2:16 ratio, for which paired samples would cluster around 1.0 for HT users and around 0.3 for non-users. Another reason for higher ICCs in our study is that our ICCs include only inter-assay variation of a single sample, whereas the previous study evaluated paired samples collected up to 3 years apart.(32)
In summary, to our knowledge, this study of over 2,500 women is the largest of its kind exploring breast cancer and its relationship to serum estrogen metabolites in relation to HT. This sample from the WHI study population represents a very large, geographically diverse cohort of U.S. women, with valuable incident and prevalent epidemiological and clinical information. Furthermore, this is the only study which evaluates the change in estrogen metabolites with randomization to E+P vs. E-alone. These results demonstrate that although 16α-OHE1 was increased more by E+P than by E-alone, the increase in the 2:16 ratio was similar for both HT regimens, due to ~4-fold greater increase in 2OHE-1 than 16α-OHE1 for both HT regimens. Second, baseline and 1 year change in 16α-OHE1 showed little relationship to incident breast cancer. In contrast, higher baseline 2-OHE1 and the 2:16 ratio were modestly associated with higher odds of incident breast cancer, but larger 1 year increase in 2-OHE-1 and the 2:16 ratio were also weakly associated with lower odds of breast cancer, even if adjusted for baseline metabolite levels. It is possible that differences in metabolism of oral estrogens, (i.e., as demonstrated in this study, the increase primarily in the 2-OHE1, a less potent estrogen with regard to breast cancer, and also by the previously reported increase in SHBG), may be important determinants of risk of breast cancer with oral E-alone or E+P.
Supplementary Material
Acknowledgements
The authors thank the following key investigators involved in the WHI:
Program Office: (National Heart, Lung, and Blood Institute, Bethesda, Maryland) Elizabeth Nabel, Jacques Rossouw, Shari Ludlam, Linda Pottern, Joan McGowan, Leslie Ford, and Nancy Geller.
Clinical Coordinating Center: (Fred Hutchinson Cancer Research Center, Seattle, WA) Ross Prentice, Garnet Anderson, Andrea LaCroix, Charles L. Kooperberg, Ruth E. Patterson, Anne McTiernan; (Wake Forest University School of Medicine, Winston-Salem, NC) Sally Shumaker; (Medical Research Labs, Highland Heights, KY) Evan Stein; (University of California at San Francisco, San Francisco, CA) Steven Cummings.
Clinical Centers: (Albert Einstein College of Medicine, Bronx, NY) Sylvia Wassertheil-Smoller; (Baylor College of Medicine, Houston, TX) Jennifer Hays; (Brigham and Women’s Hospital, Harvard Medical School, Boston, MA) JoAnn Manson; (Brown University, Providence, RI) Annlouise R. Assaf; (Emory University, Atlanta, GA) Lawrence Phillips; (Fred Hutchinson Cancer Research Center, Seattle, WA) Shirley Beresford; (George Washington University Medical Center, Washington, DC) Judith Hsia; (Los Angeles Biomedical Research Institute at Harbor- UCLA Medical Center, Torrance, CA) Rowan Chlebowski; (Kaiser Permanente Center for Health Research, Portland, OR) Evelyn Whitlock; (Kaiser Permanente Division of Research, Oakland, CA) Bette Caan; (Medical College of Wisconsin, Milwaukee, WI) Jane Morley Kotchen; (MedStar Research Institute/Howard University, Washington, DC) Barbara V. Howard; (Northwestern University, Chicago/Evanston, IL) Linda Van Horn; (Rush Medical Center, Chicago, IL) Henry Black; (Stanford Prevention Research Center, Stanford, CA) Marcia L. Stefanick; (State University of New York at Stony Brook, Stony Brook, NY) Dorothy Lane; (The Ohio State University, Columbus, OH) Rebecca Jackson; (University of Alabama at Birmingham, Birmingham, AL) Cora E. Lewis; (University of Arizona, Tucson/Phoenix, AZ) Tamsen Bassford; (University at Buffalo, Buffalo, NY) Jean Wactawski-Wende; (University of California at Davis, Sacramento, CA) John Robbins; (University of California at Irvine, CA) F. Allan Hubbell; (University of California at Los Angeles, Los Angeles, CA) Howard Judd; (University of California at San Diego, LaJolla/Chula Vista, CA) Robert D. Langer; (University of Cincinnati, Cincinnati, OH) Margery Gass; (University of Florida, Gainesville/Jacksonville, FL) Marian Limacher; (University of Hawaii, Honolulu, HI) David Curb; (University of Iowa, Iowa City/Davenport, IA) Robert Wallace; (University of Massachusetts/Fallon Clinic, Worcester, MA) Judith Ockene; (University of Medicine and Dentistry of New Jersey, Newark, NJ) Norman Lasser; (University of Miami, Miami, FL) Mary Jo O’Sullivan; (University of Minnesota, Minneapolis, MN) Karen Margolis; (University of Nevada, Reno, NV) Robert Brunner; (University of North Carolina, Chapel Hill, NC) Gerardo Heiss; (University of Pittsburgh, Pittsburgh, PA) Lewis Kuller; (University of Tennessee, Memphis, TN) Karen C. Johnson; (University of Texas Health Science Center, San Antonio, TX) Robert Brzyski; (University of Wisconsin, Madison, WI) Gloria E. Sarto; (Wake Forest University School of Medicine, Winston-Salem, NC) Mara Vitolins; (Wayne State University School of Medicine/Hutzel Hospital, Detroit, MI) Michael S. Simon.
The study sponsors had no role in the design of the study; the collection, analysis, and interpretation of the data; the writing of the manuscript; or the decision to submit the manuscript for publication. The content is solely the responsibility of the authors and does not necessarily represent the official views of the National Institute of Neurological Disorders and Stroke or the National Institutes of Health. The complete list of WHI centers and investigators can be found online at http://www.whiscience.org/collaborators/investigators.php
Grant Support: The research on which this publication is based was funded by the WHI BAA was supported by contract Number HHSN268200764320C (to Dr. Kuller) from the National Heart, Lung, & Blood Institute. The Women’s Health Initiative (WHI) program is funded by the National Heart, Lung, and Blood Institute, National Institutes of Health, U.S. Department of Health and Human Services through contracts N01WH22110, 24152, 32100-2, 32105-6, 32108-9, 32111-13, 32115, 32118-32119, 32122, 42107-26, 42129-32, and 44221. The complete list of WHI centers and investigators can be found online at http://www.whiscience.org/publications/WHI_investigators_shortlist.pdf.
Footnotes
No potential conflicts of interest.
Reference List
- (1).Key T, Appleby P, Barnes I, Reeves G. Endogenous sex hormones and breast cancer in postmenopausal women: reanalysis of nine prospective studies. J Natl Cancer Inst. 2002;94:606–616. doi: 10.1093/jnci/94.8.606. [DOI] [PubMed] [Google Scholar]
- (2).Kaaks R, Rinaldi S, Key TJ, Berrino F, Peeters PH, Biessy C, et al. Postmenopausal serum androgens, oestrogens and breast cancer risk: the European prospective investigation into cancer and nutrition. Endocr Relat Cancer. 2005;12:1071–1082. doi: 10.1677/erc.1.01038. [DOI] [PubMed] [Google Scholar]
- (3).Rossouw JE, Anderson GL, Prentice RL, LaCroix AZ, Kooperberg C, Stefanick ML, et al. Risks and benefits of estrogen plus progestin in healthy postmenopausal women: principal results From the Women’s Health Initiative randomized controlled trial. JAMA. 2002;288:321–333. doi: 10.1001/jama.288.3.321. [DOI] [PubMed] [Google Scholar]
- (4).Chlebowski RT, Anderson GL, Gass M, Lane DS, Aragaki AK, Kuller LH, et al. Estrogen plus progestin and breast cancer incidence and mortality in postmenopausal women. JAMA. 2010;304:1684–1692. doi: 10.1001/jama.2010.1500. [DOI] [PMC free article] [PubMed] [Google Scholar]
- (5).Anderson GL, Limacher M, Assaf AR, Bassford T, Beresford SA, Black H, et al. Effects of conjugated equine estrogen in postmenopausal women with hysterectomy: the Women’s Health Initiative randomized controlled trial. JAMA. 2004;291:1701–1712. doi: 10.1001/jama.291.14.1701. [DOI] [PubMed] [Google Scholar]
- (6).Edlefsen KL, Jackson RD, Prentice RL, Janssen I, Rajkovic A, O’Sullivan MJ, et al. The effects of postmenopausal hormone therapy on serum estrogen, progesterone, and sex hormone-binding globulin levels in healthy postmenopausal women. Menopause. 2010;17:622–629. doi: 10.1097/gme.0b013e3181cb49e9. [DOI] [PMC free article] [PubMed] [Google Scholar]
- (7).Farhat GN, Cummings SR, Chlebowski RT, Parimi N, Cauley JA, Rohan TE, et al. Sex hormone levels and risks of estrogen receptor-negative and estrogen receptor-positive breast cancers. J Natl Cancer Inst. 2011;103:562–570. doi: 10.1093/jnci/djr031. [DOI] [PMC free article] [PubMed] [Google Scholar]
- (8).Okobia MN, Bunker CH. Estrogen metabolism and breast cancer risk--a review. Afr J Reprod Health. 2006;10:13–25. [PubMed] [Google Scholar]
- (9).Sepkovic DW, Bradlow HL. Estrogen hydroxylation--the good and the bad. Ann N Y Acad Sci. 2009;1155:57–67. doi: 10.1111/j.1749-6632.2008.03675.x. [DOI] [PubMed] [Google Scholar]
- (10).Ziegler RG, Faupel-Badger JM, Sue LY, Fuhrman BJ, Falk RT, Boyd-Morin J, et al. A new approach to measuring estrogen exposure and metabolism in epidemiologic studies. J Steroid Biochem Mol Biol. 2010;121:538–545. doi: 10.1016/j.jsbmb.2010.03.068. [DOI] [PMC free article] [PubMed] [Google Scholar]
- (11).Swaneck GE, Fishman J. Covalent binding of the endogenous estrogen 16 alpha-hydroxyestrone to estradiol receptor in human breast cancer cells: characterization and intranuclear localization. Proc Natl Acad Sci U S A. 1988;85:7831–7835. doi: 10.1073/pnas.85.21.7831. [DOI] [PMC free article] [PubMed] [Google Scholar]
- (12).Schneider J, Kinne D, Fracchia A, Pierce V, Anderson KE, Bradlow HL, et al. Abnormal oxidative metabolism of estradiol in women with breast cancer. Proc Natl Acad Sci U S A. 1982;79:3047–3051. doi: 10.1073/pnas.79.9.3047. [DOI] [PMC free article] [PubMed] [Google Scholar]
- (13).Fishman J, Schneider J, Hershcope RJ, Bradlow HL. Increased estrogen-16 alpha-hydroxylase activity in women with breast and endometrial cancer. J Steroid Biochem. 1984;20:1077–1081. doi: 10.1016/0022-4731(84)90021-9. [DOI] [PubMed] [Google Scholar]
- (14).Bradlow HL, Hershcopf RJ, Martucci CP, Fishman J. Estradiol 16 alpha-hydroxylation in the mouse correlates with mammary tumor incidence and presence of murine mammary tumor virus: a possible model for the hormonal etiology of breast cancer in humans. Proc Natl Acad Sci U S A. 1985;82:6295–6299. doi: 10.1073/pnas.82.18.6295. [DOI] [PMC free article] [PubMed] [Google Scholar]
- (15).Telang NT, Suto A, Wong GY, Osborne MP, Bradlow HL. Induction by estrogen metabolite 16 alpha-hydroxyestrone of genotoxic damage and aberrant proliferation in mouse mammary epithelial cells. J Natl Cancer Inst. 1992;84:634–638. doi: 10.1093/jnci/84.8.634. [DOI] [PubMed] [Google Scholar]
- (16).Kabat GC, Chang CJ, Sparano JA, Sepkovie DW, Hu XP, Khalil A, et al. Urinary estrogen metabolites and breast cancer: a case-control study. Cancer Epidemiol Biomarkers Prev. 1997;6:505–509. [PubMed] [Google Scholar]
- (17).Kabat GC, O’Leary ES, Gammon MD, Sepkovic DW, Teitelbaum SL, Britton JA, et al. Estrogen metabolism and breast cancer. Epidemiology. 2006;17:80–88. doi: 10.1097/01.ede.0000190543.40801.75. [DOI] [PubMed] [Google Scholar]
- (18).Muti P, Bradlow HL, Micheli A, Krogh V, Freudenheim JL, Schunemann HJ, et al. Estrogen metabolism and risk of breast cancer: a prospective study of the 2:16alpha-hydroxyestrone ratio in premenopausal and postmenopausal women. Epidemiology. 2000;11:635–640. doi: 10.1097/00001648-200011000-00004. [DOI] [PubMed] [Google Scholar]
- (19).Fowke JH, Qi D, Bradlow HL, Shu XO, Gao YT, Cheng JR, et al. Urinary estrogen metabolites and breast cancer: differential pattern of risk found with pre- versus post-treatment collection. Steroids. 2003;68:65–72. doi: 10.1016/s0039-128x(02)00116-2. [DOI] [PubMed] [Google Scholar]
- (20).Im A, Vogel VG, Ahrendt G, Lloyd S, Ragin C, Garte S, et al. Urinary estrogen metabolites in women at high risk for breast cancer. Carcinogenesis. 2009;30:1532–1535. doi: 10.1093/carcin/bgp139. [DOI] [PMC free article] [PubMed] [Google Scholar]
- (21).Meilahn EN, De Stavola B, Allen DS, Fentiman I, Bradlow HL, Sepkovic DW, et al. Do urinary oestrogen metabolites predict breast cancer? Guernsey III cohort follow-up. Br J Cancer. 1998;78:1250–1255. doi: 10.1038/bjc.1998.663. [DOI] [PMC free article] [PubMed] [Google Scholar]
- (22).Ursin G, London S, Stanczyk FZ, Gentzschein E, Paganini-Hill A, Ross RK, et al. Urinary 2-hydroxyestrone/16alpha-hydroxyestrone ratio and risk of breast cancer in postmenopausal women. J Natl Cancer Inst. 1999;91:1067–1072. doi: 10.1093/jnci/91.12.1067. [DOI] [PubMed] [Google Scholar]
- (23).Cauley JA, Zmuda JM, Danielson ME, Ljung BM, Bauer DC, Cummings SR, et al. Estrogen metabolites and the risk of breast cancer in older women. Epidemiology. 2003;14:740–744. doi: 10.1097/01.ede.0000091607.77374.74. [DOI] [PubMed] [Google Scholar]
- (24).Wellejus A, Olsen A, Tjonneland A, Thomsen BL, Overvad K, Loft S. Urinary hydroxyestrogens and breast cancer risk among postmenopausal women: a prospective study. Cancer Epidemiol Biomarkers Prev. 2005;14:2137–2142. doi: 10.1158/1055-9965.EPI-04-0934. [DOI] [PubMed] [Google Scholar]
- (25).Arslan AA, Shore RE, Afanasyeva Y, Koenig KL, Toniolo P, Zeleniuch-Jacquotte A. Circulating estrogen metabolites and risk for breast cancer in premenopausal women. Cancer Epidemiol Biomarkers Prev. 2009;18:2273–2279. doi: 10.1158/1055-9965.EPI-09-0312. [DOI] [PMC free article] [PubMed] [Google Scholar]
- (26).Modugno F, Kip KE, Cochrane B, Kuller L, Klug TL, Rohan TE, et al. Obesity, hormone therapy, estrogen metabolism and risk of postmenopausal breast cancer. Int J Cancer. 2006;118:1292–1301. doi: 10.1002/ijc.21487. [DOI] [PubMed] [Google Scholar]
- (27).Design of the Women’s Health Initiative clinical trial and observational study The Women’s Health Initiative Study Group. Control Clin Trials. 1998;19:61–109. doi: 10.1016/s0197-2456(97)00078-0. [DOI] [PubMed] [Google Scholar]
- (28).Hays J, Hunt JR, Hubbell FA, Anderson GL, Limacher M, Allen C, et al. The Women’s Health Initiative recruitment methods and results. Ann Epidemiol. 2003;13:S18–S77. doi: 10.1016/s1047-2797(03)00042-5. [DOI] [PubMed] [Google Scholar]
- (29).Anderson GL, Manson J, Wallace R, Lund B, Hall D, Davis S, et al. Implementation of the Women’s Health Initiative study design. Ann Epidemiol. 2003;13:S5–17. doi: 10.1016/s1047-2797(03)00043-7. [DOI] [PubMed] [Google Scholar]
- (30).Kuller LH, Matthews KA, Meilahn EN. Estrogens and women’s health: interrelation of coronary heart disease, breast cancer and osteoporosis. J Steroid Biochem Mol Biol. 2000;74:297–309. doi: 10.1016/s0960-0760(00)00106-0. [DOI] [PubMed] [Google Scholar]
- (31).Kuller LH, Pettee Gabriel KK, Kinzel LS, Underwood DA, Conroy MB, Chang Y, et al. The Women on the Move Through Activity and Nutrition (WOMAN) Study: Final 48-Month Results. Obesity (Silver Spring) 2011 doi: 10.1038/oby.2011.80. [DOI] [PMC free article] [PubMed] [Google Scholar]
- (32).Eliassen AH, Missmer SA, Tworoger SS, Hankinson SE. Circulating 2-hydroxy- and 16alpha-hydroxy estrone levels and risk of breast cancer among postmenopausal women. Cancer Epidemiol Biomarkers Prev. 2008;17:2029–2035. doi: 10.1158/1055-9965.EPI-08-0262. [DOI] [PMC free article] [PubMed] [Google Scholar]
- (33).Fuhrman BJ, Schairer C, Gail MH, Boyd-Morin J, Xu X, Sue LY, et al. Estrogen Metabolism and Risk of Breast Cancer in Postmenopausal Women. J Natl Cancer Inst. 2012 doi: 10.1093/jnci/djr531. [DOI] [PMC free article] [PubMed] [Google Scholar]
- (34).Bradlow HL, Jernstrom H, Sepkovic DW, Klug TL, Narod SA. Comparison of plasma and urinary levels of 2-hydroxyestrogen and 16 alpha-hydroxyestrogen metabolites. Mol Genet Metab. 2006;87:135–146. doi: 10.1016/j.ymgme.2005.08.001. [DOI] [PubMed] [Google Scholar]
- (35).Taioli E, Im A, Xu X, Veenstra TD, Ahrendt G, Garte S. Comparison of estrogens and estrogen metabolites in human breast tissue and urine. Reprod Biol Endocrinol. 2010;8:93. doi: 10.1186/1477-7827-8-93. [DOI] [PMC free article] [PubMed] [Google Scholar]
Associated Data
This section collects any data citations, data availability statements, or supplementary materials included in this article.


