Abstract
Two hundred Single Comb White Leg-Horn spent hens at the age of 70 weeks were purchased from a commercial layer farm. The birds were shifted to the Poultry Research Station, Department of Physiology and Pharmacology, University of Agriculture, Faisalabad, Pakistan. High dietary zinc (3 g/kg feed/day) was used to induce molting in all the birds after one week of acclimatization. Thereafter, birds were divided in groups of 50 birds each, with the following treatments: G1 [control; crude protein (CP)16%, no other supplement], G2 (CP18%, no other supplement), G3 (CP16%, Symbiotic, 85 mg/L drinking water) and G4 (CP16%, Probiotic, 85 mg/L in drinking water). Fifteen birds were slaughtered at 5% of peak of production for each group to collect their pituitary glands. Better egg production was seen in all the supplemented groups as compared to the control. Especially an earlier post molt production recovery and delayed decline was seen in G2 as compared to all other groups. The immunohistochemistry of the pituitary gland reveals the decrease (P≤0.01) in the cell and nucleus size as well as area of somatotrophs in G2 and G4 as compared to G1. The cell and nucleus size as well as area of lactotrophs decreased (P≤0.01) in G2, G3 and G4 as compared to G1. The better and earlier post molt production in G2 highlights the potential role of protein supplementation in connection with the decreased lactotroph size and area in molted birds.
Key words: immunohistochemistry, somatotroph, lactotroph, molting, protein, probiotic, layers.
Introduction
Molting is characterized by the periodic shedding and than replacement of feathers.1 This technique became very useful as well as the most adopting tool to expand and explore the production potential of laying hens till the early eighties. Keeping in view the economic aspect, the induced molting of laying hens is prudently valuable as it can save the money incurred on purchasing and rearing new flock till the age of maturity (20–22 week). However, the supplementation could be valuable in further extending and better production performance in the second production cycle of the molted birds.
The pituitary is master gland of body comprised of anterior and posterior pituitary also known as adenohypophysis and neurohypophysis. The adenohypophysis is responsible for the release of five major hormones including growth hormone (GH), prolactin (PRL), gonadotrophs (FSH and LH) and adenocorticotropic hormone (ACTH). The distribution of these hormone producing cells are scattered through cephalic and caudal lobe of the anterior pituitary in avian species. The intermediatory lobe is absent in the birds and some mammals.2 The plasma prolactin level increased from 5–10 folds with the expression of incubation phase.3 It was also reported that a replacement of somatotrophs in the caudal lobe of the anterior pituitary with the lactotrophs during the incubational resting phase is responsible for the hyperprolactineimia.4 It is supposed that change in the morphometry as well the apoptosis of somatotrophs and lactotrophs is connected with the process of molting. The importance of the protein in the diet could be highlighted by various reports in the literature regarding the effects of experimental protein deficiency on poultry.5 These include reduced growth, reduced feed consumption, decreased egg production and egg size, and loss of body weight in adults. Increasing the protein in the diet of post molted hens has lead to the early onset of egg production in the second production cycle after the molting.6 The protein addition in the diet has an improving effect on the post molt egg production percentage as well as egg weight and mass including FCR/dozen eggs.7,8 Probiotics are microbial cell preparations having beneficial effects on the host regarding health.9 Commonly Lactobacillus is being used by different researchers in their study. During stress induced by molting these microorganisms were most commonly compensated in birds.10
The dynamics of the anterior pituitary hormone producing cells were affected with the process of molting. Keeping in view the literature documentations and the significance of protein and probiotics supplementation, current study was planed to assess the efficacy of protein, probiotic and symbiotic supplementation on the dynamics of pituitary hormone producing cells in connection with the production performance in the molted layers.
Materials and Methods
A total of two-hundred aged spent commercial Single Comb White Leg Horn layers at the age of 70 week were arranged from a commercial poultry farm. The birds were brought to the Poultry Research Station at the Department of Physiology and Pharmacology, University of Agriculture, Faisalabad, Pakistan. One week for acclimatization was given to the birds during which crude protein (CP) 16% diet was offered at 100 g/bird/day, with 16 hours of light and water ad libitum. After one week of acclimatization all the birds were induced to molt by dietary Zn at 3 g/kg of the feed (Table 1). After molting the specified groups (50 birds each) with their respective treatments were allotted as follows: group G1 (control, CP16%, no supplement), G2 (2% Protein supplement; CP 18%, no other supplement), G3 [CP16%; Symbiotic (Perfectin®) in water at 85 mg L−1 of drinking water daily] and G4 [CP16%; Probiotic (Protexin®)] at 85 mg L−1 of drinking water daily. The composition of feed and supplements is presented in Table 2. The birds were sacrificed at peak of production to collect their pituitary glands as described below. The post molt egg production record was maintained in each group. The temperature of the poultry shed was maintained at 25±2°C throughout the experiment.
Table 1. Molting schedule of spent White Leg-Horn layers through high dietary zinc at 3 g/kg feed.
| Stage | Age (weeks) | Feed offered (g/bird/day) | Water | Light (hours) |
|---|---|---|---|---|
| Pre-molt* | 70 | 110 | Ad libitum | 16 |
| Start of molting° | 71–74 | 35 | Ad libitum | 12 |
| Rest period | 74–75 | 70 | Ad libitum | 12 |
| 76 | 80 | Ad libitum | 14 | |
| Post molt# | 77 to onward | 110 | Ad libitum | 16 |
Deworming, EDS & ND vaccination;
Zn included diet started;
start of egg production.
Table 2. Composition of supplements and feed (g/100 mg) for molted White Leg-Horn layers.
| Feed ingredients | CP16% Energy = 2795 Kcal g/100 g | CP18% Energy = 2800 Kcal g/100 g | Composition of Perfectin (per kg) probiotic: Viability: 1×10⁴ cfu mL−1 | Composition of Protexin Viability: 1×10⁶ cfu mL−1 |
|---|---|---|---|---|
| Corn | 40 | 40 | Lactobacillus acidophilus | Lactobacillus plantarum |
| Rice tips | 10 | 10 | Bifidobacterium thermophilus | Lactobacillus bulgaricus |
| Rice polishing | 11 | 11 | Bifidobacterium longum | Lactobacillus acidophilus |
| Maize gluten 30% | 6 | - | Streptococcus faecium | Lactobacillus rhamosus |
| Maize gluten 60% | - | 4 | Prebiotics | Bifidobacterium bifidum |
| Canola meal | 10 | 10 | Vit. A 4,000,000 U | Streptococcus thermophilus |
| Soybean meal | 8 | 10 | Vit. D3 800,000 U | Enterococcus faecium |
| Fish meal | 6 | 6 | Vit. E 500 U | Aspergillus oryzae |
| Dicalcium phosphate | 1.5 | 1.5 | Vit. K 200 mg | Candida pintolopesi |
| Limestone powder /0 chips | 7 | 7 | Vit. B1 200 mg | |
| Vitamin premix* + Amino acid° | 0.5 | 0.5 | Vit. B2 2000 mg | |
| Total | 100 | 100 | Vit. B6 600 mg | |
| Vit. B12 2000 mg | ||||
| Vit. C 2000 mg | ||||
| Folic acid 100 mg | ||||
| Niacin 10,000 mg | ||||
| L-lysine 5000 mg | ||||
| Dl-methionine 15,000 mg | ||||
| Iron 7500 mg | ||||
| Copper 1000 mg | ||||
| Zinc 7500 mg | ||||
| Manganese 10,000 mg |
CP, crude protein. Study groups: G1 (CP 16%, no other supplement); G2 (CP 18%, no other supplement); G3 (CP 16%, symbiotic at 1 g/4L drinking water); G4 (CP 16%, probiotic at 1 g/4L drinking water);
composition per kg of diet: vitamin A, 8300 U; cholecalciferol, 2200 U; vitamin E, 8 U; vitamin B12, 0.02 mg; riboflavin, 5.5 mg; D-calcium pantothenic acid, 15 mg; niacin, 36 mg; choline, 500 mg; folic acid, 0.5 mg; vitamin B1, 1 mg; pyridoxine, 2.2 mg; biotin, 0.05 mg; vitamin K, 2 mg;
composition per kg of diet: methionine, 0.143 g; lysine, 0.72 g; threonine, 0.35 g.
Immunocytochemistry of pituitary gland
The pituitary gland was collected from the each sampling bird within 30 min from slaughtering. The upper part of the skull was removed in the shape of a cup after reflecting the skin from the skull. The brain was recovered carefully from the skull in intact form. Pituitary gland was located at the base of the brain just beneath the hypothalamus. The pituitary glands were kept in Bouin's Hollande solution for 24 h after removal. After 24 h, pituitaries were shifted to 4% formalin solution and preserved till the paraffin blocking was done. The pituitary glands were dehydrated and paraffin blocking was done.11
Coating of slides and sectioning
The glass slides were cleaned by acid alcohol (1% HCl in 70% alcohol) and dried. The clean dried glass slides were coated by dipping in 0.1% Poly-L Lysine solution for 10 min; thereafter, glass slides were drained and dried at 60°C for 2 h.11 The pituitary sections were cut at 4 µM by using the microtome (HM-315, Microm GmbH, Walldorf, Germany). The appropriate sections were lifted on the Poly-L Lysine coated slides. The standard rehydration protocol was adopted to rehydrate the sections before the process of immunostaining. The primary antibodies against (human GH and Ovine Prolactin) were provided by the courtesy of Dr. A.F. Parlow (National Hormone and Peptide Program, Harbor-UCLA Medical Center, Torrance, CA, USA). All the antisera were rabbit raised.
Immunostaining of pituitary sections
Secondary antibody was rabbit specific (Biotinylated, goat antirabbit IgG; H+L), including HRP/DAB detection IHC kit, provided by Abcam (Cambridge, UK) (Cat #ab64261). The rehydrated and dewaxed slide was removed from the PBS container. The sections were identified and encircle by the Aqua hold barrier Pap pen (ProSciTech, Thuringowa, Australia) so that drop of regents and antibodies could stay over the sections. The antigen retrieval was attained by Tris-HCl buffer (0.1 M, pH 6.6) for 10 min at 121°C, which was optimum for single labeled staining of GH and PRL cells. A drop of Hydrogen peroxide block (ab64261, Abcam) was placed over the section and incubated for 10 min at room temperature to cease the activity of endogenous peroxidases. Thereafter, four washings of PBS were given and a drop of protein block (ab64261, Abcam) was placed over the section. After giving the five minutes of incubation at room temperature a single washing with PBS was given. A drop of diluted primary antibody of hGH (1:2000) and oPRL (1:200) was applied to the section to cover the whole section. Two hour of incubation at room temperature was given prior to the procedure of secondary antibody incubation and DAB staining. The primary antibody was washed four times with buffer after the completion of appropriate incubation. The rabbit specific secondary antibody (Biotinylated goat antirabbit IgG) was applied to the tissue and 10 min of incubation was given at room temperature. Four washings with buffer were thereafter given. Then, the enzyme streptavidin peroxidase was applied to the tissue and kept at room temperature for 10 min to incubate. After that, four rinses of buffer were given to the tissue. The concentrated chromogen (50 ×) was diluted to 1:50 with DAB substrate, mixed by swirling and applied to the tissue. Staining at room temperature was then performed for 10 min. DAB chromogen was washed five times by rinsing with buffer. The slide was air dried and mounted with DPX mountant and covered with cover slip.
Specificity of immunoreactive cells - negative control
The specificity of the primary antibody was crosschecked by running the negative control slides parallel. In these slides primary antibody was skipped or replaced with PBS/1% normal rabbit serum. Some slides were also incubated with appropriate primary antibodies; however, secondary antibody was raised in inappropriate specie (other than rabbit). No immunoreactive cells were observed in these control procedures (Figure 1).
Figure 1.
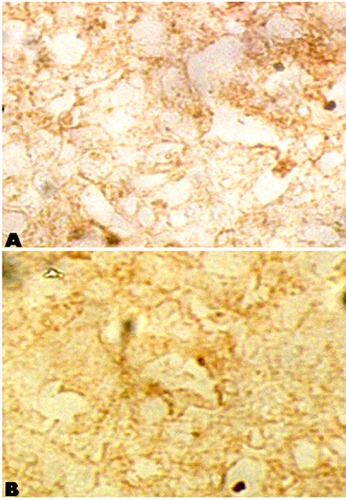
Negative control slides. A) primary antibody absent and replaced with PBS/1% normal rabbit serum; B) secondary antibody raised in-appropriate specie of primary antibody.
Morphometry of immunoreactive cells
The slides were observed under the microscope to locate the specified hormone producing cells. The morphometry of the immunoreactive cells showing complete cross sections with clear non-reactive nucleus were done. More than 100 cells in each section, three sections per slide and more than 20 slides were observed for each group (total cell number ≥6000). The Image J software (Image J 1.44P, Wayne Rasband, National Institute of Health, USA) was used to take the measurements. In morphometry whole cell and nucleus size (µm) as well as area (µm2) was calculated.
Statistical analysis
The significance of difference between different groups was assessed by applying one-way analysis of variance technique in completely randomized experimental design.12 In case of significant difference among groups, the Duncan multiple range test was applied and mean with standard error was calculated keeping the P value less than 0.01.13
Results
Egg production percentage
The egg production percentage in different groups throughout the experiment is presented in Figure 2. The post molt egg production peak was seen earlier in G2 and G3 group as compared to control (G1). The egg production percentage was remained high in G2 as compared to all other groups throughout the peak production phase. At the end of post molt production phase a delayed decline in production was seen in G2, G3 and G4 as compared to an abrupt decline in control (G1) group. Overall better production span was seen in G2 as compared to other groups.
Figure 2.
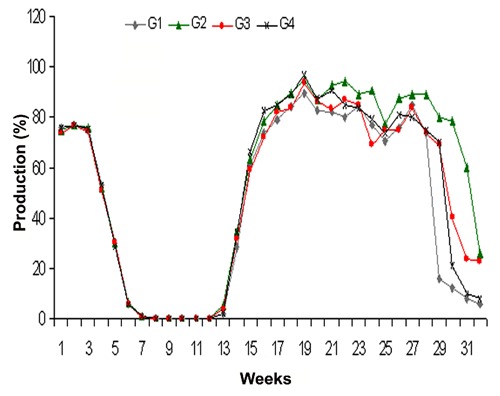
Egg production percentage in control (G1), 18% protein (G2), symbiotic (G3) and probiotic (G4) supplemented groups.
Morphometry of immunoreactive cells
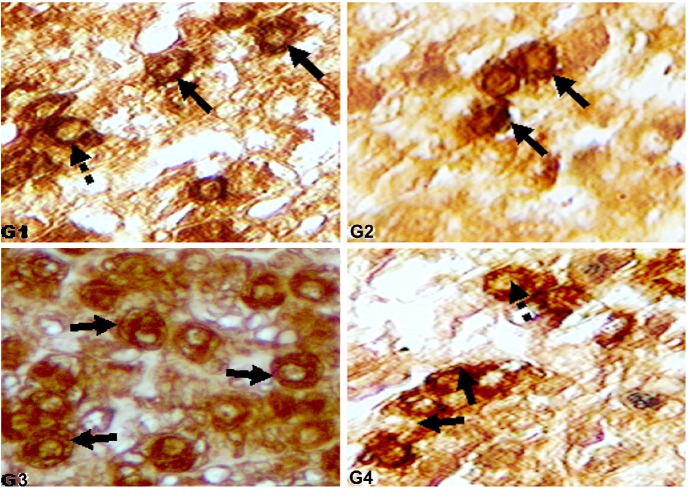
Over all mean somatotroph cell size found significantly reduced in the G2 and G4 as compared to G1 and G3, however in G4 over all mean cell size was even less (P≤0.01) than G2. The statistical comparison of cell size in different groups has been given in the Figure 3. Similar to the cell size over all mean cell area was also decreased (P≤0.01) in G2 and G4 as compared to G1 and G3 (Figure 3). The somatotroph over all mean nucleus size reduced significantly in G2 and G4 as compared to G1 and G3, which has been presented in the Figure 4. The over all mean nucleus area decreased (P≤0.01) in G2 and G4 as compared to G1 (Figure 4). The immunoreactive somatotrophs in different groups have been given in the Figure 5.
Figure 3.
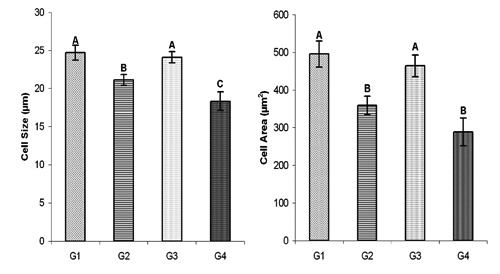
Overall mean somatotroph size (µm±SE) and area (µm2±SE) in control (G1), protein (G2), symbiotic (G3) and probiotic (G4) supplemented groups.
Figure 4.
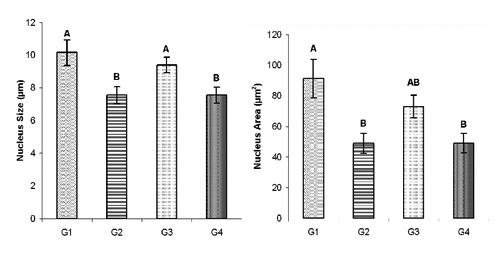
Overall mean somatotroph nucleus size (µm±SE) and area (µm2±SE) in control (G1), protein (G2), symbiotic (G3) and probiotic (G4) supplemented groups.
Figure 5.
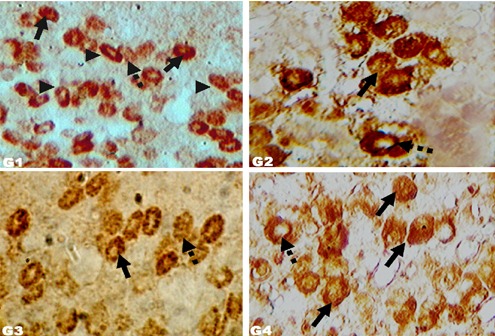
Immunoreactive somatotrophs in molted layers. Immunohistochemical localization of GH cells (400 ×) in Zn induced molted layers of different groups: G1 (control, crude protein 16%; no other supplement); G2 (crude protein 18%; no other supplement); G3 (crude protein 16%; symbiotic at 85 mg L−1 drinking water); G4 (crude protein 16%; probiotic at 85 mg L−1 drinking water). Arrowheads: elliptical GH cells. Arrows: more densely stained immunoreactive GH cells. Dashed arrows: less densely stained immunoreactive GH cells.
The over all mean size of lactotrophs decreased significantly in all the supplemented groups (G2, G3 and G4) as compared to G1 (Figure 6). The over all mean cell size in G2 was even less (P≤0.01) than the cell size in G3 and G4; however, the over all mean cell area was not found to be significantly different among various groups (Figure 6). Similar to cell size, over all mean nucleus size and area was also decreased (P≤0.01) in all supplemented groups (G2, G3 and G4) as compared to G1 (Figure 7). The immunoreactive lactotrophs in various groups have been presented in Figure 8.
Figure 6.
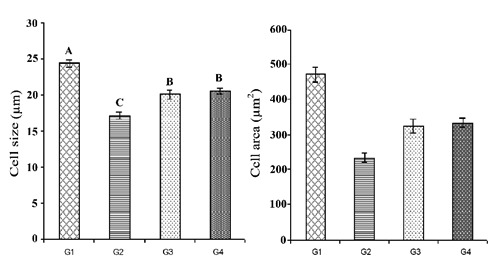
Overall mean lactotroph size (µm±SE) and area (µm2±SE) in control (G1), protein (G2), symbiotic (G3) and probiotic (G4) supplemented groups.
Figure 7.
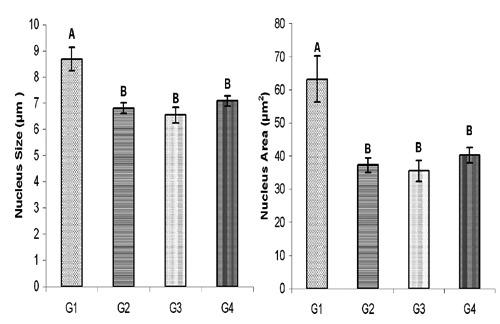
Overall mean lactotroph nucleus size (µm±SE) and area (µm2±SE) in control (G1), protein (G2), symbiotic (G3) and probiotic (G4) supplemented groups.
Figure 8.
Immunoreactive lactotrophs in molted layers. Immunohistochemical localization of Prolactin (PRL) cells (400 ×) in Zn induced molted layers of different groups: G1 (control, crude protein 16%; no other supplement); G2 (crude protein 18%; no other supplement); G3 (crude protein 16%; symbiotic at 85 mg L−1 drinking water); G4 (crude protein 16%; probiotic at 85 mg L−1 drinking water). Arrows: more densely stained immunoreactive lactotrophs. Dashed arrows: less densely stained immunoreactive lactotrophs.
Discussion
The fluctuation in circulating hormones is related to the phase of feed withdrawal used for the induction of molt, and many researchers have reported the increases in growth hormone, thyroid hormone and corticosterone during that phase.14,15 On the other hand, some researchers reported a decline in circulating prolactin, luteinizing hormone, estrogen, and progesterone during the fasting period.14,16 Yoshimura et al.17 mentioned an increase in the proliferation of the adenohypophyseal cells during the molting phase and at the resumption of laying. Chowdhury and Yoshimura18 reported the replenishment of the PRL and GH cell populations with the resumption of laying, which were changed during the process of molting. These literature reports highlight the change in anterior pituitary cellular morphology, as well as the expression of their receptors during and after the process of molting. Induced molting was reported to influence the dynamics of adenohypophyseal hormone-producing cells. However, supplementation affected adenohypophyseal cellular morphology of the molted birds in their 2nd production cycle. A decrease in the size and area of immunoreactive growth hormone producing (irGH) cells and then nuclei in G2 and G4 was seen. In previous reports, a decrease in cell population and size was reported in molted hens; however, supplementation did not show any significant impact on irGH cells. In contrast to this, Hara et al.19 described a negative impact of low protein in the diet on the cell and nucleus size of somatotrophs in growing rats. They also described a decrease in the secretory granules of reactive cells. Nevertheless, the difference between that study and the current experiment is in the age and species, because the levels and requirement of growth hormone is high during development in young animal and decreases with age due to the internalization of receptors along with the decreased production from the GH-producing cells of the pituitary. So, no improvement or rather reduction in the cell size and area of somatotrophs may be due to the aging and molting of the layers that are at the end of their first production cycle. Their cellular distribution was in line with previous findings;2 as more populations of irGH cells are seen in the caudal lobe of the parsdistalis. In G1, more populations were observed at the dorsal portion of the caudal lobe at the junction of the cephalic and caudal lobes, which was also reported.20 The immunoreactive prolactin (irPRL) cells irrespective of the groups were seen in the cephalic lobe which was also reported by Ramesh et al.21 and more recently the invasion of irPRL was seen by Sandhu et al.20 The decrease in the irPRL cell size and area in the supplemented groups supports the early resumption of laying and better egg production performance. Hyperprolactineimia is connected with the decline in egg laying and ultimately cessation, and is also associated with the incubational as well as nesting behavior.22 The bidirectional interconversion of somatotrophs (GH cells) into lactotrophs (PRL cells) has also been reported by many researchers in mammalian species previously, and these are denoted as mammosomatotrophs, which colocalize with GH and PRL.4 The population of these bihormonal cells was low during the peak of egg laying, as PRL is associated with the decrease or cessation in egg production.2 They have also seen that during or before the start of the incubational period, the presence of PRL mRNA in the irGH indicator the transformation of these irGH into complete lactotrophs. Halawani and Rozenboim22 have attributed hyperprolactinemia to ovarian regression and loss of egg production, which is ultimately responsible for huge economic losses to the turkey industry. This hyperprolactinemia is also responsible for hemoconcentration, hypoglycemia, hypothermia and enhanced blood ketone levels, which could lead to death in the turkeys if left untreated.23 The decreased cell and nucleus size in all of the supplemented groups as compared to the control shown the atrophy as well as reduction in the cellular proliferation, which is then responsible for decreased PRL production. This hypoprolectinemia in supplemented groups is also responsible for improved egg production performance as compared to the control. In the current study it was observed that supplementation of molted birds with extra protein and symbiotic did show an impact on earlier post molt production recovery, a better peak production phase and delayed decline in the production. The decrease of lactotroph cell size/area is also very well related with more sustained production in these groups. The supplementation with additional protein did show the promising results in production performance and anterior pituitary cellular morphometry.
Acknowledgements:
this experiment was funded by the Higher Education Commission of Pakistan under Indigenous PhD Scholarship scheme.
References
- 1.Bell DD. Historical and current moulting practices in the U.S. table egg industry. Poultry Sci. 2003;82:965–70. doi: 10.1093/ps/82.6.965. [DOI] [PubMed] [Google Scholar]
- 2.Ramesh R, Solow R, Proudman JA, Kuenzel WJ. Identification of mammosomatotrophs in the turkey hen pituitary: increased abundance during hyperprolactinemia. Endocrinology. 1998;139:781–6. doi: 10.1210/endo.139.2.5725. [DOI] [PubMed] [Google Scholar]
- 3.Proudman JA. The biology of egg production and fertility. Proc. 1st Int. Symp. on artificial insemination of poultry; Savoy. Poultry Science Association; 1995. pp. 128–48. [Google Scholar]
- 4.Porter TE, Wiles CD, Frawley LS. Evidence for bidirectional interconversion of mammotropes and somatotropes: rapid reversion of acidophilic cell types to pregestational proportions after weaning. Endocrinology. 1991;129:1215–20. doi: 10.1210/endo-129-3-1215. [DOI] [PubMed] [Google Scholar]
- 5.Scott ML, Austic RE, Gries CL. Nutritional deficiency diseases. In: Hofstad MSB, Calnek W, Helmboldt CF, Reid WM, Yoder HW Jr., editors. Diseases of poultry. Iowa State University Press; Ames, IA, USA: 1978. pp. 49–50. [Google Scholar]
- 6.Gunawardana P, Roland DA, Sr, Bryant MM. Effect of energy and protein on performance, egg components, egg solids, egg quality, and profits in molted hy-line w-36 hens. J Appl Poult Res. 2008;17:432–9. [Google Scholar]
- 7.Liu Z, Wu G, Bryant MM, Roland DA., Sr. Influence of added synthetic lysine in low-protein di-ets with the methionine plus cystine to lysine ratio main-tained at 0.75. J Appl Poult Res. 2005;14:174–82. [Google Scholar]
- 8.Zou SG, Wu YZ. Effect of supple-mental fat on performance of laying hens. Int J Poultry Sci. 2005;4:998–1000. [Google Scholar]
- 9.Fuller R. Probiotics in man and animals. J Appl Bacteriol. 1989;66:365–78. [PubMed] [Google Scholar]
- 10.Patterson JA, Burkholder KM. Application of prebiotics and probiotics in poultry production. Poult Sci. 2003;82:627–31. doi: 10.1093/ps/82.4.627. [DOI] [PubMed] [Google Scholar]
- 11.Culling CFA, Allison AT, Bair WT. 4th ed. Butterworth & Co., Ltd; Boston, MA, USA: 1998. Cellular pathology technique. [Google Scholar]
- 12.Steel RGD, Torrie JH, Dieky DA. 3rd ed. McGraw Hill Book Co. Inc.; New York, NY, USA: 1997. Principles and procedures of statistics. [Google Scholar]
- 13.Duncan DB. Multiple range and multiple F-test. Biometrics. 1995;11:1–42. [Google Scholar]
- 14.Hoshino S, Suzuki M, Kakegawa T, Imai K, Wakita M, Koba-yashi Y, Yamada Y. Changes in plasma thyroid hormones, luteinizing hormone (LH), estradiol, progesterone and corticosterone of laying hens during a forced molt. Comp Biochem Physiol. 1988;90:355–9. doi: 10.1016/0300-9629(88)91128-0. [DOI] [PubMed] [Google Scholar]
- 15.Dickerman RW, Wise TH, Bahr JM. Effects ovarian regression and molt on plasma concentrations of thymo sin beta 4 in domestic hen (Gallus domesticus) Domest Anim Endocrinol. 1992;9:297–304. doi: 10.1016/0739-7240(92)90017-r. [DOI] [PubMed] [Google Scholar]
- 16.Dickerman RW, Bahr JM. Molt induced by gonado-tropin-releasing hormone agonist as a model for studying endo-crine mechanism of molting in laying hens. Poult Sci. 1989;68:1402–8. doi: 10.3382/ps.0681402. [DOI] [PubMed] [Google Scholar]
- 17.Yoshimura Y, Heryanto B, Tamura T. Changes in the population of proliferating cells in chicken anterior pituitary during induced molting: an immunocytochemical analysis for proliferating cell nuclear antigen. Poult Sci. 1997;76:1569–73. doi: 10.1093/ps/76.11.1569. [DOI] [PubMed] [Google Scholar]
- 18.Chowdhury VS, Yoshimura Y. Cell proliferation and apoptosis in the anterior pituitary of chicken during inhibition and resumption of laying. Gen Comp Endocrinol. 2002;125:132–41. doi: 10.1006/gcen.2001.7739. [DOI] [PubMed] [Google Scholar]
- 19.Hara M, Herbert DC, Taniguchi T, Hattori T, Ohtani-Kaneko R, Iigo M, et al. Effects of a low-protein diet on prolactin- and growth hormone-producing cells in the rat pituitary gland. Anat Rec. 1998;251:37–43. doi: 10.1002/(SICI)1097-0185(199805)251:1<37::AID-AR7>3.0.CO;2-B. [DOI] [PubMed] [Google Scholar]
- 20.Sandhu MA, Rahman ZU, Riaz A, Rahman SU, Javed I, Ullah N. Somatotrophs and lactotrophs: an immunohistochemical study of Gallus domesticus pituitary gland at different stages of induced moult. Eur J Histochem. 2010;54:e25–e25. doi: 10.4081/ejh.2010.e25. [DOI] [PMC free article] [PubMed] [Google Scholar]
- 21.Ramesh R, Proudman JA, Kuenzel WJ. Changes in pituitary somatotroph and lactotroph distribution in laying and incubating turkey hen pituitary. Gen Comp Endocrinol. 1996;104:67–75. doi: 10.1006/gcen.1996.0142. [DOI] [PubMed] [Google Scholar]
- 22.El Halawani ME, Rozenboim I. The ontogeny and control of incubation behavior in turkeys. Poult Sci. 1993;72:906–11. [Google Scholar]
- 23.Zadworny D, Walton JS, Etches RJ. The relationship between plasma concentrations of prolactin and consumption of feed and water during the reproductive cycle of the domestic turkey. Poult Sci. 1984;64:401–10. doi: 10.3382/ps.0640401. [DOI] [PubMed] [Google Scholar]


