

Abstract
Allelic polymorphism of the apolipoprotein E (ApoE) gene (ApoE ε2, ApoE ε3 and ApoE ε4 alleles) gives rise to three protein isoforms (ApoE2, ApoE3 and ApoE4) that differ by 1 or 2 amino acids. Inheritance of the ApoE ε4 allele is a risk factor for developing Alzheimer's disease (AD). The potential diagnostic value of ApoE protein levels in biological fluids (i.e. cerebrospinal fluid, plasma and serum) for distinguishing between AD patients and healthy elderly subjects is subject to great controversy. Although a recent study reported subnormal total ApoE and ApoE4 levels in the plasma of AD patients, other studies have found normal or even elevated protein levels (versus controls). Because all previously reported assays were based on immunoenzymatic techniques, we decided to develop an orthogonal assay based on targeted mass spectrometry by tracking (i) a proteotypic peptide common to all ApoE isoforms and (ii) a peptide that is specific for the ε4 allele. After trypsin digestion, the ApoE4-specific peptide contains an oxidation-prone methionine residue. The endogenous methionine oxidation level was evaluated in a small cohort (n = 68) of heterozygous ε3ε4 carriers containing both healthy controls and AD patients. As expected, the proportion of oxidized residues varied from 0 to 10%, with an average of 5%. We therefore developed a standardized strategy for the unbiased, absolute quantification of ApoE4, based on performic acid oxidization of methionine. Once the sample workflow had been thoroughly validated, it was applied to the concomitant quantification of total ApoE and ApoE4 isoform in a large case-control study (n = 669). The final measurements were consistent with most previously reported ApoE concentration values and confirm the influence of the different alleles on the protein expression level. Our results illustrate (i) the reliability of selected reaction monitoring-based assays and (ii) the value of the oxidization step for unbiased monitoring of methionine-containing proteotypic peptides. Furthermore, a statistical analysis indicated that neither total ApoE and ApoE4 levels nor the ApoE/ApoE4 ratio correlated with the diagnosis of AD. These findings reinforce the conclusions of previous studies in which plasma ApoE levels had no obvious clinical significance.
Apolipoprotein E (ApoE) is a 299-amino acid protein associated with lipoproteins in the plasma and the cerebrospinal fluid (1). The three major genetic variants of ApoE in the general population isoforms (E2, E3, and E4, encoded by the ε2, ε3 and ε4 alleles, respectively) differ by a single amino acid: E2 (cys112, cys158), E3 (cys112, arg158), and E4 (arg112, arg158). Among the different susceptibility genes associated with the risk of late-onset Alzheimer's disease (AD)1 and other neurological conditions, ApoE has been identified as a strong genetic determinant (1). Moreover, the risk of AD is strongly correlated with ApoE4 allele because the presence of one or two copies of the allele increases risk of late-onset AD by about three or 12 times, respectively. Furthermore, the presence of one or two copies of ApoE4 allele correlates with an earlier age of onset by about 10–20 years with regard to noncarriers in patients with late-onset disease (2–4).
The diagnostic value of an ApoE assay in AD is however subject to debate. Indeed, supranormal (5), subnormal (6), and nondiscriminating (7–10) plasma concentrations of ApoE in AD cohorts have been reported in many studies based on immunoassay techniques. We wondered whether this ambiguity might be resolved by applying quantitative mass spectrometry (MS). Indeed, the combination of standardized, stable isotope dilution with targeted MS in selected reaction monitoring (SRM) mode is now widely accepted as a valuable alternative to immunoassays for accurate protein quantification (11–17) and may constitute the eagerly awaited bridge between the discovery and verification phases for candidate biomarker panels (18–22). A range of pilot studies have evaluated the sensitivity that can be achieved by SRM monitoring (23, 24); when tracking protein in a whole plasma hydrolysate, limits of quantification (LOQs) in the low μg/ml range are frequently reported (12). However, LOQs in the low nanogram/ml range or the detection of proteins expressed with a low copy number per cell require either immuno-enrichment of the target protein or fractionation of proteotypic peptides by cation exchange (24, 25) or off-gel electrophoresis (26). A generic strategy based on stable isotope standards and capture by antipeptide antibodies (referred to as SISCAPA) is a promising alternative to more traditional enrichment strategies. Numerous reports have already demonstrated the ability of single or multiplexed immuno-SRM to achieve limits of quantification of 1 nanogram/ml or below when starting from less than 100 μl of biofluid (27). Precision, reproducibility and robustness are also key parameters in the development of SRM-based assay platforms dedicated to the clinical verification phase. Indeed, accuracy may even be a secondary consideration at this point, because the main objective is to discriminate between specific and nondiscriminating biomarker candidates within the clinical panel. Various pilot studies of the intra- and interclass performances of SRM monitoring have demonstrated acceptable coefficients of variation and levels of imprecision (below 20%) and, importantly, have pinpointed the main pitfalls that can distort assay results (28–33). Indeed, performance levels and reliability of an assay can be drastically compromised by intraclass variance within the proteotypic peptide fraction, which is caused by chemical modifications of certain amino acid side chains. In particular, peptides containing methionine residues are usually not recommended for SRM-based assays, because the sulfur atom is prone to oxidation (34–36) both in vivo (37, 38) and during sample handling or storage (giving rise to methionine sulfoxide). Unfortunately, peptides containing one or more methionine residues are sometimes the only ones available. By way of an example, 17% of the 625 proteins identified by only one peptide in Human Plasma PeptideAtlas database contain at least one methionine. Hence, quantification of this type of proteotypic peptide is challenging because the ratio between nonoxidized and mono-oxidized sulfoxide forms of heavy-labeled standards also changes during storage. To circumvent this limitation, complete oxidization of the methionine-containing peptide population with chemical oxidant has been attempted but was not sufficiently robust or reproducible over several weeks in the context of large clinical study (39, 40).
Here, we report on the absolute quantification of total ApoE and ApoE4 isoform peptides by liquid chromatography (LC)-SRM targeted MS in a case-control study (n = 669). Because ApoE4-specific trypsin peptide possesses a single methionine residue (LGADMEDVR), oxidation was performed immediately after enzymatic digestion. The completeness of was carefully checked. We continuously assessed the overall performance of the assay by introducing quality control samples throughout the clinical cohort study, in order to ensure the validity of statistical comparisons between healthy controls and groups of AD patients.
EXPERIMENTAL SECTION
Standard Protocol Approvals, Registrations and Patient Consents
All subjects gave written informed consent for participation in this study. For those with substantial cognitive impairment, a caregiver, legal guardian, or other proxy gave consent. The study protocols were reviewed and approved by the appropriate Institutional review boards (CCPRB Brest, n°970-436-001 and CCPRB Lille, n°92/68).
Reagents and Chemicals
Acetonitrile, methanol and water (all LC-MS grade) were obtained from Fisher Scientific (Strasbourg, France). Dithiothreitol, iodoacetamide, ammonium bicarbonate, urea, formic acid, hydrogen peroxide, phenol and trypsin (type IX-S, from porcine pancreas) were purchased from Sigma-Aldrich (St. Quentin-Fallavier, France). Human plasma was obtained from the Institut Pasteur (Lille, France). Heavy peptide standards (13C5, 15N on the valine residue) and light peptide derived from ApoE (LGPLVEQGR) and ApoE4 (LGADMEDVR) were synthesized by Millegen (Labège, France).
Enzymatic Digestion
Plasma samples (100 μl) were denatured in 6 m urea, 15 mm dithiothreitol at 60 °C for 40 min and then alkylated with 35 mm iodoacetamide at room temperature in the dark for 40 min. To reduce the urea concentration, the samples were diluted 5-fold with ammonium bicarbonate before overnight digestion at 37 °C with trypsin using a 1:30 (w/w) enzyme to substrate ratio. Digestion was stopped by addition of formic acid to a final concentration of 0.5%. Heavy peptides (LGPLV*EQGR and LGAMEDV*R) were then added.
Methionine Oxidation
Performic acid was freshly prepared by dissolving 25 mg of phenol in 4.5 ml of formic acid. After cooling the solution to 0 °C, 0.5 ml of hydrogen peroxide was added. The resulting solution was gently stirred at room temperature for 30 min. 1.25 ml of performic acid was then added to the digested plasma. Oxidation took place for 24 h at 4 °C.
Sample Desalting
Samples were desalted using OasisTM HLB 3cc (60 mg) reversed phase cartridges (Waters, Milford, MA). Before loading of the tryptic digest, the Oasis cartridges were conditioned with 1 ml of methanol and then 1 ml of water containing 0.5% formic acid. Cartridges were washed with 1 ml of methanol/water (5/95, v/v) containing 0.5% formic acid and eluted with 1 ml of methanol containing 0.5% formic acid. Samples were evaporated to dryness and resuspended in 100 μl of water containing 0.5% formic acid.
Liquid Chromatography-mass Spectrometry
The LC-MS/MS analysis was performed with an HP 1290 series HPLC system (Agilent Technologies, Waldbronn, Germany) coupled to a QTRAP® 5500 LC-MS/MS hybrid triple quadrupole/linear ion trap mass spectrometer (AB Sciex, Foster City, CA) equipped with a Turbo V™ ion source. Instrument control, data acquisition and processing were performed using the associated Analyst 1.5.1 software. The mass spectrometer was initially calibrated with a polypropylene glycol standard (AB Sciex, Foster City, CA, USA). Q1 and Q3 quadrupole resolution was adjusted to 0.7 ± 0.1 Th. FWHM (referred to as unit resolution). The MS analysis was carried out in positive ionization mode, using an ion spray voltage of 5500V. The nebulizer (nitrogen) and the curtain gas flows (nitrogen) were both set to 50 psi. The Turbo V™ ion source was operated at 600 °C and the auxiliary gas flow (nitrogen) was set to 50 psi. The ultra-HPLC (UHPLC) separation was carried out on a Zorbax Eclipse plus C18 column (50 mm x 2.1 mm, particle size 1.8 μm) from Agilent Technologies (Waldbronn, Germany). Elution was performed at a flow rate of 600 μl/min with water containing 0.1% (v/v) formic acid as eluent A and acetonitrile containing 0.1% (v/v) formic acid as eluent B. The elution sequence comprised a 1.3-min plateau with 8% B, a linear gradient from 8% B to 20% B in 1.2 min and, lastly, a 0.8 min plateau with 100% B. The column was re-equilibrated for 1.5 min and the overall injection duty cycle was less than 5 min. The column temperature was set to 25 °C. From the initial set of candidate SRM transitions, those tracking LGPLVEQGR (484.8/701.4; 484.8/588.3; 484.8/489.2) and doubly oxidized LGADM(ox-ox)EDVR (519.3/924.4; 519.3/867.4; 519.3/681.3) peptides were selected for the final assay. The collision energy, declustering potential, and collision cell exit potential were optimized for each chosen SRM transition by infusing synthetic peptides. The SRM transitions were monitored and acquired at unit resolution in Q1 and Q3, with dwell times of 15 ms and 21 ms used for each transition for the LGPLVEQGR and LGADMEDVR peptides, respectively (yielding over 25 data points for each peak on the chromatogram).
Determination of Natural Oxidation
Sixty-eight ε3ε4 plasma samples were digested and desalted as described above. For the nonoxidized LGADMEDVR peptide, the 503.3/892.4, 503.3/835.4, and 503.3/518.3 SRM transitions were monitored. For the mono-oxidized form, the SRM transitions were 511.3/908.4, 511.3/844.4, and 511.3/780.4. The HPLC separation was carried out on a Symmetry C18 column (100 mm × 2.1 mm, particle size 3.5 μm) from Waters (Milford, MA, USA). Elution was performed at a flow rate of 300 μl/min with water containing 0.1% (v/v) formic acid as eluent A and acetonitrile containing 0.1% (v/v) formic acid as eluent B. Elution comprised a 3-min plateau with 5% B, a linear gradient from 5% B to 16% B in 8 min and, lastly, a 4-min plateau with 100% B. The column was re-equilibrated for 4 min. The overall injection duty cycle was 19 min and the column temperature was set to 25 °C.
Analysis of the Time Course of Methionine Oxidation
One hundred microliters of plasma were digested as described above. Heavy peptides (LGPLV*EQGR and LGADMEDV*R) were added to 1 ml of digested solution to a final concentration of 1.2 mg Apo E/ml plasma. For the pre-oxidation sample, 250 μl of water were added and solution was centrifuged at 15,000 × g for 30 min at 15∞C. The supernatant was recovered and 10 μl were injected into the HPLC system. Separation was performed under the same conditions as for determination of natural oxidation, except that the overall injection duty cycle was 30 min. For the oxidized samples, 250 μl of the mixture containing performic acid and phenol were added to another ml of digested solution containing the LGPLV*EQGR and LGADMEDV*R peptides at 1.2 mg Apo E/ml. The solution was centrifuged at 15,000 × g for 30 min at 15∞C. The supernatant was recovered and placed in an autosampler at 4∞C. Ten microliters of solution were injected after 2, 3, 4, 5, 6, 8, 10, 12, 14, 16, 18, 20, 22, 24, and 45 h.
Preparation of Standards and Quality Control Samples
Apolipoprotein E4 calibration curves (n = 3, for 3 days) were obtained by diluting ε4ε4 plasma into blank ε3ε3 plasma. The initial ApoE4 concentration was estimated to be 46.6 μg/ml in ε4ε4 plasma. Plasma standards and quality control (QC) samples were prepared by diluting ε4ε4 plasma into ε3ε3 plasma before enzymatic digestion. The ε4ε4 plasma volume ratios were 0, 0.14, 0.29, 0.43, 0.57, 0.71, and 1.0 for standards and 0.17, 0.51, and 0.86 for QC samples. Each standard and QC sample was digested with trypsin separately, and then oxidized and desalted as described above.
Data Analysis
Mean plasma ApoE and ApoE4 concentrations were compared between each group by analysis of variance (ANOVA -F-Test) with the analysis tool pack of Microsoft Office Excel 2007 and p value < 0.05 was regarded as statistically significant. Data were then studied by principal component analysis (PCA) with Jump (version 9.0) software. To achieve the PCA, qualitative variables having n levels were converted into n-1 discrete quantitative variables coded 0 or 1. For example, male and female samples were encoded 0 and 1, respectively. The other three parameters used were the age of patients, their total ApoE and ApoE4 plasma concentration.
RESULTS
The primary objective of the study was to develop an SRM-mode, MS-based assay for total plasma ApoE and the ApoE4 isoform in a cohort of AD patients. The SRM mode is now considered to be a powerful and orthogonal alternative to enzyme immunoassays. However, very few examples of large-scale analyses (n>100) over periods of weeks in true clinical cohorts have been published. Given the controversy over the value of ApoE levels in the diagnosis of AD, we evaluated not only conventional performance parameters (e.g. the interday (n = 9) CVs of six-point calibration curves, the linearity of the response and the LOQ) but also infrequently documented parameters, such as the stability of the labeled “heavy” peptide standards and the CV for the quality control samples over the weeks-long assay period. The sensitivity and specificity of SRM-based assays depend on appropriate selection of the proteotypic peptides. In our case, trypsin hydrolysis furnishes a single peptide (LGADMEDVR) for specifically assaying ApoE4, whereas LGPLVEQGR (previously identified as a good proteotypic candidate (12, 41, 42)) was monitored for total ApoE.
Levels of Mono-oxidized LGADMEDVR Peptide in the Plasma Hydrolysate
The signal from methionine-containing peptides is usually split into a nonoxidized/oxidized doublet as the combined result of natural and artificial oxidation (38). We thus checked the relative level of the oxidized form of the ApoE4 LGADMEDVR peptide sequence in ε3ε4 plasma. Product ion mass spectra of doubly protonated molecular ions of mono-oxidized and nonoxidized LGADMEDVR endogenous peptide (Fig. 1A and 1C) were used for identification and the subsequent choice of the best SRM transitions. The main observed peaks arose from y fragment ions and confirmed both the peptide sequences and the methionine residue oxidation state. In the case of mono-oxidized peptides (see the MS/MS spectrum in Fig. 1A), these y ions eliminate the side chain of the methionine residue and yield fragment ions with a −64 Da shift. For each unambiguously attributed peptide sequence, three SRM transitions for the most intense MS/MS fragment ions were selected. Fig. 1B shows extracted ion chromatograms of SRM transitions 511.3/908.4 (blue) and 514.3/914.4 (red) for mono-oxidized, endogenous LGADM(ox)EDVR and for heavy LGADM(ox)EDV*R and transitions 503.3/892.4 (green) and 506.3/898.4 (gray) for nonoxidized endogenous LGADMEDVR and heavy LGADMEDV*R in eight plasma samples. The results clearly show that the mono-oxidized species (detected at RT = 5.1 min) and the nonoxidized form (detected at RT = 8.2 min) are present in ε3ε4 plasma. Even the mono-oxidized form of the LGADMEDV*R peptide standard was detected. Fig. 1D shows the oxidation ratio across a panel of 68 ε3ε4 plasma samples (assuming that the ionization yield and the matrix effect are similar for the two species). The proportion of the oxidized form ranged from 0% to 10% and thus highlighted the inter-sample heterogeneity in endogenous oxidation.
Fig. 1.

Detection of endogenous oxidized and nonoxidized forms of the ApoE4-specific peptide LGADMEDVR in plasma from an AD cohort. B, shows extracted ion chromatograms of SRM transitions 511.3/908.4 (blue) and 514.3/914.4 (red) (monitored for mono-oxidized endogenous LGADM(ox)EDVR and heavy LGADM(ox)EDV*R) and transitions 503.3/892.4 (green) and 506.3/898.4 (gray) (monitored for nonoxidized endogenous LGADMEDVR and heavy LGADMEDV*R) in eight plasma samples. The MS/MS spectra correspond to the doubly protonated mono-oxidized endogenous LGADM(ox)EDVR ion (A) and the doubly protonated nonoxidized endogenous LGADMEDVR ion (C). Sixty-eight plasma samples from ε4 allele-bearing subjects (100 μl each) were selected randomly from the AD cohort and digested by trypsin before monitoring SRM transitions 511.3/908.4 and 503.3/892.4 (tracking oxidized and nonoxidized ApoE4-specific peptide LGADMEDVR, respectively) (D).
The Time Course of Methionine Oxidation
The presence of both non- and oxidized peptides in almost all plasma samples not only decreases sensitivity but also prevents accurate quantification of the ApoE4 isoform. In order to eliminate this source of bias, we chose to convert the ApoE4-specific LGADMEDVR peptide into the sole doubly oxidized methionine-containing species before MS quantification. The oxidation yield was initially assessed by monitoring the synthetic heavy LGADMEDV*R peptide standard spiked in water (Figs. 2A–2C). As expected, the full mass spectrum of the AQUA peptide LGADMEDV*R (Fig. 2A) shows a nonoxidized form (the doubly protonated [M+2H]2+ ion at m/z 506.2) and a mono-oxidized form (the doubly protonated ion [M+O+2H]2+ at m/z 514.3). We then evaluated hydrogen peroxide oxidation for 20h at 4 °C (Fig. 2B). Even though the doubly oxidized species was well detected as the major product (with a doubly protonated [M+2O+2H]2+ ion at m/z 522.2), the mono-oxidized form (m/z 514.3) was nevertheless still present. We then looked at whether a performic acid/phenol mixture could increase the oxidation yield. Phenol has been shown not to oxidize tyrosine residues, which may be of interest for future work on proteotypic peptides containing both tyrosine and methionine residues (43). As shown in Fig. 2C, the oxidation of the methionine residue in the LGADMEDV*R peptide was stoichiometric and yielded the [M+2O+2H]2+ ion alone (detected at m/z 522.2). Given that the LGPLVEQGR peptide is also monitored (to assay total ApoE), we also assessed the stability of this peptide to oxidation. Figs. 2D–2F shows the MS spectra of the synthetic LGPLV*EQGR peptide standard in water under the different oxidization conditions. The fact that only the doubly protonated ion [M+2H]2+ was ever detected (at m/z 487.8) demonstrated the lack of sensitivity of the peptide to oxidization.
Fig. 2.

Full mass spectra of AQUA peptides LGADMEDV*R and LGPLV*EQGR after oxidization in water and Oxidization kinetics in plasma. Mass spectra of synthetic LGADMEDV*R peptide in water containing 0.5% formic acid (A), after oxidization with hydrogen peroxide (B) and after oxidization with performic acid and phenol (C). Mass spectra of synthetic LGPLV*EQGR peptide in water containing 0.5% formic acid (D), hydrogen peroxide (E) or performic acid and phenol (F). G, shows the change over time in the LGADMEDV*R (blue), LGADM(ox)EDV*R (green), LGADM(ox-ox)EDV*R (black) and LGPLV*EQGR (pink) peak areas during oxidization with a performic acid/phenol mixture in digested plasma.
The time course of methionine oxidation was further studied by spiking both LGADMEDV*R and LGPLV*EQGR AQUA standards at a concentration of 1.2 mg/ml in digested plasma, to evaluate a potential matrix effect that could have affected the oxidation yield. Fig. 2G shows the SRM signal (blue) that tracks the kinetics of oxidation of the LGADMEDV*R into the doubly oxidized species by the performic acid/phenol mixture (see supplemental Fig. S1 in the supplemental materials for the MS-MS spectra that defines the three most intense transitions) and the stability of LGPLV*EQGR. The blue line highlights the rapid oxidation kinetics, because the nonoxidized species is already no longer detectable at t = 2 h. The evolution of the disappearance of the mono-oxidized LGADM(ox)EDV*R (green) corresponds to the appearance of the doubly oxidized LGADM(ox-ox)EDV*R (black) species. The signal curve of the latter indicates that the irreversible, double-oxidation reaction (38) was complete by 15h—even though the reaction was extended to 24 h for convenient time management in the clinical sample workflow. The pink curve emphasizes the high stability to oxidation of the LGPLV*EQGR proteotypic peptide used to track all three ApoE isoforms. The stoichiometric conversion of endogenous (light) nonoxidized and mono-oxidized LGADMEDVR peptide sequence into a single, doubly oxidized species was also assessed in a sample of pooled plasma containing APOE4 isoform. Supplemental Fig. S2 shows that, as expected, the nonoxidized and mono-oxidized LGADM(ox)EDVR peptides are detected before oxidation (at RT = 8.1 min and RT = 4.2 min, respectively (supplemental Fig. S2A and S2B), whereas the doubly oxidized LGADM(ox-ox)EDVR peptide is not (supplemental Fig. S2C). After 24 h of oxidation, only the doubly oxidized LGADM(ox-ox)EDVR peptide remains detectable (at RT = 6.5 min) in the plasma sample, demonstrating the completeness of the reaction for the endogenous LGADMEDVR peptide.
Validation of the Method and Cohort Analysis
Documented measurement accuracy is essential for the approval of biomarkers by the regulatory agencies but may be less important during the clinical evaluation phase, the ultimate goal of which is to distinguish between specific and nonspecific candidates. However, the quantification has to be repeatable. The debate on whether a heavy-labeled protein standard (which supposedly compensates for incomplete trypsin digestion) or AQUA peptide standard should be used was not applicable to our present study. Other groups have documented a high digestion yield and a linear response for ApoE in human plasma (12, 41, 42); this was confirmed by our present findings. Furthermore, the concentrations measured here were within the range of values reported in the literature for ELISAs.
Given the size of our AD cohort, the final assay was developed in an ultra-high performance liquid chromatography format. The overall cycle time for injection, separation, and conditioning was ∼5 min per analysis. This enabled us to process 80 samples per night i.e. two separately processed series for 40 patients. Because this type of chromatographic format is more subject to a matrix effect (because of a lower peak capacity), precision and robustness parameters were carefully evaluated to guarantee confident final statistical analysis. The overall analytical variability of the full sample workflow (including methionine oxidization) for three experiments over a one-week period and three experimental replicates per day was calculated as the coefficient of variation (CV). Each experiment comprised three replicates of six different dilutions of ε4ε4 plasma into ε3ε3 plasma (to cover the expected range of ApoE4 concentrations) and a spiked AQUA standard at a fixed concentration (Fig. 3). We also constituted quality controls at three different dilutions. Linear calibration curves were obtained by plotting peak area ratio between the LGADM(ox-ox)EDVR and the LGADM(ox-ox)EDV*R peptides versus the volume ratio of ε4ε4 plasma in ε3ε3 plasma. The peak area of endogenous LGADM(ox-ox)EDVR peptide (reconstituted on the most intense 519.3/924.4 SRM transition) was corrected by the peak area of the stable-isotope labeled peptide (tracked by transition 522.3/930.4). Linearity was observed between dilution factors 1 to 7, which corresponded to calculated concentrations (according to AQUA peptide standardization) of 46.6 to 6.7 μg/ml (r2 > 0.99). The ratio between nominal and calculated concentrations was below 15% for 99% of standard and QC samples, as reported in Table I (see also supplemental Table S1). Within three process replicates, the relative standard deviation and accuracy were between 4 and 10% and 97 and 103%, respectively. The response linearity and variability of LGPLV*EQGR standard diluted in digested plasma were assessed in a similar way (see supplemental Fig. S3).
Fig. 3.

Calibration curve for doubly oxidized endogenous LGADM(ox-ox)EDVR. The peak area ratio between the doubly oxidized endogenous LGADM(ox-ox)EDVR and the doubly oxidized internal standard LGADM(ox-ox)EDV*R is plotted against the dilution of ε4ε4 plasma in ε3ε3 plasma over a three-day experiment (three replicates per day). The heavy LGADMEDV*R peptide standard was spiked at a constant concentration of 55.6 μg/ml equivalent to ApoE4 protein.
Table I. Analytical performance levels (precision and accuracy) calculated for replicated calibration curves of ApoE4 peptide in ϵ4ϵ4 plasma diluted with ϵ3ϵ3 plasma.
| Sample type | n | ϵ4ϵ4 plasma volume ratio | Estimated concentration (μg/ml) | CV (%)a | Accuracyb |
|---|---|---|---|---|---|
| Standard | 9 | 0.00 | 0.0 | 4.8 | N/A |
| Standard | 9 | 0.14 | 6.66 | 7.2 | 99.2 |
| Standard | 9 | 0.29 | 13.3 | 9.5 | 97.3 |
| Standard | 9 | 0.43 | 20.0 | 9.5 | 99.6 |
| Standard | 9 | 0.57 | 26.6 | 5.0 | 101.2 |
| Standard | 9 | 0.71 | 33.3 | 5.8 | 102.0 |
| Standard | 9 | 1.00 | 46.6 | 5.0 | 98.9 |
| QC | 9 | 0.17 | 7.99 | 6.6 | 99.7 |
| QC | 9 | 0.51 | 24.0 | 6.8 | 98.6 |
| QC | 9 | 0.86 | 40.0 | 7.2 | 102.9 |
a Expressed as the relative standard deviation (S.D.), i.e., S.D./mean × 100.
b Expressed as a percent difference: ((concentration found − concentration added)/concentration added) × 100.
As recommended in regulatory agency guidelines, the interday variation of the full analytical process was systematically assessed by introducing triplicate QCs into each of the 17 series of 40 patients randomly selected from the 669-strong cohort. The 8 ml pool of plasma used for QC samples was obtained by pooling 200 μl aliquots of plasma from 40 patients into 8 tubes. A statistical analysis of QC sample assays (Fig. 4) run throughout the cohort study showed a mean imprecision below 10% for both total ApoE and ApoE4 isoform quantification and no individual imprecisions that exceeded the mean calculated concentrations (mean total ApoE concentration: 47.6 ± 3.0 μg/ml; mean ApoE4 concentration: 12.6 ± 1.2 μg/ml) by more than 20%. These controls illustrated the good repeatability of the full analytical process and the reasonable degree of confidence for analyzing the control patient cohort (n = 221) and the clinically diagnosed AD patients (n = 451). Fig. 5 shows typical extracted ion chromatograms obtained during the cohort analysis for SRM transitions 519.3/924.4 (blue), 519.3/867.4 (red) and 519.3/681.3 (green) (monitored for the doubly oxidized endogenous LGADM(ox-ox)EDVR) and transitions 522.3/930.4 (gray), 522.3/873.4 (orange) and 522.3/687.3 (black) (monitored for the doubly oxidized heavy LGADM(ox-ox)EDV*R) in ε4ε4 plasma (A), ε3ε4 plasma (B), and ε3ε3 plasma (C) samples. Both doubly oxidized endogenous LGADM(ox-ox)EDVR and heavy LGADM(ox-ox)EDV*R peptides were detected at RT = 1.19 min and RT = 1.26 min from ε4ε4 and ε3ε4 plasma, respectively. As expected, no doubly oxidized endogenous LGADM(ox-ox)EDVR was detected at RT = 1.19 min (the heavy standard) for the ε3ε3 plasma, because of the absence of ApoE4 in this genotype; this emphasizes the specificity of detection.
Fig. 4.

Quantification of total ApoE and ApoE4 in quality control samples. Mean and mean ± standard deviation values for the concentration of total ApoE and doubly oxidized ApoE4-specific peptide in the 17 series of triplicated quality control samples (n = 51) run throughout the clinical cohort study.
Fig. 5.

Reconstructed ion chromatograms for transitions monitoring doubly oxidized endogenous LGADM(ox-ox)EDVR and AQUA LGADM(ox-ox)EDV*R peptide sequences. The figure shows an overlay of SRM transitions 519.3/924.4 (blue), 519.3/867.4 (red), and 519.3/681.3 (green) (monitored for the doubly oxidized endogenous LGADM(ox-ox)EDVR) and SRM transitions 522.3/930.4 (gray), 522.3/873.4 (orange) and 522.3/687.3 (black) (monitored for the doubly oxidized heavy LGADM(ox-ox)EDV*R) in samples of ε4ε4 plasma (A), ε3ε4 plasma (B) and ε3ε3 plasma (C). The MS/MS spectrum corresponds to the doubly protonated, doubly oxidized endogenous LGADM(ox-ox)EDVR ion.
The total ApoE and ApoE4 levels were determined for each sample and results are reported in supplemental Table S2. Fig. 6 shows total ApoE and ApoE4 levels (except for the genotypes ε2ε3 and ε3ε3 lacking ApoE4) determined from the control (blue) and AD (red) samples for the ε2ε3 (A), ε3ε3 (B), ε2ε4 (C), ε3ε4 (D), and ε4ε4 (E) genotypes. The total ApoE concentration in plasma sample was around 50 μg/ml, which is consistent with the literature values (8–10). The total ApoE and ApoE4 levels varied according to the individual's genotype (as also reported in the literature (10)) in the following order: ε2ε3> ε2ε4> ε3ε3> ε3ε4> ε4ε4 (see supplemental Table S3 for the mean values from AD samples for each genotype). An analysis of variance (ANOVA) yielded p values <0.05, indicating that the inter-genotype difference are statistically significant. For ε3ε4 heterozygous patients, the ApoE4 protein only accounted for between 30 and 40% of the total ApoE (rather than 50%) (44). However, the control and AD groups did not differ significantly in this respect. Table II summarizes the total ApoE and ApoE4 levels obtained from the control and AD samples and the ANOVA results for each genotype. As indicated by the p values >0.05, the control and AD samples did not differ significantly in terms of total ApoE or ApoE4 levels. The data on ApoE and ApoE4 levels were further evaluated in a multivariate PCA. The parameters available for the samples (i.e. gender, age, genotype and three single nucleotide polymorphisms (SNP) (cf supplemental Table S2)) were chosen as descriptive variables and ApoE and ApoE4 levels were used as the quantitative variables. Fig. 7 shows the PCA plot for the ApoE level (Fig. 7A) and ApoE4 level (Fig. 7B) data sets, with the control (blue triangles) and AD (red circles) samples for ε3ε3 (Fig. 7A) and ε3ε4 (Fig. 7B) genotypes. Principal component 1 mostly depends on the SNP(427) factor, whereas principal component 2 depends on the SNP(419) factor. Principal component 1 and 2 accounted for about 45% of the total data variability. In conclusion, our analysis of total ApoE and ApoE4 isoform concentrations in plasma emphasized these parameters' inability to discriminate between our control and AD populations. However, ANOVA results confirm that the A/T transversion at nucleotide 491 significantly decreases plasma ApoE concentration independently of genotype or disease: 58.0 ± 16.2 μg/ml (n = 198) and 52.8 ± 12.3 μg/ml (n = 73) (p = 0.012).
Fig. 6.

Total ApoE and ApoE4 levels measured in the clinical AD cohort. Total ApoE concentrations in ε4-lacking carriers of ε2ε3 (A) and ε3ε3 (B) alleles in the healthy control group (blue) and the AD cohort (red). Total ApoE (top) and ApoE4 isoform (bottom) concentrations for carriers of ε2ε4, ε3ε4 (D) and ε4ε4 (E) alleles in the healthy control group (blue) and the AD cohort (red).
Table II. ApoE and ApoE4 levels (mean ± standard deviation) as a function of the genotype in healthy controls and diagnosed AD patients.
| Group | Genotype | n | Apo E (mean +/− S.D.) | p value | Apo E4 (mean +/− S.D.) | p value |
|---|---|---|---|---|---|---|
| Control | E2E3 | 20 | 68.5 +/− 13.0 | 0.065 | ||
| AD | 11 | 77.3 +/− 10.5 | ||||
| Control | E2E4 | 6 | 59.3 +/− 13.0 | 0.292 | 17.0 +/− 4.3 | 0.838 |
| AD | 21 | 66.2 +/− 14.2 | 17.5 +/− 5.8 | |||
| Control | E3E3 | 146 | 55.6 +/− 14.5 | 0.394 | ||
| AD | 182 | 57.1 +/− 16.5 | ||||
| Control | E3E4 | 48 | 48.3 +/− 10.5 | 0.157 | 17.4 +/− 5.6 | 0.269 |
| AD | 176 | 51.3 +/− 14.0 | 18.5 +/− 6.0 | |||
| Control | E4E4 | 1 | 45.2 | 0.780 | 45.9 | 0.771 |
| AD | 61 | 41.0 +/− 15.1 | 41.2 +/− 15.7 |
Fig. 7.
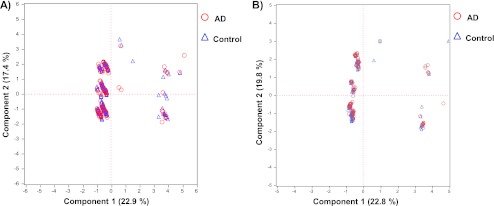
A principal component analysis plot of the ApoE (A) and ApoE4 (B) concentration data sets, showing healthy control samples (blue triangles) and AD cohort samples (red circles) for ε3ε3 (A) and ε3ε4 (B) genotypes.
DISCUSSION
Artifacts of methionine mono-oxidization during sample storage and preparation is especially harmful, because it prevents accurate, direct measurements of the natural oxidation level. Before the present study, we had carried out work that systematically evaluated the influence of storage conditions on the extent of oxidation of ApoE4 AQUA peptide; this parameter was especially influenced by the number of freeze-thaw cycles (data not shown). Hence, recently published articles on SRM-based protein quantification have generally not recommended methionine-containing proteotypic peptides as good candidates for the clinical validation of putative protein biomarkers (34–36). The relevance of this advice is borne out by the fact that that the proportion of mono-oxidized ApoE4 proteotypic peptide ranged from 0% to 10% in our present clinical AD cohort. This aspect was not considered in a previous report on simultaneous quantification of ApoE isoforms by tandem MS (45), even though the presence of the oxidized form must have considerably biased the final result.
Our present study showed that stoichiometric oxidization of methionine by phenol/performic acid mixture before MS quantification is a valuable way of circumventing this difficulty. In their pioneering AQUA article, Gygi's group applied a similar strategy for quantification of in vitro phosphorylated isoforms of separase by a bank of kinases (39). Very recently, Huillet et al. also used methionine oxidization before the quantification of troponin I (40). However, the method's performance levels and robustness were not evaluated in enough detail for its reliable transfer to large clinical studies.
In the present work, we have optimized and validated a sample workflow (with an overall CV below 10%) that includes protein digestion, methionine oxidization, desalting, and UHPLC-SRM-MS monitoring. This performance was calculated for three interday experiments, each of which comprised three calibration curves run in triplicate and drawn from six dilution points of ε4ε4 plasma into ε3ε3 plasma (covering the clinical concentration range for ApoE4). Similar statistics (again with a CV<10%) were obtained for all triplicates of the QC samples introduced in each of the 17 series of 40 patient samples per run throughout the entire analysis of the AD cohort and the control subjects (n = 669). The performance levels of the assay were reinforced by AQUA standardization and the use of internal QC samples (especially for assessing the day-to-day variability in digestion). The CVs were below 10% and were calculated for the 17 QC series analyzed over a period of two months (during which time other unrelated assays were also being run); these data highlight the robustness and reproducibility of the full sample processing and analytical platform. These performance levels can be achieved as long as key experimental steps are included in the validation phase. The long-term stability of stock or working solutions of AQUA peptides or heavy-labeled protein standards should also be checked and documented, because it represents a potential major cause of variations. One could consider labeled (heavy) protein to be the gold standard“, because it will compensate for any losses during sample fractionation or for a poor digestion yield. Although the prospect of greater accuracy (relative to the AQUA method) with protein standards is attractive, the technique is likely to be less reliable; Hoofnagle's group recently stated that purified lipoproteins spiked into serum were not digested with the same efficiency as their native endogen counterparts (46).
We thus believe that QC samples (in pooled plasma aliquots, in the present case) should systematically be introduced into clinical cohort investigations, as recommended by the authorities for drug evaluation. As very recently mentioned by Kuhn et al., instrumental calibration may also be involved in dramatically degraded assay performance by shifting the isolation window for both precursor and product ions (31). Hence, before each new analytical run, we always assessed instrumental performance levels (sensitivity and calibration) by monitoring the ApoE common synthetic peptide.
To the best of our knowledge, our clinical cohort was one of the largest to have been screened with MS-based protein assays. It is also important to highlight the relative high plasma concentrations of ApoE studied here, relative to the ng/ml or even sub-ng/ml values expected for the leakage of organ-specific tumor biomarkers. There is no evidence to suggest that methionine oxidization would not be quantitative for minor proteins or that it could not be combined with peptide enrichment. It is noteworthy that in proteomics, methionine oxidization has already reliably furnished relative quantification data for the discovery of candidate biomarkers of oxidative stress targets (47–49). Notwithstanding the relatively high concentration of ApoE in plasma, we believe that our present management of such a large cohort of samples unequivocally contributes to the convincing demonstrations that multiplexed SRM protein assay is of great value for clinical evaluation of candidate biomarkers.
However, whether SRM could not only serve for up-stream evaluation studies but also be a platform for clinical assays is debatable. There are two underlying questions: 1) is the testing performance and throughput achieved by SRM sufficient regarding all requirements of routine analysis and 2) is SRM a cost effective technique. The question should even be formulated differently as it is first necessary to distinguish between two types of biomarkers: those which may be directly quantified in plasma or serum without depletion and/or fractionation and those present at weak concentrations (below100 ng/ml) that required depletion and/or peptide fractionation or enrichment. For the first category of highly abundant proteins, the recent studies by Hoofnagle's group back up this point of view. This group has demonstrated a reliable clinical quantification of apoA-I and apoB using a single-point calibration method, interassay CVs < 12% and excellent correlation (r2 > 0.82) with the corresponding nephelometric immunoassays. More recently, they have rigorously compared two standardization methods based on isotope-dilution in the context of a six-plex apoliprotein assay and compared the SRM assays with established immuno-assays (50). The results showed a relatively similar performance for the two isotope-dilution standardization methods, imprecision values < 11% and strong correlations with respect to the IA results. The recent work by Lassman et al. also focused on apolipoprotein quantification by SRM using AQUA standardization and reached the same interassay performance over 2 weeks (51), with CVs better than 12% and r2 of 0.87 and 0.94 relative to immuno-turbidimetric assays for ApoB and ApoA, respectively. Note that this assay was configured in the same way as (like) ours with a UHPLC format enabling more than 100 analyses per day.
Besides precision, the robustness over weeks (or months) is another key issue, whatever the testing method, to go from a discovery or verification tool to a routine analysis method. Interestingly, the two above studies dealing with apolipoprotein quantification were performed either with micro flow or normal flow chromatography. The group of Borchers has very recently made judicious comparisons of the analytical performance of normal flow (2 mm i.d. columns) with nanoflow chromatography (52). The authors concluded with evidence of increased robustness of the normal flow system, including improved retention-time stability with a mean CV < 0.5% for normal flow against a mean CV of 6% for nanoflow. Interestingly, and contrary to the common view, they have also shown that normal flow was on average more sensitive than nanoflow.
For the category of weakly concentrated proteins, such as biomarkers leaking from tumors in the nanogram/ml plasma range, clinically relevant low limits of quantification/detection are only reached after complex peptide fractionation by SCX (24) or immuno-enriching the target compound at the protein (53) or proteotypic peptide level (54, 55). Despite possible new sources of imprecision introduced by these additional steps, still acceptable intra- and inter-laboratory CVs usually below 12% were obtained at mid-point of the linear range even after applying peptide fractionation or immuno-enrichment (28, 29, 31, 32).
Together, these studies and the present work demonstrate, from our point of view, that well standardized sample workflows (trypsin digestion of whole plasma, serum or urine without any fractionation) associated with conventional or micro-flow systems achieve the required performance for today let envisage the possibility of developing clinical multiplex SRM assays.
Concerning the second question, whatever the most sensitive and efficient testing method, its application in a clinical routine utilization will always be greatly impacted by the cost of an analysis. For the first category of highly abundant proteins compatible with high throughput analysis by UHPLC, hence optimized instrument-time, the cost of the triple quadrupole instrument can no longer be considered a limiting factor because mid-sensitivity instruments are about 150,000 $, only slightly more expensive than conventional automated testing devices. Furthermore, the global cost of all reagents and heavy standards required per SRM-based assay could be estimated at about 1 $ per testing point) and is finally low compared with consumables required for IA. At this time, it appears that for weakly abundant proteins (below 1 μg/ml), only the SISCAPA strategy would reach the required throughput and multiplexing capabilities.
The reliability of our combined quantification of total ApoE and the ApoE4 isoform is strengthened by its agreement with previous published data on nephelometric, turbidimetric, and immunoenzymatic assays. First, our SRM-based assay indicated total plasma ApoE concentrations ranging from 41 to 77 μg/ml (depending on the genotype), in line with the range of concentrations commonly reported in the literature (i.e. 25 to 75 μg/ml (5, 8–10, 44, 56–60)). This result emphasizes that when AQUA standardization is combined with simplified sample processing (and in the absence of protein fractionation, which is a major source of loss), the accurate measurement of medium-abundance plasma proteins is eminently possible. Another often-noted source of inaccuracy relates to inter-protein differences in sensitivity to trypsin hydrolysis (30); this problem may be partly circumvented by the use of isotopically enriched protein standards (61). Borcher's group classified ApoE as belonging to the rapidly digested family of plasma proteins, because 1) there were no significant differences in the digestion efficiency according to the denaturation protocol and 2) digestion was complete after 4h (42). This group estimated that the digestion yield was 100%, which supports the agreement between our SRM results and the ELISA results in the literature. Only two groups have measured significantly higher levels of circulating total ApoE in plasma (ranging from 120 to 180 μg/ml) (6, 44). Both these studies used the same ELISA kit, suggesting the presence of discrepancies in terms of detection specificity and/or inadequate standard quality.
Recent studies into the relationship between the ApoE genotype and plasma ApoE levels have evidenced higher ApoE levels in ε2 allele carriers and lower levels in ε4 allele carriers. Once again, the results of our SRM-based assay agreed well with previous findings. The reliability of the assay was also evidenced by our observation of higher concentrations of both total ApoE and the ApoE4 isoform in female subjects than in male subjects (supplemental Fig. S4).
The second important conclusion is the perfect agreement between our assays and previous findings concerning the relationship between the ApoE genotype and mean plasma ApoE level (10). Corresponding studies have indeed concluded with a higher mean level in ε2 allele carriers, next in ε3 and finally, the mean lowest level in ε4 allele carriers. This was confirmed by our observations of the influence of the genotype on total ApoE concentration in the following order ε2ε3> ε2ε4> ε3ε3> ε3ε4> ε4ε4.
The third piece of evidence proving the reliability of our SRM-based assay is the observed higher concentrations of total ApoE and the ApoE4 isoform in female subjects compared with male subjects (supplemental Fig. S4). This is in line with previous reports that showed a higher mean ApoE concentration in plasma of females older than 50, likely related to hormonal changes after menopause (62, 63).
AD risk has also been reported as being associated with ApoE promoter polymorphisms. The three main characterized polymorphisms are located before the transcription start site: an A/T transversion at nucleotide 491, a T/C transition at nucleotide 427, and a T/G transversion at nucleotide 219 (64, 65). These polymorphisms are closely related to the ApoE promoter activity. Indeed, a single A to T base substitution at nucleotide 491 caused a significant decrease in APOE promoter activity whereas a T to G substitution at nucleotide 219 provoked the opposite effect in the human cell line HepG2 (hepatoma). On the other hand, a T to C substitution at nucleotide 427 had no effect on promoter activity (64). These modulations in promoter activity have a direct impact on the ApoE concentration in plasma or in cerebrospinal fluid because higher ApoE levels have been reported in these fluids when promoter activity is enhanced (i.e. when there is no substitution at nucleotide 491 or when there is a T to G substitution at nucleotide 219) (66–69). Some studies have indicated that the presence of adenine or thymine in position 491 and 219 respectively increased risk for AD (68–75). Although we did not find any difference at the ApoE concentration level between control and AD cohorts whatever the promoter polymorphism and genotype, we confirmed however the influence of A/T transversion at nucleotide 491 on total ApoE concentration (58.0 ± 16.2 μg/ml (n = 198) versus 52.8 ± 12.3 μg/ml (n = 73)). This observation is a new and definitive illustration of the reliability of our SRM-based assay.
The exact role of apolipoprotein E protein (ApoE) in the development of AD is still not understood. Different work suggests that, besides exerting a qualitative effect on the occurrence of AD through variations in APOE ε2/ε3/ε4 coding polymorphisms, the quantitative expression of APOE may also be a key disease determinant (76, 77). Indeed, there is strong proof that ApoE isoforms modulate accumulation of toxic amyloid β (Aβ) oligomers in the brain, a decisive event in the pathogenesis of AD. For instance, in animal models expressing different human ApoE isoforms, the rate and kinetics of amyloid β oligomers are depend on the allele following the order ε4>ε3>ε2 (78–81). The same influencing order is found for brain amyloid β accumulation across cognitively normal individuals as demonstrated by imaging studies (82–85). Thus, a large body of evidence converges on a pivotal role of ApoE in the neurodegeneration process associated with a possible disruption of ApoE levels in the cerebrospinal fluid (7, 86–95). This is reinforced by the recent article by Cramer et al. who demonstrated reduced Aβ plaque area and improved cognitive functions in a mouse model of AD after treatment by bexarotene, an agonist of nuclear receptors that transcriptionally regulates ApoE expression (96). Recent and independent genome-wide association studies have identified CLU, PICALM, CR1, and BIN1 as new markers in the landscape of AD genetic determinants that account for 9, 4, 4, and 4%, respectively, in AD risk across Caucasians (77). Hence, the cause of sporadic or non-Mendelian AD is multifactorial and ApoE alone account only for 20% of the AD risk. This might explain why our results confirm other controversial associations between the variation of plasma ApoE/ApoE4 concentrations and AD. Our results show that neither absolute levels of total ApoE and ApoE4 isoform nor the concentration ratio in heterozygous ε3ε4 individuals significantly correlated to AD. We addressed this lack of consensus by leveraging the orthogonality of MS-based quantification. Furthermore, we again raise the controversial question of whether ApoE levels are of value in the diagnosis of AD.
Supplementary Material
Footnotes
* We thank Lyon 1 University, the Institut de Chimie de Lyon and the Centre National de la Recherche Scientifique for their financial assistance in purchasing the 5500 Qtrap instrument. We thank bioMérieux for providing them a temporary access to their laboratories.
 This article contains supplemental Figs. S1 to S4 and Tables S1 to S3.
1 The abbreviations used are:
- AD
- Alzheimer's disease
- ApoE
- apolipoprotein E
- ApoE4
- isoform E4 of apolipoprotein
- CV
- coefficient of variation
- ε2
- ε3, ε4, alleles 2, 3 and 4 of apolipoprotein E
- LC
- liquid chromatography
- SID
- stable isotope dilution
- SRM
- selected reaction monitoring
- UHPLC
- ultra high performance liquid chromatography.
REFERENCES
- 1. Hatters D. M., Peters-Libeu C. A., Weisgraber K. H. (2006) Apolipoprotein E structure: insights into function. Trends Biochem. Sci. 31, 445–454 [DOI] [PubMed] [Google Scholar]
- 2. Verghese P. B., Castellano J. M., Holtzman D. M. (2011) Apolipoprotein E in Alzheimer's disease and other neurological disorders. Lancet Neurol. 10, 241–252 [DOI] [PMC free article] [PubMed] [Google Scholar]
- 3. Corder E. H., Saunders A. M., Strittmatter W. J., Schmechel D. E., Gaskell P. C., Small G. W., Roses A. D., Haines J. L., Pericak-Vance M. A. (1993) Gene dose of apolipoprotein-E type-4 allele and the risk of Alzheimers-disease in late-onset families. Science 261, 921–923 [DOI] [PubMed] [Google Scholar]
- 4. Weisgraber K. H., Mahley R. W. (1996) Human apolipoprotein E: The Alzheimer's disease connection. FASEB J. 10, 1485–1494 [DOI] [PubMed] [Google Scholar]
- 5. Taddei K., Clarnette R., Gandy S. E., Martins R. N. (1997) Increased plasma apolipoprotein E (apoE) levels in Alzheimer's disease. Neurosci. Lett. 223, 29–32 [DOI] [PubMed] [Google Scholar]
- 6. Gupta V. B., Laws S. M., Villemagne V. L., Ames D., Bush A. I., Ellis K. A., Lui J. K., Masters C., Rowe C. C., Szoeke C., Taddei K., Martins R. N. (2011) Plasma apolipoprotein E and Alzheimer disease risk The AIBL study of aging. Neurology 76, 1091–1098 [DOI] [PubMed] [Google Scholar]
- 7. Lehtimaki T., Pirttila T., Mehta P. D., Wisniewski H. M., Frey H., Nikkari T. (1995) Apolipoprotein-E (Apoe) polymorphism and its influence on Apoe concentrations in the cerebrospinal-fluid in Finnish patients with Alzheimers-disease. Human Gen. 95, 39–42 [DOI] [PubMed] [Google Scholar]
- 8. Scacchi R., Gambina G., Ruggeri M., Martini M. C., Ferrari G., Silvestri M., Schiavon R., Corbo R. M. (1999) Plasma levels of apolipoprotein E and genetic markers in elderly patients with Alzheimer's disease. Neurosci. Lett. 259, 33–36 [DOI] [PubMed] [Google Scholar]
- 9. Slooter A. J. C., de Knijff P., Hofman A., Cruts M., Breteler M. M. B., Van Broeckhoven C., Havekes L. M., van Duijn C. M. (1998) Serum apolipoprotein E level is not increased in Alzheimer's disease: the Rotterdam study. Neurosci. Lett. 248, 21–24 [DOI] [PubMed] [Google Scholar]
- 10. Solfrizzi V., Panza F., Colacicco A. M., D'Introno A., Basile A. M., Capurso C., Sabba M., Mascolo E., Capurso A. (2003) Apolipoprotein E (APOE) polymorphism influences serum APOE levels in Alzheimer's disease patients and centenarians. Int. Psychogeriatrics 15, 40–41 [DOI] [PubMed] [Google Scholar]
- 11. Addona T. A., Shi X., Keshishian H., Mani D. R., Burgess M., Gillette M. A., Clauser K. R., Shen D., Lewis G. D., Farrell L. A., Fifer M. A., Sabatine M. S., Gerszten R. E., Carr S. A. (2011) A pipeline that integrates the discovery and verification of plasma protein biomarkers reveals candidate markers for cardiovascular disease. Nat. Biotechnol. 29, 635–643 [DOI] [PMC free article] [PubMed] [Google Scholar]
- 12. Anderson L., Hunter C. L. (2006) Quantitative mass spectrometric multiple reaction monitoring assays for major plasma proteins. Mol. Cell. Proteomics 5, 573–588 [DOI] [PubMed] [Google Scholar]
- 13. Domon B., Aebersold R. (2010) Options and considerations when selecting a quantitative proteomics strategy. Nat. Biotechnol. 28, 710–721 [DOI] [PubMed] [Google Scholar]
- 14. Huettenhain R., Malmstroem J., Picotti P., Aebersold R. (2009) Perspectives of targeted mass spectrometry for protein biomarker verification. Curr. Opinion Chem. Biol. 13, 518–525 [DOI] [PMC free article] [PubMed] [Google Scholar]
- 15. Lin S., Shaler T. A., Becker C. H. (2006) Quantification of intermediate-abundance proteins in serum by multiple reaction monitoring mass spectrometry in a single-quadrupole ion trap. Anal. Chem. 78, 5762–5767 [DOI] [PubMed] [Google Scholar]
- 16. Schiess R., Wollscheid B., Aebersold R. (2009) Targeted proteomic strategy for clinical biomarker discovery. Mol. Oncol. 3, 33–44 [DOI] [PMC free article] [PubMed] [Google Scholar]
- 17. Surinova S., Schiess R., Huettenhain R., Cerciello F., Wollscheid B., Aebersold R. (2011) On the development of plasma protein biomarkers. J. Proteome Res. 10, 5–16 [DOI] [PubMed] [Google Scholar]
- 18. Makawita S., Diamandis E. P. (2010) The bottleneck in the cancer biomarker pipeline and protein quantification through mass spectrometry-based approaches: current strategies for candidate verification. Clin. Chem. 56, 212–222 [DOI] [PubMed] [Google Scholar]
- 19. Rifai N., Gillette M. A., Carr S. A. (2006) Protein biomarker discovery and validation: the long and uncertain path to clinical utility. Nat. Biotechnol. 24, 971–983 [DOI] [PubMed] [Google Scholar]
- 20. Whiteaker J. R., Lin C., Kennedy J., Hou L., Trute M., Sokal I., Yan P., Schoenherr R. M., Zhao L., Voytovich U. J., Kelly Spratt K. S., Krasnoselsky A., Gafken P. R., Hogan J. M., Jones L. A., Wang P., Amon L., Chodosh L. A., Nelson P. S., McIntosh M. W., Kemp C. J., Paulovich A. G. (2011) A targeted proteomics-based pipeline for verification of biomarkers in plasma. Nat. Biotechnol. 29, 625-U108 [DOI] [PMC free article] [PubMed] [Google Scholar]
- 21. Carr S. A., Anderson L. (2008) Protein quantitation through targeted mass spectrometry: the way out of biomarker purgatory? Clin. Chem. 54, 1749–1752 [DOI] [PMC free article] [PubMed] [Google Scholar]
- 22. Paulovich A. G., Whiteaker J. R., Hoofnagle A. N., Wang P. (2008) The interface between biomarker discovery and clinical validation: The tar pit of the protein biomarker pipeline. Proteomics Clin. Appl. 2, 1386–1402 [DOI] [PMC free article] [PubMed] [Google Scholar]
- 23. Hoofnagle A. N., Becker J. O., Wener M. H., Heinecke J. W. (2008) Quantification of thyroglobulin, a low-abundance serum protein, by immunoaffinity peptide enrichment and tandem mass spectrometry. Clin. Chem. 54, 1796–1804 [DOI] [PMC free article] [PubMed] [Google Scholar]
- 24. Keshishian H., Addona T., Burgess M., Kuhn E., Carr S. A. (2007) Quantitative, multiplexed assays for low abundance proteins in plasma by targeted mass spectrometry and stable isotope dilution. Mol. Cell. Proteomics 6, 2212–2229 [DOI] [PMC free article] [PubMed] [Google Scholar]
- 25. Fortin T., Salvador A., Charrier J. P., Lenz C., Lacoux X., Morla A., Choquet-Kastylevsky G., Lemoine J. (2009) Clinical quantitation of prostate-specific antigen biomarker in the low nanogram/milliliter range by conventional bore liquid chromatography-tandem mass spectrometry (multiple reaction monitoring) coupling and correlation with ELISA tests. Mol. Cell. Proteomics 8, 1006–1015 [DOI] [PMC free article] [PubMed] [Google Scholar]
- 26. Yang Y., Qiang X., Owsiany K., Zhang S., Thannhauser T. W., Li L. (2011) Evaluation of different multidimensional LC-MS/MS pipelines for isobaric tags for relative and absolute quantitation (iTRAQ)-based proteomic analysis of potato tubers in response to cold storage. J. Proteome Res. 10, 4647–4660 [DOI] [PubMed] [Google Scholar]
- 27. Kuhn E., Addona T., Keshishian H., Burgess M., Mani D. R., Lee R. T., Sabatine M. S., Gerszten R. E., Carr S. A. (2009) Developing multiplexed assays for troponin I and interleukin-33 in plasma by peptide immunoaffinity enrichment and targeted mass spectrometry. Clin. Chem. 55, 1108–1117 [DOI] [PMC free article] [PubMed] [Google Scholar]
- 28. Prakash A., Rezai T., Krastins B., Sarracino D., Athanas M., Russo P., Ross M. M., Zhang H., Tian Y., Kulasingam V., Drabovich A. P., Smith C., Batruch I., Liotta L., Petricoin E., Diamandis E. P., Chan D. W., Lopez M. F. (2010) Platform for establishing inter laboratory reproducibility of selected reaction monitoring-based mass spectrometry peptide assays. J. Proteome Res. 9, 6678–6688 [DOI] [PubMed] [Google Scholar]
- 29. Addona T. A., Abbatiello S. E., Schilling B., Skates S. J., Mani D. R., Bunk D. M., Spiegelman C. H., Zimmerman L. J., Ham A. J. L., Keshishian H., Hall S. C., Allen S., Blackman R. K., Borchers C. H., Buck C., Cardasis H. L., Cusack M. P., Dodder N. G., Gibson B. W., Held J. M., Hiltke T., Jackson A., Johansen E. B., Kinsinger C. R., Li J., Mesri M., Neubert T. A., Niles R. K., Pulsipher T. C., Ransohoff D., Rodriguez H., Rudnick P. A., Smith D., Tabb D. L., Tegeler T. J., Variyath A. M., Vega-Montoto L. J., Wahlander A., Waldemarson S., Wang M., Whiteaker J. R., Zhao L., Anderson N. L., Fisher S. J., Liebler D. C., Paulovich A. G., Regnier F. E., Tempst P., Carr S. A. (2009) Multi-site assessment of the precision and reproducibility of multiple reaction monitoring-based measurements of proteins in plasma. Nat. Biotechnol. 27, 633-U85 [DOI] [PMC free article] [PubMed] [Google Scholar]
- 30. Keshishian H., Addona T., Burgess M., Mani D. R., Shi X., Kuhn E., Sabatine M. S., Gerszten R. E., Carr S. A. (2009) Quantification of cardiovascular biomarkers in patient plasma by targeted mass spectrometry and stable isotope dilution. Mol. Cell. Proteomics 8, 2339–2349 [DOI] [PMC free article] [PubMed] [Google Scholar]
- 31. Kuhn E., Whiteaker J. R., Mani D. R., Jackson A. M., Zhao L., Pope M. E., Smith D., Rivera K. D., Anderson N. L., Skates S. J., Pearson T. W., Paulovich A. G., Carr S. A. (2012) Inter-laboratory evaluation of automated, multiplexed peptide immunoaffinity enrichment coupled to multiple reaction monitoring mass spectrometry for quantifying proteins in plasma. Mol. Cell. Proteomics 11, M111.013854 [DOI] [PMC free article] [PubMed] [Google Scholar]
- 32. Paulovich A. G., Billheimer D., Ham A. J. L., Vega-Montoto L., Rudnick P. A., Tabb D. L., Wang P., Blackman R. K., Bunk D. M., Cardasis H. L., Clauser K. R., Kinsinger C. R., Schilling B., Tegeler T. J., Variyath A. M., Wang M., Whiteaker J. R., Zimmerman L. J., Fenyo D., Carr S. A., Fisher S. J., Gibson B. W., Mesri M., Neubert T. A., Regnier F. E., Rodriguez H., Spiegelman C., Stein S. E., Tempst P., Liebler D. C. (2010) Interlaboratory study characterizing a yeast performance standard for benchmarking LC-MS platform performance. Mol. Cell. Proteomics 9, 242–254 [DOI] [PMC free article] [PubMed] [Google Scholar]
- 33. Selevsek N., Matondo M., Sanchez, Carbayo M., Aebersold R., Domon B. (2011) Systematic quantification of peptides/proteins in urine using selected reaction monitoring. Proteomics 11, 1135–1147 [DOI] [PubMed] [Google Scholar]
- 34. Gallien S., Duriez E., Domon B. (2011) Selected reaction monitoring applied to proteomics. J. Mass Spectrom. 46, 298–312 [DOI] [PubMed] [Google Scholar]
- 35. Lange V., Picotti P., Domon B., Aebersold R. (2008) Selected reaction monitoring for quantitative proteomics: a tutorial. Mol. Syst. Biol. 4, article number 222 [DOI] [PMC free article] [PubMed] [Google Scholar]
- 36. Pan S., Aebersold R., Chen R., Rush J., Goodlett D. R., McIntosh M. W., Zhang J., Brentnall T. A. (2009) Mass spectrometry based targeted protein quantification: methods and applications. J. Proteome Res. 8, 787–797 [DOI] [PMC free article] [PubMed] [Google Scholar]
- 37. Shacter E. (2000) Quantification and significance of protein oxidation in biological samples. Drug Metab. Rev. 32, 307–326 [DOI] [PubMed] [Google Scholar]
- 38. Vogt W. (1995) Oxidation of methionyl residues in proteins - tools, targets, and reversal. Free Radical Biol. Med. 18, 93–105 [DOI] [PubMed] [Google Scholar]
- 39. Gerber S. A., Rush J., Stemman O., Kirschner M. W., Gygi S. P. (2003) Absolute quantification of proteins and phosphoproteins from cell lysates by tandem MS. Proc. Natl. Acad. Sci. U. S. A. 100, 6940–6945 [DOI] [PMC free article] [PubMed] [Google Scholar]
- 40. Huillet C., Adrait A., Lebert D., Picard G., Trauchessec M., Louwagie M., Dupuis A., Hittinger L., Ghaleh B., Le Corvoisier P., Jaquinod M., Garin J., Bruley C., Brun V. (2012) Accurate quantification of cardiovascular biomarkers in serum using Protein Standard Absolute Quantification (PSAQTM) and selected reaction monitoring. Mol. Cell. Proteomics 11, M111.008235 [DOI] [PMC free article] [PubMed] [Google Scholar]
- 41. Kuzyk M. A., Smith D., Yang J., Cross T. J., Jackson A. M., Hardie D. B., Anderson N. L., Borchers C. H. (2009) Multiple reaction monitoring-based, multiplexed, absolute quantitation of 45 proteins in human plasma. Mol. Cell. Proteomics 8, 1860–1877 [DOI] [PMC free article] [PubMed] [Google Scholar]
- 42. Proc J. L., Kuzyk M. A., Hardie D. B., Yang J., Smith D. S., Jackson A. M., Parker C. E., Borchers C. H. (2010) A quantitative study of the effects of chaotropic agents, surfactants, and solvents on the digestion efficiency of human plasma proteins by trypsin. J. Proteome Res. 9, 5422–5437 [DOI] [PMC free article] [PubMed] [Google Scholar]
- 43. Shchepin R., Moeller M. N., Kim H. Y. H., Hatch D. M., Bartesaghi S., Kalyanaraman B., Radi R., Porter N. A. (2010) Tyrosine-lipid peroxide adducts from radical termination: para coupling and intramolecular diels-alder cyclization. J. Am. Chem. Soc. 132, 17490–17500 [DOI] [PMC free article] [PubMed] [Google Scholar]
- 44. Fukumoto H., Ingelsson M., Garevik N., Wahlund L. O., Nukina N., Yaguchi Y., Shibata M., Hyman B. T., Rebeck G. W., Irizarry M. C. (2003) APOE epsilon 3/epsilon 4 heterozygotes have an elevated proportion of apolipoprotein E4 in cerebrospinal fluid relative to plasma, independent of Alzheimer's disease diagnosis. Exp. Neurol. 183, 249–253 [DOI] [PubMed] [Google Scholar]
- 45. Wildsmith K. R., Han B., Bateman R. J. (2009) Method for the simultaneous quantitation of apolipoprotein E isoforms using tandem mass spectrometry. Anal. Biochem. 395, 116–118 [DOI] [PMC free article] [PubMed] [Google Scholar]
- 46. Agger S. A., Marney L. C., Hoofnagle A. N. (2010) Simultaneous quantification of apolipoprotein A-I and apolipoprotein B by liquid-chromatography-multiple-reaction-monitoring mass spectrometry. Clin. Chem. 56, 1804–1813 [DOI] [PMC free article] [PubMed] [Google Scholar]
- 47. Ghesquiere B., Jonckheere V., Colaert N., Van Durme J., Timmerman E., Goethals M., Schymkowitz J., Rousseau F., Vandekerckhove J., Gevaert K. (2011) Redox proteomics of protein-bound methionine oxidation. Mol. Cell. Proteomics 10, M110.006866 [DOI] [PMC free article] [PubMed] [Google Scholar]
- 48. Gevaert K., Pinxteren J., Demol H., Hugelier K., Staes A., Van Damme J., Martens L., Vandekerckhove J. (2006) Four stage liquid chromatographic selection of methionyl peptides for peptide-centric proteome analysis: The proteome of human multipotent adult progenitor cells. J. Proteome Res. 5, 1415–1428 [DOI] [PubMed] [Google Scholar]
- 49. Gevaert K., Van Damme J., Goethals M., Thomas G. R., Hoorelbeke B., Demol H., Martens L., Puype M., Staes A., Vandekerckhove J. (2002) Chromatographic isolation of methionine-containing peptides for gel-free proteome analysis - Identification of more than 800 Escherichia coli proteins. Mol. Cell. Proteomics 1, 896–903 [DOI] [PubMed] [Google Scholar]
- 50. Hoofnagle A. N., Becker J. O., Oda M. N., Cavigiolio G., Mayer P., Vaisar T. (2012) Multiple-reaction monitoring-mass spectrometric assays can accurately measure the relative protein abundance in complex mixtures. Clin. Chem. 58, 777–781 [DOI] [PMC free article] [PubMed] [Google Scholar]
- 51. Lassman M. E., McLaughlin T. M., Somers E. P., Stefanni A. C., Chen Z., Murphy B. A., Bierilo K. K., Flattery A. M., Wong K. K., Castro-Perez J. M., Hubbard B. K., Roddy T. P. (2012) A rapid method for cross-species quantitation of apolipoproteins A1, B48 and B100 in plasma by ultra-performance liquid chromatography/tandem mass spectrometry. Rapid Commun. Mass Spectrom. 26, 101–108 [DOI] [PubMed] [Google Scholar]
- 52. Percy A. J., Chambers A. G., Yang J., Domanski D., Borchers C. H. (2012) Comparison of standard- and nano-flow liquid chromatography platforms for MRM-based quantitation of putative plasma biomarker proteins. Anal. Bioanal. Chem. DOI 10.1007/s00216-012-6010 [DOI] [PubMed] [Google Scholar]
- 53. Trenchevska O., Kamcheva E., Nedelkov D. (2011) Mass spectrometric immunoassay for quantitative determination of transthyretin and its variants. Proteomics 11, 3633–3641 [DOI] [PMC free article] [PubMed] [Google Scholar]
- 54. Anderson N. L., Anderson N. G., Haines L. R., Hardie D. B., Olafson R. W., Pearson T. W. (2004) Mass spectrometric quantitation of peptides and proteins using stable isotope standards and capture by anti-peptide antibodies (SISCAPA). J. Proteome Res. 3, 235–244 [DOI] [PubMed] [Google Scholar]
- 55. Whiteaker J. R., Zhao L., Abbatiello S. E., Burgess M., Kuhn E., Lin C., Pope M. E., Razavi M., Anderson N. L., Pearson T. W., Carr S. A., Paulovich A. G. (2011) Evaluation of large scale quantitative proteomic assay development using peptide affinity-based mass spectrometry. Mol. Cell. Proteomics 10, M110.005645 [DOI] [PMC free article] [PubMed] [Google Scholar]
- 56. Beekman M., Heijmans B. T., Martin N. G., Pedersen N. L., Whitfield J. B., DeFaire U., van Baal G. C. M., Snieder H., Vogler G. P., Slagboom P. E., Boomsma D. I. (2002) Heritabilities of apolipoprotein and lipid levels in three countries. Twin Res. 5, 87–97 [DOI] [PubMed] [Google Scholar]
- 57. Riddell D. R., Zhou H., Atchison K., Warwick H. K., Atkinson P. J., Jefferson J., Xu L., Aschmies S., Kirksey Y., Hu Y., Wagner E., Parratt A., Xu J., Li Z., Zaleska M. M., Jacobsen J. S., Pangalos M. N., Reinhart P. H. (2008) Impact of apolipoprotein E (ApoE) polymorphism on brain ApoE levels. J. Neurosci. 28, 11445–11453 [DOI] [PMC free article] [PubMed] [Google Scholar]
- 58. Beekman M., Posthuma D., Heijmans B. T., Lakenberg N., Suchiman H. E. D., Snieder H., de Knijff P., Frants R. R., van Ommen G. J. B., Kluft C., Vogler G. P., Slagboom P. E., Boomsma D. I. (2004) Combined association and linkage analysis applied to the APOE locus. Genetic Epidemiol. 26, 328–337 [DOI] [PubMed] [Google Scholar]
- 59. Uchida Y., Ito S., Nukina N. (2000) Sandwich ELISA for the measurement of Apo-E4 levels in serum and the estimation of the allelic status of Apo-E4 isoforms. J. Clin. Lab. Anal. 14, 260–264 [DOI] [PMC free article] [PubMed] [Google Scholar]
- 60. Bohnet K., Pillot T., Visvikis S., Sabolovic N., Siest G. (1996) Apolipoprotein (apo) E genotype and apoE concentration determine binding of normal very low density lipoproteins to HepG2 cell surface receptors. J. Lipid Res. 37, 1316–1324 [PubMed] [Google Scholar]
- 61. Brun V., Dupuis A., Adrait A., Marcellin M., Thomas D., Court M., Vandenesch F., Garin J. (2007) Isotope-labeled protein standards. Mol. Cell. Proteomics 6, 2139–2149 [DOI] [PubMed] [Google Scholar]
- 62. Haddy N., De Bacquer D., Chemaly M. M., Maurice M., Ehnholm C., Evans A., Sans S., Martins M. D., De Backer G., Siest G., Visvikis S. (2002) The importance of plasma concentration in addition apolipoprotein E to its common polymorphism on inter-individual variation in lipid levels: results from Apo Europe. Eur. J. Human Gen. 10, 841–850 [DOI] [PubMed] [Google Scholar]
- 63. Schiele F., De Bacquer D., Vincent-Viry M., Beisiegel U., Ehnholm C., Evans A., Kafatos A., Martins M. C., Sans S., Sass C., Visvikis S., De Backer G., Siest G. (2000) Apolipoprotein E serum concentration and polymorphism in six European countries: the ApoEurope Project. Atherosclerosis 152, 475–488 [DOI] [PubMed] [Google Scholar]
- 64. Artiga M. J., Bullido M. J., Sastre I., Recuero M., Garcia M. A., Aldudo J., Vazquez J., Valdivieso F. (1998) Allelic polymorphisms in the transcriptional regulatory region of apolipoprotein E gene. Febs Letts. 421, 105–108 [DOI] [PubMed] [Google Scholar]
- 65. Bekris L. M., Millard S. P., Galloway N. M., Vuletic S., Albers J. J., Lie G., Galasko D. R., DeCarli C., Farlow M. R., Clark C. M., Quinn J. F., Kaye J. A., Schellenberg G. D., Tsuang D., Peskind E. R., Yu C. E., Multiple SN. (2008) Ps within and surrounding the apolipoprotein E gene influence cerebrospinal fluid apolipoprotein E protein levels. J. Alzheimers Dis. 13, 255–266 [DOI] [PMC free article] [PubMed] [Google Scholar]
- 66. Lambert J. C., Berr C., Pasquier F., Delacourte A., Frigard B., Cottel D., Perez-Tur J., Mouroux V., Mohr M., Cecyre D., Galasko D., Lendon C., Poirier J., Hardy J., Mann D., Amouyel P., Chartier-Harlin M. C. (1998) Pronounced impact of Th1/E47cs mutation compared with −491 AT mutation on neural APOE gene expression and risk of developing Alzheimer's disease. Human Mol. Gen. 7, 1511–1516 [DOI] [PubMed] [Google Scholar]
- 67. Lambert J. C., Brousseau T., Defosse V., Evans A., Arveiler D., Ruidavets J. B., Haas B., Cambou J. P., Luc G., Ducimetiere P., Cambien F., Chartier-Harlin M. C., Amouyel P. (2000) Independent association of an APOE gene promoter polymorphism with increased risk of myocardial infarction and decreased APOE plasma concentrations - the ECTIM Study. Human Mol. Gen. 9, 57–61 [DOI] [PubMed] [Google Scholar]
- 68. Laws S. M., Hone E., Taddei K., Harper C., Dean B., McClean C., Masters C., Lautenschlager N., Gandy S. E., Martins R. N. (2002) Variation at the APOE-491 promoter locus is associated with altered brain levels of apolipoprotein E. Mol. Psychiatry 7, 886–890 [DOI] [PubMed] [Google Scholar]
- 69. Laws S. M., Taddei K., Martins G., Paton A., Fisher C., Clarnette R., Hallmayer J., Brooks W. S., Gandy S. E., Martins R. N. (1999) The −491AA polymorphism in the APOE gene is associated with increased plasma apoE levels in Alzheimer's disease. Neuroreport 10, 879–882 [DOI] [PubMed] [Google Scholar]
- 70. Bullido M. J., Artiga M. J., Recuero M., Sastre I., Garcia M. A., Aldudo J., Lendon C., Han S. W., Morris J. C., Frank A., Vazquez J., Goate A., Valdivieso F. (1998) A polymorphism in the regulatory region of APOE associated with risk for Alzheimer's dementia. Nat. Gen. 18, 69–71 [DOI] [PubMed] [Google Scholar]
- 71. Parker G. R., Cathcart H. M., Huang R., Lanham I. S., Corder E. H., Poduslo S. E. (2005) Apolipoprotein gene E4 allele promoter polymorphisms as risk factors for Alzheimer's disease. Psychiatric Gen. 15, 271–275 [DOI] [PubMed] [Google Scholar]
- 72. Ramos M. C., Matias S., Artiga M. J., Pozueta J., Sastre I., Valdivieso F., Bullido M. J. (2005) Neuronal specific regulatory elements in apolipoprotein E gene proximal promoter. Neuroreport 16, 1027–1030 [DOI] [PubMed] [Google Scholar]
- 73. Town T., Paris D., Fallin D., Duara R., Barker W., Gold M., Crawford F., Mullan M. (1998) The −491A/T apolipoprotein E promoter polymorphism association with Alzheimer's disease: independent risk and linkage disequilibrium with the known APOE polymorphism. Neurosci. Lett. 252, 95–98 [DOI] [PubMed] [Google Scholar]
- 74. Wang J. C., Kwon J. M., Shah P., Morris J. C., Goate A.: (2000) Effect of APOE genotype and promoter polymorphism on risk of Alzheimer's disease. Neurology 55, 1644–1649 [DOI] [PubMed] [Google Scholar]
- 75. Yu C. E., Seltman H., Peskind E. R., Galloway N., Zhou P. X., Rosenthal E., Wijsman E. M., Tsuang D. W., Devlin B., Schellenberg G. D. (2007) Comprehensive analysis of APOE and selected proximate markers for late-onset Alzheimer's disease: Patterns of linkage disequilibrium and disease/marker association. Genomics 89, 655–665 [DOI] [PMC free article] [PubMed] [Google Scholar]
- 76. Lambert J. C., Amouyel P. (2007) Genetic heterogeneity of Alzheimer's disease: Complexity and advances. Psychoneuroendocrinology 32, S62–S70 [DOI] [PubMed] [Google Scholar]
- 77. Lambert J. C., Amouyel P. (2011) Genetics of Alzheimer's disease: new evidences for an old hypothesis? Curr. Opinion Gen. Develop. 21, 295–301 [DOI] [PubMed] [Google Scholar]
- 78. Bales K. R., Liu F., Wu S., Lin S., Koger D., DeLong C., Hansen J. C., Sullivan P. M., Paul S. M. (2009) Human APOE isoform-dependent effects on brain beta-amyloid levels in PDAPP transgenic mice. J. Neurosci. 29, 6771–6779 [DOI] [PMC free article] [PubMed] [Google Scholar]
- 79. Fryer J. D., Simmons K., Parsadanian M., Bales K. R., Paul S. M., Sullivan P. M., Holtzman D. M. (2005) Human apolipoprotein E4 alters the amyloid-beta 40 : 42 ratio and promotes the formation of cerebral amyloid angiopathy in an amyloid precursor protein transgenic model. J. Neurosci. 25, 2803–2810 [DOI] [PMC free article] [PubMed] [Google Scholar]
- 80. Fagan A. M., Watson M., Parsadanian M., Bales K. R., Paul S. M., Holtzman D. M. (2002) Human and murine ApoE markedly alters A beta metabolism before and after plaque formation in a mouse model of Alzheimer's disease. Neurobiol. Disease 9, 305–318 [DOI] [PubMed] [Google Scholar]
- 81. Holtzman D. M., Bales K. R., Tenkova T., Fagan A. M., Parsadanian M., Sartorius L. J., Mackey B., Olney J., McKeel D., Wozniak D., Paul S. M. (2000) Apolipoprotein E isoform-dependent amyloid deposition and neuritic degeneration in a mouse model of Alzheimer's disease. Proc. Natl. Acad. Sci. U. S. A. 97, 2892–2897 [DOI] [PMC free article] [PubMed] [Google Scholar]
- 82. Chiang . G. C., Insel P. S., Tosun D., Schuff N., Truran-Sacrey D., Raptentsetsang S. T., Jack C. R., Jr., Aisen P. S., Petersen R. C., Weiner M. W. (2010) Hippocampal atrophy rates and CSF biomarkers in elderly APOE2 normal subjects. Neurology 75, 1976–1981 [DOI] [PMC free article] [PubMed] [Google Scholar]
- 83. Morris J. C., Roe C. M., Xiong C., Fagan A. M., Goate A. M., Holtzman D. M., Mintun M. A. (2010) APOE Predicts Amyloid-Beta but Not Tau Alzheimer Pathology in Cognitively Normal Aging. Ann. Neurol. 67, 122–131 [DOI] [PMC free article] [PubMed] [Google Scholar]
- 84. Reiman E. M., Chen K., Liu X., Bandy D., Yu M., Lee W., Ayutyanont N., Keppler J., Reeder S. A., Langbaum J. B. S., Alexander G. E., Klunk W. E., Mathis C. A., Price J. C., Aizenstein H. J., DeKosky S. T., Caselli R. J. (2009) Fibrillar amyloid-beta burden in cognitively normal people at 3 levels of genetic risk for Alzheimer's disease. Proc. Natl. Acad. Sci. U. S. A. 106, 6820–6825 [DOI] [PMC free article] [PubMed] [Google Scholar]
- 85. Sunderland T., Mirza N., Putnam K. T., Linker G., Bhupali D., Durham R., Soares H., Kimmel L., Friedman D., Bergeson J., Csako G., Levy J. A., Bartko J. J., Cohen R. M.: (2004) Cerebrospinal fluid beta-amyloid(1–42) and tau in control subjects at risk for Alzheimer's disease: The effect of APOE epsilon 4 allele. Biol. Psychiatry 56, 670–676 [DOI] [PubMed] [Google Scholar]
- 86. Blennow K., Hesse C., Fredman P. (1994) Cerebrospinal-fluid apolipoprotein-E is reduced in Alzheimers-disease. Neuroreport 5, 2534–2536 [DOI] [PubMed] [Google Scholar]
- 87. Carlsson J., Armstrong V. W., Reiber H., Felgenhauer K., Seidel D. (1991) Clinical Relevance of the Quantification of Apolipoprotein-E in Cerebrospinal-Fluid. Clin. Chim. Acta 196, 167–176 [DOI] [PubMed] [Google Scholar]
- 88. Fukuyama R., Mizuno T., Mori S., Yanagisawa K., Nakajima K., Fushiki S. (2000) Age-dependent decline in the apolipoprotein e level in cerebrospinal fluid from control subjects and its increase in cerebrospinal fluid from patients with Alzheimer's disease. Eur. Neurol. 43, 161–169 [DOI] [PubMed] [Google Scholar]
- 89. Hesse C., Larsson H., Fredman P., Minthon L., Andreason N., Davidsson P., Blennow K. (2000) Measurement of apolipoprotein E (apoE) in cerebrospinal fluid. Neurochem. Res. 25, 511–517 [DOI] [PubMed] [Google Scholar]
- 90. Kunicki S., Richardson J., Mehta P. D., Kim K. S., Zorychta E. (1998) The effects of age, apolipoprotein E phenotype and gender on the concentration of amyloid-beta (A beta) 40, A beta 42, apolipoprotein E and transthyretin in human cerebrospinal fluid. Clin. Biochem. 31, 409–415 [DOI] [PubMed] [Google Scholar]
- 91. Landen M., Hesse C., Fredman P., Regland B., Wallin A., Blennow K. (1996) Apolipoprotein E in cerebrospinal fluid from patients with Alzheimer's disease and other forms of dementia is reduced but without any correlation to the apoE4 isoform. Dementia 7, 273–278 [DOI] [PubMed] [Google Scholar]
- 92. Lefranc D., Vermersch P., Dallongeville J., DaemsMonpeurt C., Petit H., Delacourte A. (1996) Relevance of the quantification of apolipoprotein E in the cerebrospinal fluid in Alzheimer's disease. Neurosci. Letts. 212, 91–94 [DOI] [PubMed] [Google Scholar]
- 93. Rosler N., Wichart I., Bancher C., Jellinger K. A. (1996) Tau protein and apolipoprotein E in CSF diagnostics of Alzheimer's disease: Impact on non-Alzheimer's dementia? J. Neural Trans. Supplement 49, 259–266 [DOI] [PubMed] [Google Scholar]
- 94. Skoog I., Hesser C., Fredman P., Andreasson L. A., Palmertz B., Blennow K. (1997) Apolipoprotein E in cerebrospinal fluid in 85-year-old subjects - Relation to dementia, apolipoprotein E polymorphism, cerebral atrophy, and white matter lesions. Arch. Neurol. 54, 267–272 [DOI] [PubMed] [Google Scholar]
- 95. Song H., Saito K., Seishima M., Noma A., Urakami K., Nakashima K. (1997) Cerebrospinal fluid apo E and apo A-I concentrations in early and late-onset Alzheimer's disease. Neurosci. Letts. 231, 175–178 [DOI] [PubMed] [Google Scholar]
- 96. Cramer P. E., Cirrito J. R., Wesson D. W., Lee C. Y. D., Karlo J. C., Zinn A. E., Casali B. T., Restivo J. L., Goebel W. D., James M. J., Brunden K. R., Wilson D. A., Landreth G. E. (2012) ApoE-Directed Therapeutics Rapidly Clear beta-Amyloid and Reverse Deficits in AD Mouse Models. Science 335, 1503–1506 [DOI] [PMC free article] [PubMed] [Google Scholar]
Associated Data
This section collects any data citations, data availability statements, or supplementary materials included in this article.