Abstract
An improved understanding of the biological and numerical properties of measures of population differentiation across loci is becoming increasingly more important because of their growing use in analyzing genome-wide polymorphism data for detecting population structures, inferring the rates of migration, and identifying local adaptations. In a genome-wide analysis, we discovered that the estimates of population differentiation (e.g., FST, θ, and Jost’s D) calculated for human single-nucleotide polymorphisms (SNPs) are strongly and positively correlated to the position-specific evolutionary rates measured from multispecies alignments. That is, genomic positions (loci) experiencing higher purifying selection (lower evolutionary rates) produce lower values for the degree of population differentiation than those evolving with faster rates. We show that this pattern is completely mediated by the negative effects of purifying selection on the minor allele frequency (MAF) at individual loci. Our results suggest that inferences and methods relying on the comparison of population differentiation estimates (FST, θ, and Jost’s D) based on SNPs across genomic positions should be restricted to loci with similar MAFs and/or the rates of evolution in genome scale surveys.
Keywords: FST, minor allele frequency, population differentiation, purifying selection, evolutionary rate
Wright’s (1943, 1949) FST is widely used by biologists interested in examining population structures and estimating the rates of gene flow between populations. To measure population differentiation, genetic variation (heterozygosity) in the total population is partitioned into within- and between-subpopulation components, and FST is the relative size of the latter. Theoretically, FST is the excess inbreeding caused by population structure or the normalized variance of allele frequencies over subpopulations (Wright 1949). Practically, it is computed by the partitioning of genetic variation (Nei 1973). We were interested in examining whether the level of purifying selection has a substantial effect on the estimated values of genetic differentiation across the genome, because many investigators directly compare these estimates for thousands of single-nucleotide polymorphisms (SNPs) (e.g., Akey et al. 2002; Izagirre et al. 2006; Lohmueller et al. 2006; Ryan et al. 2006; Norton et al. 2007; Barreiro et al. 2008; Amato et al. 2009; Pickrell et al. 2009). Also, investigators frequently use genome variation at loci presumably under no selection to generate the same null distribution for all candidate nonsynonymous SNPs (nSNPs) to find those exhibiting adaptive signatures. However, candidate nSNPs occurring at functionally important positions frequently evolve with vastly different rates of evolution, which would make the use of the same null distribution inappropriate if the purifying selection modulates the FST estimates in specific ways (Anderson et al. 2005; Lohmueller et al. 2006; Izagirre et al. 2006; Norton et al. 2007).
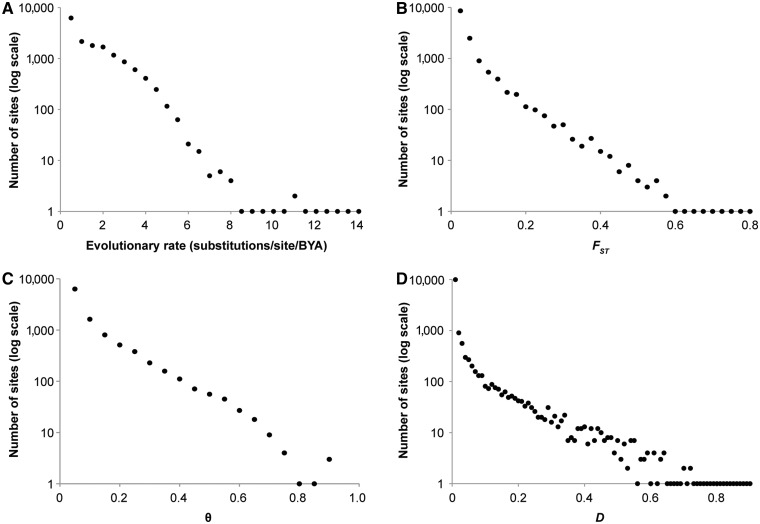
To examine the relationship between the intensity of purifying selection and the estimates of genetic differentiation, we analyzed population differentiation between African American (AA) and European American (EA) samples at 15,432 nucleotide positions (loci) harboring nSNPs in 6,494 genes (Lohmueller et al. 2008). Under the assumption that the long-term evolutionary rate is mainly determined by functional constraint, the evolutionary rate provides a measure of the site-specific strength of purifying selection. These loci show a wide range of differences in evolutionary rates and, thus, the intensity of purifying selection (fig. 1A). We also estimated FST (Wright 1949), θ (Weir and Cockerham 1984), and Jost’s D (Jost 2008) to measure population differentiation between AA and EA samples at each position (locus). These estimates also vary widely among nSNP loci (fig. 1B–D).
Fig. 1.
Distributions of evolutionary rates (A) harboring nonsynonymous SNPs (nSNPs) and the estimates of population differentiation: FST (B), θ (C), and Jost’s D (D). The numbers of positions containing nSNPs are plotted against the average parameter estimates in equally spaced bins of evolutionary rates (A) or population differentiation estimates (B–D). Evolutionary rates are in the units of substitutions per site per billion years.
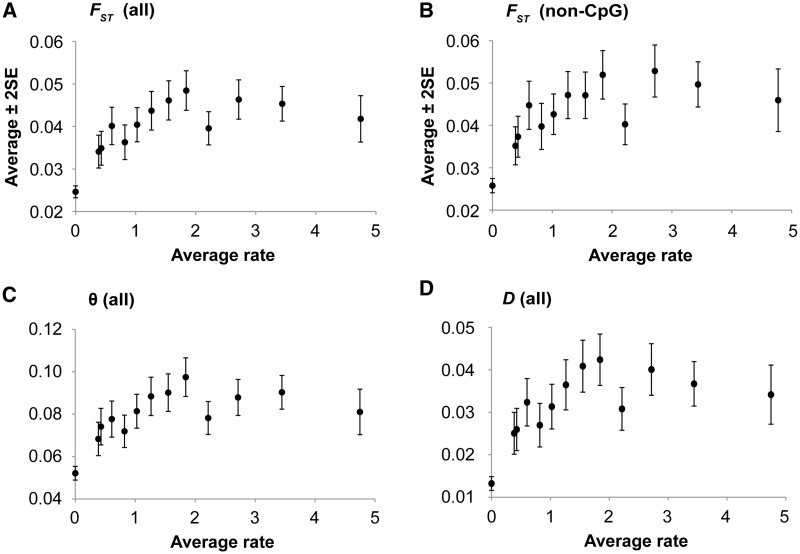
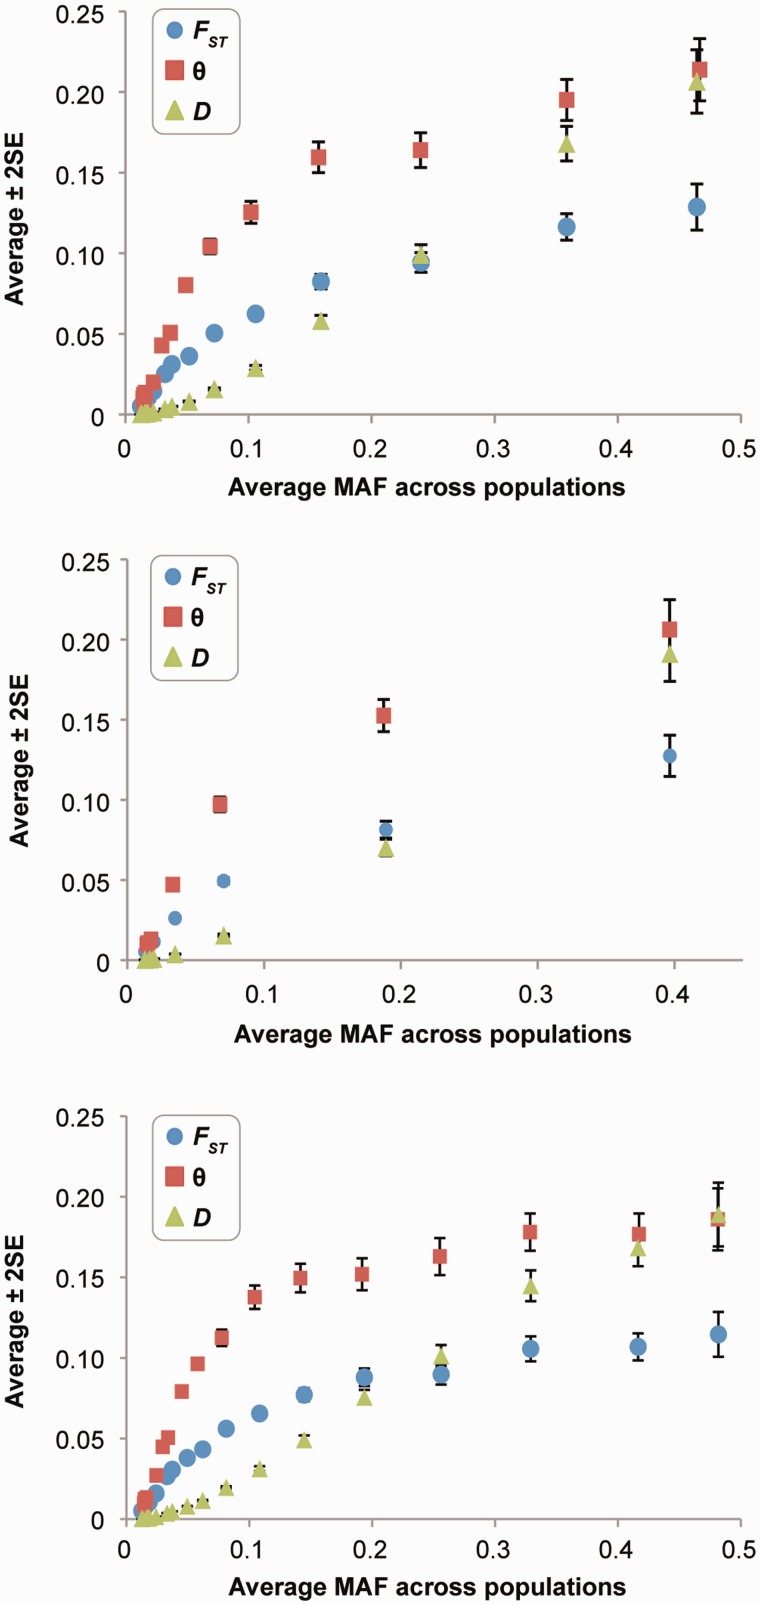
We observed a highly significant positive correlation between evolutionary rates and FST, θ, and Jost’s D (P < 10−15; fig. 2A, C, and D). That is, positions experiencing stronger negative (purifying) selection exhibit less genetic differentiation between populations. The correlation remained highly significant even when nSNPs found in putatively hypermutable (CpG) sites were excluded from the analysis (P < 10−15; fig. 2B). Because allele frequencies are known to be lower at positions under stronger purifying selection (Subramanian and Kumar 2006), we examined the relationship between population differentiation estimates and minor allele frequencies (MAFs). They are also highly positively correlated (fig. 3A; P < 10−15). We also examined the correlation between evolutionary rates and population differentiation measures after randomly selecting only one SNP per protein to minimize the confounding effect that linkage may introduce (e.g., Lohmueller et al. 2011). The positive correlation remained highly significant (fig. 3B; P < 10−13).
Fig. 2.
The relationship between evolutionary rates (r) and population differentiation estimates at nonsynonymous SNP (nSNP) sites. Each point shows average estimate of population differentiation for 1,000 nSNPs in nonoverlapping sliding windows with nSNPs sorted by r. All nSNPs occurring at positions with r = 0 were pooled together, so were the nSNPs with the highest r left in the last sliding window. (A, C, and D) show the relationships for all nSNPs, and (B) shows the relationship after excluding all the CpG positions. The patterns of θ and D at non-CpG sites are similar to those at all sites. The correlation coefficients of the underlying raw data (and sliding windows in A, C, and D) are 0.11 (0.59), 0.10 (0.54), and 0.10 (0.56) for FST, θ, and D, respectively. They are all significant at P < 10−15.
Fig. 3.
The relationship between minor allele frequency (MAF) and population differentiation estimates for nonsynonymous SNPs (nSNPs). Each point shows the average estimate (± two standard errors) in nonoverlapping sliding windows sorted by MAF of 1,000 SNPs, except for positions with the highest MAF. For nSNPs, (A) shows the relationship from all loci. The correlation coefficients of the raw data (sliding window) are 0.60 (0.95), 0.58 (0.91), and 0.71 (1.00) for FST, θ, and D, respectively. They are all significant at P < 10−15. In (B), the relationship in (A) is restricted to including one nSNP from each protein to avoid linkage effects. In (C), the relationship is shown for synonymous SNPs. In this panel, the correlation coefficients between MAF and FST, θ, and D are 0.53 (0.92), 0.52 (0.86), and 0.67 (1.00), respectively, which are all significant at P < 10−15.
We carried out a partial correlation analysis to evaluate the degree to which MAF mediates the relationship between evolutionary rate and FST, θ, and Jost’s D. Interestingly, the positive correlations between evolutionary rate and population differentiation measures disappear (P > 0.34 for FST). Consistent with this observation, we found a strong positive correlation between MAF and population differentiation measures for synonymous SNPs, which are not expected to be under strong purifying selection in mammals (fig. 3C). Therefore, the relationships between purifying selection and population differentiation estimates at SNP loci are primarily mediated by MAF.
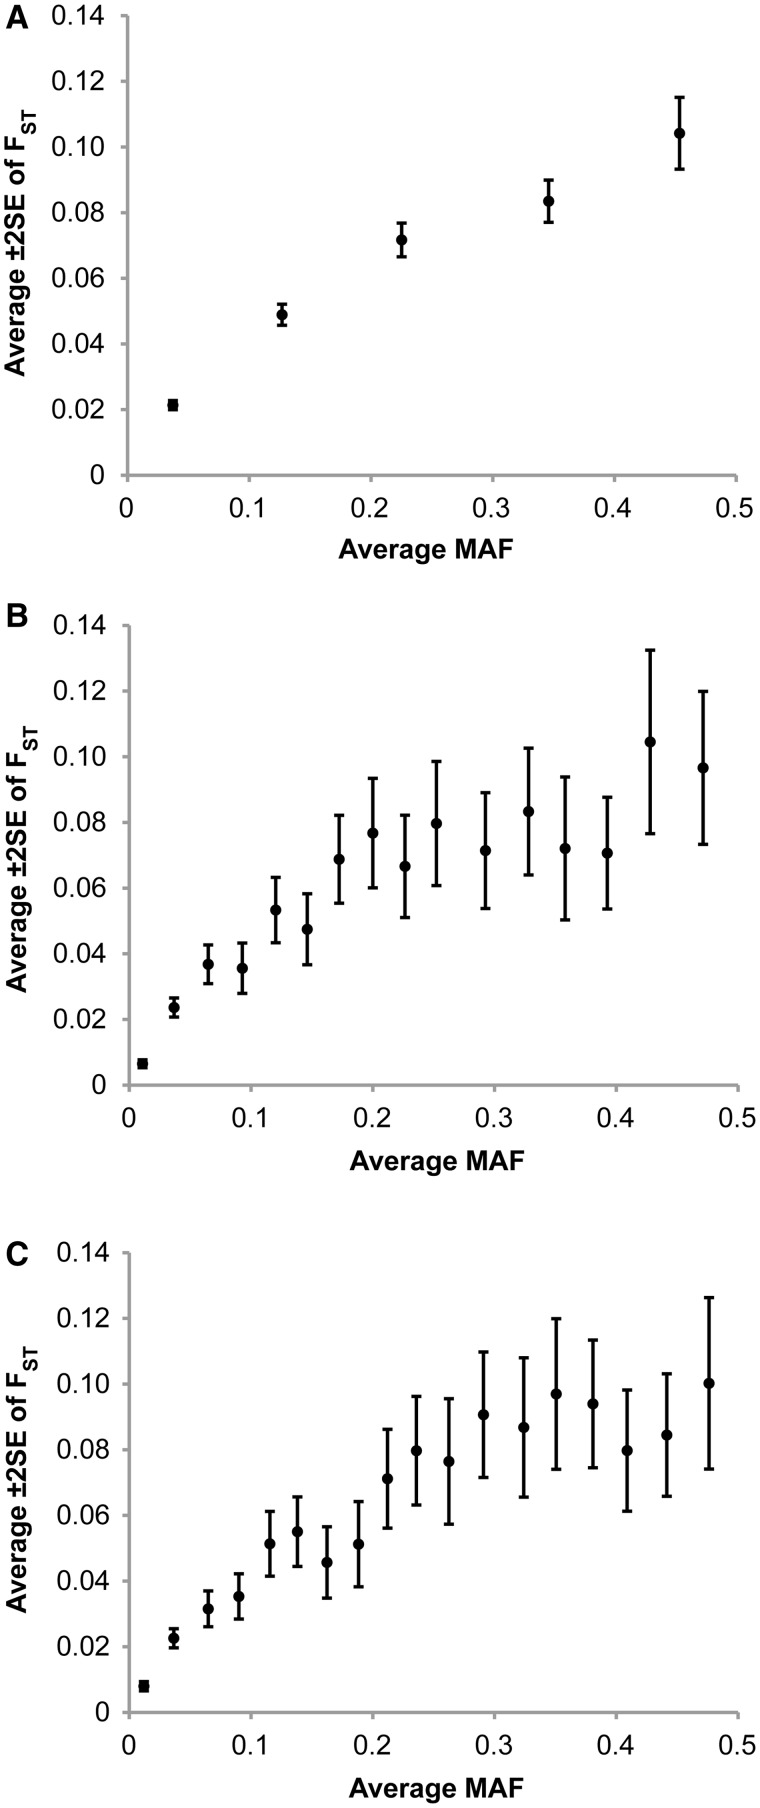
To examine the generality of this finding beyond the protein coding regions, we examined the relationship of MAF and FST for SNPs that occur in nonexonic regions. We analyzed SNPs reported in 10 ENCODE regions and found trends that are comparable to those observed for exonic SNPs (fig. 4A). This relationship also holds when data are restricted to SNPs in the intronic regions only (fig. 4B) or to the intergenic regions (fig. 4C). This generalizes our conclusion about the dependence of population differentiation measures on MAF to SNPs throughout the genome.
Fig. 4.
The relationship between minor allele frequency (MAF) and FST for nonexonic SNPs in the HapMap ENCODE regions. Each point shows the average FST (± two standard errors) in nonoverlapping sliding windows of SNPs sorted according to their MAF (1,000 SNPs per window in A and 100 in B and C). Panel (A) shows the relationship for all 4,729 nonexonic SNPs, and (B and C) show the relationship for 1,661 intronic and 1,840 intergenic SNPs, respectively.
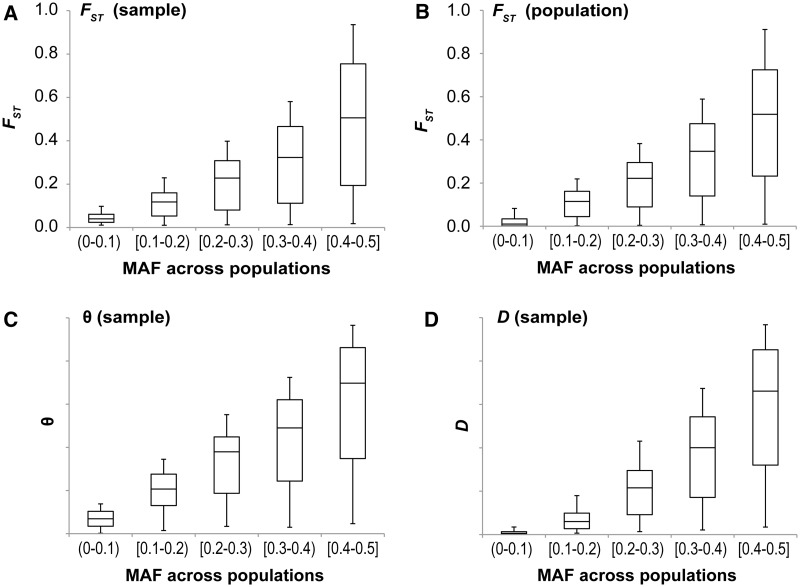
We also used computer simulations to investigate whether the dependence of population differentiation measures on MAF is a fundamental property at positions with biallelic polymorphism. In our computer simulations, each variant evolved without any selection or linkage. In an analysis of simulated samples of 30 sequences per deme obtained in a subdivided population under (strictly) neutral evolution, we confirmed the observed trends (fig. 5A, C, and D) (see also, Barreiro et al. 2008; Myles et al. 2008; Wu and Zhang 2011). The same pattern is seen when population differentiation measures are calculated from population frequencies, showing that the observed relationship is not caused by use of a small sample of 30 sequences (fig. 5B).
Fig. 5.
Results from computer-simulated data showing the relationship between minor allele frequency (MAF) and population differentiation measures calculated from sample allele frequencies (A, C, and D) and population allele frequencies (B). The first and third quartiles are shown as the lower and upper edges of each box, respectively. The median is shown as the horizontal line dividing the box. The whiskers stop at 5th and 95th percentiles. The parameter values used: N = 104, u = 5.10−6, m = 10−5, and t = 0. The correlation coefficients of the raw data (and sliding windows sorted by MAF of 10,000 sites) in (A–D) are 0.70 (0.98), 0.75 (0.99), 0.73 (1.00), and 0.79 (0.98), which are all significant at P < 10−15. Very similar distribution is obtained for the whole-population θ and D.
Our finding of highly significant positive correlation between MAF (thus the level of polymorphism) with population differentiation measures is surprising because previous investigators have reported an opposite trend for microsatellite loci, where a high degree of polymorphism was found to yield low values of FST (Hedrick 1999, 2005; Jost 2007, 2008). In fact, the dependence of the upper range of FST on the amount of genetic variation was recognized early on by many (Nei 1973; Charlesworth 1998; Long and Kittles 2009), who implicitly or explicitly pointed out the decreasing maximum possible value of FST with increasing heterozygosity at high-diversity loci. In contrast, the application of FST to low-diversity loci is thought to be without such problems (Meirmans and Hedrick 2011; Whitlock 2011), which is contrary to our finding for SNPs. To further investigate this result, we examined the relationship of FST and allele frequencies analytically. FST at a biallelic locus in a population divided into two demes is given as follows:
| (1) |
Where  ,
,  , and p1 and p2 are the frequencies of an allele in subpopulations 1 and 2, respectively (Nei 1977). If p1 and p2 are frequencies of the rarer allele of the total population,
  is the MAF. Then, it can be shown that the maximum possible FST for given M, which is reached when
  and
and  or
or  and
and  is
is
| (2) |
which is a monotonically increasing function of M. Therefore, only a small value of FST can be obtained from a polymorphic site with low MAF, whereas scientists generally assume that FST ranges from 0 to 1. This indicates that the partitioning of HT into HS and HB = HT – HS is problematic when the heterozygosity at the locus is very low. As MAF decreases, the overall heterozygosity in the total population decreases. However, HB decreases much faster than HS as the former is given by second-order terms of p1 and p2 and the latter by approximately first-order terms. This analysis suggests that the correlation of FST with MAF (thus selective constraint) is simply attributable to its mathematical structure.
Our results suggest that interpreting and comparing results from population genomic studies now should consider this dependence of FST on the frequency of the allele and the functional importance (evolutionary rate) of the position. For example, estimates of FST at sites on the Y chromosome and at sites in the mitochondrial genome are sometimes compared to detect the difference in male versus female migration rates (e.g., Seielstad et al. 1998). In such examinations, we now need to compare FST at sites with similar MAF across populations to detect the difference in migration rates. It is also important when we compare FST at sites among different populations. For example, African populations are known to have higher MAF across populations than non-African populations (Tishkoff and Kidd 2004). Without consideration of MAF before comparing FST estimates at different positions in the two may lead to incorrect inference of higher degree of population differentiation among one set of populations, when compared with the other set of populations.
Furthermore, many studies have examined the distribution of FST calculated for genome-wide SNPs in efforts to discover loci under natural selection (Akey et al. 2002; Izagirre et al. 2006; Lohmueller et al. 2006; Norton et al. 2007; Myles et al. 2008; Pickrell et al. 2009). These studies rely on the principle that an allele involved in local adaptation is likely to show a larger difference in allele frequencies between populations than is expected under the genetic drift-migration balance (Lewontin and Krakauer 1973). Therefore, an outlier of FST is discovered as a (strong) candidate of locus under selection. However, the results presented here suggest that false (negative or positive) detection of FST outliers is likely if the dependence of FST on MAF is not taken into account. For example, if one uses the cutoff of 0.6 for detecting FST outliers between two subpopulations, only SNPs with MAF > 0.375 can be discovered as outliers. Given that the majority of SNPs exhibit much lower MAFs (fig. 3), this cutoff will lead to failure of detecting a large number of SNPs that are maximally differentiated given their MAFs. Such a problem is particularly important for populations with clear geographic structures, as the upper bounds of FST are limited by low MAF even if subpopulations are highly differentiated.
The correct detection of FST outliers should be made either by pooling SNPs with similar MAF or evolutionary rates or by using residual values of FST after correcting for MAF. At the same time, it is important to note that no one measure is almighty, and the evolutionary rate is only one of many possible measures of functional importance of a position. Still the problem of linking evolutionary rate to functional constraint (e.g., Lawrie et al. 2011) applies primarily to functional regions under weak selection, as their evolutionary imprints may be overturned by mutational bias. In any case, despite its limitations, evolutionary rate is a useful measure that is easily calculated with low variance when many genomes are used and is directly comparable across positions harboring SNPs. Therefore, the comparison of values of FST and other measures of population differentiation should be done in the context of MAF of the variants and the evolutionary rates of the positions harboring them.
Materials and Methods
Analysis of Human Polymorphisms
We used the allele frequency data from AA and EA populations in Lohmueller et al. (2008), who resequenced 28 and 37 chromosomes in AA and EA populations, respectively. For each nucleotide position harboring an nSNP, we calculated the evolutionary rate using the DNA sequence alignment from 36 mammalian species following Kumar et al. (2009). Positions containing nSNPs were divided into CpG and non-CpG positions based on the dinucleotide context in the reference sequence of the human genome (hg 19). If a site is C followed by G or G preceded by C, it is classified into a CpG site. Otherwise, the position is classified to be a non-CpG site. For each nSNP, we estimated FST (Nei 1977; Nei and Chesser 1983), θ (Weir and Cockerham 1984), and Jost’s D (Jost 2008). All nSNPs producing negative estimates of population differentiation measures were excluded.
Analysis of SNPs in HapMap ENCODE Regions
We analyzed SNPs in the 10 ENCODE regions (ENr112, ENr131, ENr113, ENm010, ENm013, ENm014, ENr321, ENr232, ENr123, and ENr213) in HapMap phase I data (Altshuler et al. 2005). FST between CEU and YRI populations were calculated at SNP sites where allele frequencies are available in both populations, and polymorphism is observed in the total population. Then, Ensembl (Hubbard et al. 2002) annotations of the SNPs were obtained using SNPnexus (Chelala et al. 2008). There were a total of 4,729 nonexonic SNPs, with a majority found in intergenic regions (1,840) and introns (1,661).
Computer Simulation
We carried out frequency-based simulation of purifying selection in a subdivided population of a diploid organism that consisted of two demes of equal effective size N. We generated data sets under drift-migration balance and examined the effect of the intensity of purifying selection on FST. A derived deleterious allele is selected against with selection coefficient t and dominance coefficient h. Mutation occurs at rate u from ancestral to derived alleles and vice versa. Migration occurs at rate m between the demes in each generation. The simulation consists of the iteration of four biological processes in each generation: mutation, migration, selection, and random genetic drift. Every 100 generations, a sample of size 30 per deme is obtained by binomial sampling with probabilities of sampling an allele equal to its population frequency. If polymorphism is observed in the combined sample or the population, we carry out population differentiation calculation for the sample (Nei and Chesser 1983; Weir and Cockerham 1984; Jost 2008) or the population (Nei 1977; Jost 2008), respectively. The initial frequencies of the deleterious allele are sampled from a beta distribution with parameters a = b = 4Nu in each deme. Ten pairs of beta-distributed allele frequencies are used and 10 runs of simulations are conducted for each set of parameter values used. To ensure equilibrium state, calculations of FST are started after 8N generations in each run of the simulations. The iteration is continued until 100,000 values of FST, θ, and D are recorded.
Acknowledgments
We thank Maxwell Sanderford for assistance in data preparation. This research was supported by National Institutes of Health grants HG002096-10A1 and LM010834-01 to S.K. and Ewha Global Top 5 Grant 2011 of Ewha Womans University to Y.K.
References
- Akey JM, Zhang G, Zhang K, Jin L, Shriver MD. Interrogating a high-density SNP map for signatures of natural selection. Genome Res. 2002;12:1805–1814. doi: 10.1101/gr.631202. [DOI] [PMC free article] [PubMed] [Google Scholar]
- Altshuler D, Brooks LD, Chakravarti A, Collins FS, Daly MJ, Donnelly P, Gibbs R, Belmont J, Boudreau A, Leal S. A haplotype map of the human genome. Nature. 2005;437:1299–1320. doi: 10.1038/nature04226. [DOI] [PMC free article] [PubMed] [Google Scholar]
- Amato R, Pinelli M, Monticelli A, Marino D, Miele G, Cocozza S. Genome-wide scan for signatures of human population differentiation and their relationship with natural selection, functional pathways and diseases. PLoS One. 2009;4:e7927. doi: 10.1371/journal.pone.0007927. [DOI] [PMC free article] [PubMed] [Google Scholar]
- Anderson TJC, Nair S, Sudimack D, Williams JT, Mayxay M, Newton PN, Guthmann JP, Smithuis FM, Hien TT, van den Broek IVF. Geographical distribution of selected and putatively neutral SNPs in Southeast Asian malaria parasites. Mol Biol Evol. 2005;22:2362–2374. doi: 10.1093/molbev/msi235. [DOI] [PubMed] [Google Scholar]
- Barreiro LB, Laval G, Quach H, Patin E, Quintana-Murci L. Natural selection has driven population differentiation in modern humans. Nat Genet. 2008;40:340–345. doi: 10.1038/ng.78. [DOI] [PubMed] [Google Scholar]
- Charlesworth B. Measures of divergence between populations and the effect of forces that reduce variability. Mol Biol Evol. 1998;15:538–543. doi: 10.1093/oxfordjournals.molbev.a025953. [DOI] [PubMed] [Google Scholar]
- Chelala C, Khan A, Lemoine NR. SNPnexus: a web database for functional annotation of newly discovered and public domain single nucleotide polymorphisms. Bioinformatics. 2009;25:655–661. doi: 10.1093/bioinformatics/btn653. [DOI] [PMC free article] [PubMed] [Google Scholar]
- Clark AG, Hubisz MJ, Bustamante CD, Williamson SH, Nielsen R. Ascertainment bias in studies of human genome-wide polymorphism. Genome Res. 2005;15:1496–1502. doi: 10.1101/gr.4107905. [DOI] [PMC free article] [PubMed] [Google Scholar]
- Hedrick PW. Highly variable loci and their interpretation in evolution and conservation. Evolution. 1999;53:313–318. doi: 10.1111/j.1558-5646.1999.tb03767.x. [DOI] [PubMed] [Google Scholar]
- Hedrick PW. A standardized genetic differentiation measure. Evolution. 2005;59:1633–1638. [PubMed] [Google Scholar]
- Hubbard T, Barker D, Birney E, Cameron G, Chen Y, Clark L, Cox T, Cuff J, Curwen V, Down T. The Ensembl genome database project. Nucleic Acids Res. 2002;30:38–41. doi: 10.1093/nar/30.1.38. [DOI] [PMC free article] [PubMed] [Google Scholar]
- Izagirre N, García I, Junquera C, De La Rúa C, Alonso S. A scan for signatures of positive selection in candidate loci for skin pigmentation in humans. Mol Biol Evol. 2006;23:1697–1706. doi: 10.1093/molbev/msl030. [DOI] [PubMed] [Google Scholar]
- Jost L. Partitioning diversity into independent alpha and beta components. Ecology. 2007;88:2427–2439. doi: 10.1890/06-1736.1. [DOI] [PubMed] [Google Scholar]
- Jost L. GST and its relatives do not measure differentiation. Mol Ecol. 2008;17:4015–4026. doi: 10.1111/j.1365-294x.2008.03887.x. [DOI] [PubMed] [Google Scholar]
- Kumar S, Suleski MP, Markov GJ, Lawrence S, Marco A, Filipski AJ. Positional conservation and amino acids shape the correct diagnosis and population frequencies of benign and damaging personal amino acid mutations. Genome Res. 2009;19:1562–1569. doi: 10.1101/gr.091991.109. [DOI] [PMC free article] [PubMed] [Google Scholar]
- Lawrie DS, Petrov DA, Messer PW. Faster than neutral evolution of constrained sequences: the complex interplay of mutational biases and weak selection. Genome Biol Evol. 2011;3:383. doi: 10.1093/gbe/evr032. [DOI] [PMC free article] [PubMed] [Google Scholar]
- Lewontin R, Krakauer J. Distribution of gene frequency as a test of the theory of the selective neutrality of polymorphisms. Genetics. 1973;74:175–195. doi: 10.1093/genetics/74.1.175. [DOI] [PMC free article] [PubMed] [Google Scholar]
- Lohmueller KE, Albrechtsen A, Li Y, Kim SY, Korneliussen T, Vinckenbosch N, Tian G, Huerta-Sanchez E, Feder AF, Grarup N. Natural selection affects multiple aspects of genetic variation at putatively neutral sites across the human genome. PLoS Genet. 2011;7:e1002326. doi: 10.1371/journal.pgen.1002326. [DOI] [PMC free article] [PubMed] [Google Scholar]
- Lohmueller KE, Indap AR, Schmidt S, Boyko AR, Hernandez RD, Hubisz MJ, Sninsky JJ, White TJ, Sunyaev SR, Nielsen R. Proportionally more deleterious genetic variation in European than in African populations. Nature. 2008;451:994–997. doi: 10.1038/nature06611. [DOI] [PMC free article] [PubMed] [Google Scholar]
- Lohmueller KE, Mauney MM, Reich D, Braverman JM. Variants associated with common disease are not unusually differentiated in frequency across populations. Am J Hum Genet. 2006;78:130–136. doi: 10.1086/499287. [DOI] [PMC free article] [PubMed] [Google Scholar]
- Long JC, Kittles RA. Human genetic diversity and the nonexistence of biological races. Hum Biol. 2009;81:777–798. doi: 10.3378/027.081.0621. [DOI] [PubMed] [Google Scholar]
- Meirmans PG, Hedrick PW. Assessing population structure: FST and related measures. Mol Ecol Resour. 2011;11:5–18. doi: 10.1111/j.1755-0998.2010.02927.x. [DOI] [PubMed] [Google Scholar]
- Myles S, Davison D, Barrett J, Stoneking M, Timpson N. Worldwide population differentiation at disease-associated SNPs. BMC Med Genomics. 2008;1:22. doi: 10.1186/1755-8794-1-22. [DOI] [PMC free article] [PubMed] [Google Scholar]
- Nei M. Analysis of gene diversity in subdivided populations. Proc Natl Acad Sci U S A. 1973;70:3321. doi: 10.1073/pnas.70.12.3321. [DOI] [PMC free article] [PubMed] [Google Scholar]
- Nei M. F-statistics and analysis of gene diversity in subdivided populations. Ann Hum Genet. 1977;41:225–233. doi: 10.1111/j.1469-1809.1977.tb01918.x. [DOI] [PubMed] [Google Scholar]
- Nei M, Chesser R. Estimation of fixation indices and gene diversities. Ann Hum Genet. 1983;47:253–259. doi: 10.1111/j.1469-1809.1983.tb00993.x. [DOI] [PubMed] [Google Scholar]
- Norton HL, Kittles RA, Parra E, McKeigue P, Mao X, Cheng K, Canfield VA, Bradley DG, McEvoy B, Shriver MD. Genetic evidence for the convergent evolution of light skin in Europeans and East Asians. Mol Biol Evol. 2007;24:710–722. doi: 10.1093/molbev/msl203. [DOI] [PubMed] [Google Scholar]
- Pickrell JK, Coop G, Novembre J, Kudaravalli S, Li JZ, Absher D, Srinivasan BS, Barsh GS, Myers RM, Feldman MW. Signals of recent positive selection in a worldwide sample of human populations. Genome Res. 2009;19:826–837. doi: 10.1101/gr.087577.108. [DOI] [PMC free article] [PubMed] [Google Scholar]
- Ryan A, Mapp J, Moyna S, Mattiangeli V, Kelleher D, Bradley D, McManus R. Levels of interpopulation differentiation among different functional classes of immunologically important genes. Genes Immun. 2006;7:179–183. doi: 10.1038/sj.gene.6364266. [DOI] [PubMed] [Google Scholar]
- Seielstad MT, Minch E, Cavalli-Sforza LL. Genetic evidence for a higher female migration rate in humans. Nat Genet. 1998;20:278–280. doi: 10.1038/3088. [DOI] [PubMed] [Google Scholar]
- Subramanian S, Kumar S. Evolutionary anatomies of positions and types of disease-associated and neutral amino acid mutations in the human genome. BMC Genomics. 2006;7:306. doi: 10.1186/1471-2164-7-306. [DOI] [PMC free article] [PubMed] [Google Scholar]
- Tishkoff SA, Kidd KK. Implications of biogeography of human populations for ‘race’ and medicine. Nat Genet. 2004;36:S21–S27. doi: 10.1038/ng1438. [DOI] [PubMed] [Google Scholar]
- Weir B, Cockerham CC. Estimating F-statistics for the analysis of population structure. Evolution. 1984;38:1358–1370. doi: 10.1111/j.1558-5646.1984.tb05657.x. [DOI] [PubMed] [Google Scholar]
- Whitlock MC. GST′ and D do not replace FST. Mol Ecol. 2011;20:1083–1091. doi: 10.1111/j.1365-294X.2010.04996.x. [DOI] [PubMed] [Google Scholar]
- Wright S. Isolation by distance. Genetics. 1943;28:114–138. doi: 10.1093/genetics/28.2.114. [DOI] [PMC free article] [PubMed] [Google Scholar]
- Wright S. The genetical structure of populations. Ann Hum Genet. 1949;15:323–354. doi: 10.1111/j.1469-1809.1949.tb02451.x. [DOI] [PubMed] [Google Scholar]
- Wu DD, Zhang YP. Different level of population differentiation among human genes. BMC Evol Biol. 2011;11:16. doi: 10.1186/1471-2148-11-16. [DOI] [PMC free article] [PubMed] [Google Scholar]


