

Abstract
Prospective epidemiologic data on the effects of different types of dietary sugars on cancer incidence have been limited. In this report, we investigated the association of total sugars, sucrose, fructose, added sugars, added sucrose and added fructose in the diet with risk of 24 malignancies. Participants (n = 435,674) aged 50–71 years from the NIH-AARP Diet and Health Study were followed for 7.2 years. The intake of individual sugars was assessed using a 124-item food frequency questionnaire (FFQ). Cox proportional hazards regression was used to estimate hazard ratios (HR) and 95% confidence intervals (CI) in multivariable models adjusted for confounding factors pertinent to individual cancers. We identified 29,099 cancer cases in men and 13,355 cases in women. In gender-combined analyses, added sugars were positively associated with risk of esophageal adenocarcinoma (HRQ5 vs. Q1: 1.62, 95% CI: 1.07–2.45; Ptrend = 0.01); added fructose was associated with risk of small intestine cancer (HRQ5 vs. Q1: 2.20, 95% CI: 1.16–4.16; Ptrend = 0.009); and all investigated sugars were associated with increased risk of pleural cancer. In women, all investigated sugars were inversely associated with ovarian cancer. We found no association between dietary sugars and risk of colorectal or any other major cancer. Measurement error in FFQ-reported dietary sugars may have limited our ability to obtain more conclusive findings. Statistically significant associations observed for the rare cancers are of interest and warrant further investigation.
Keywords: Sugars, added sugars, diet, cancer, AARP Study
Introduction
Consumption of sugars is increasing worldwide1, yet, its association with cancer is largely unknown2. It has been suggested that diets high in sugars may promote carcinogenesis by stimulating synthesis of insulin and insulin-like growth factor-I (IGF-I)3, inducing oxidative stress4, or promoting weight gain5.
By chemical structure, sugars are grouped into mono- and disaccharides, and their sum equals total sugars (see Figure 1). Various sugars naturally present in foods, such as fruit, vegetables and dairy products, partly account for sugars intake; however highly processed foods and drinks in which sugars and syrups are added during processing or preparation, or sugars and syrups added at the table, have become more significant sources of sugars. Data from the United States (U.S.) National Health and Nutrition Examination Survey (NHANES) 2003–2004, showed that the intake of added sugars in the U.S. population largely exceed the recommended allowance for discretionary calorie intake; among men and women ≥ 18 years of age, the average intake of added sugars being 1.5 and 2.8 times greater, respectively6.
Figure 1.
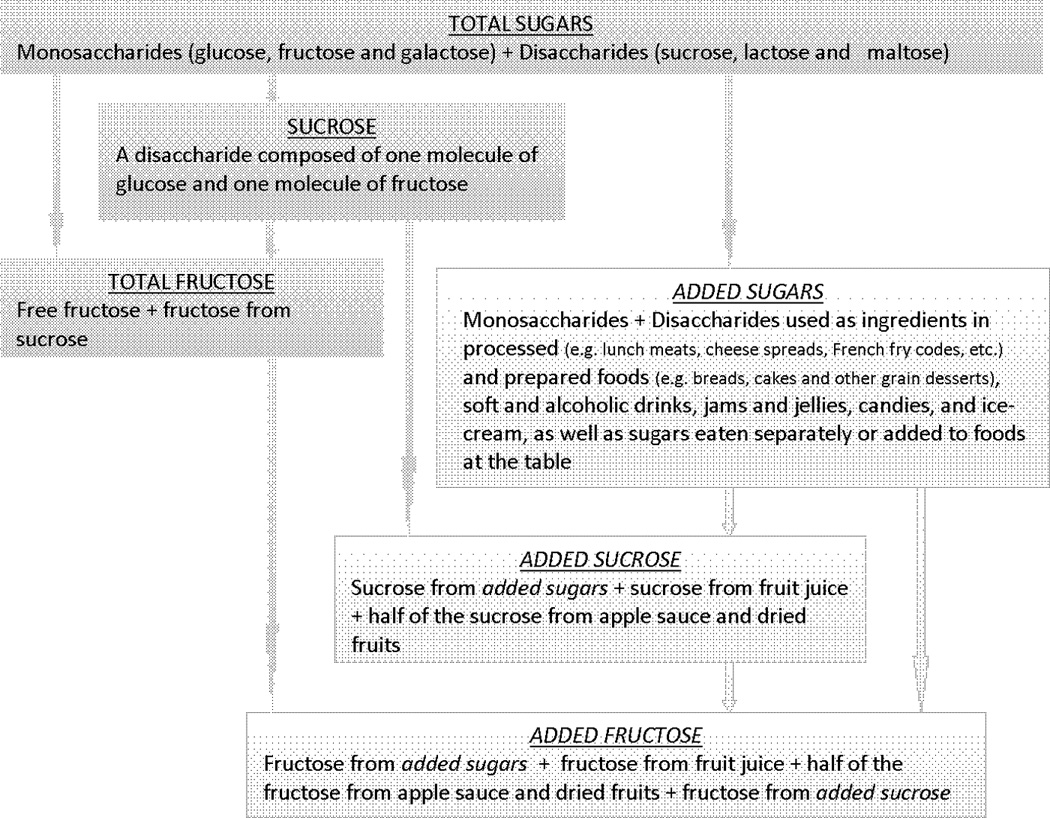
Definition of the investigated sugars
An international panel of experts recently concluded that there is “limited – suggestive” epidemiologic evidence linking sugars (i.e. mainly sucrose and fructose) with colorectal cancer, and there is no evidence for an association with any other cancer sites2. A recent overview of epidemiologic studies on carbohydrates and cancer reported that data, especially from prospective studies, are too sparse to draw conclusions for the effect of sugars on cancer other than sucrose for colorectal, and perhaps lactose for ovarian cancer, and that further research is needed7. Although case-control studies have provided some evidence on the relation of sugars intake and cancer risk8–9, inherent limitations of case-control study design10 make the interpretation of findings difficult, especially when effects of dietary sugars on cancer may be small.
We used data from a large U.S. prospective study of approximately half a million participants to assess the association between dietary sugars and risk of 24 malignancies. We hypothesize that intake of sugars is associated with increased risk of cancer. We investigated the effect of different types of sugars, including total sugars, sucrose and fructose, as well as the effect of added sugars, added sucrose and added fructose on cancer risk. Although chemically identical, the physiological effect of sugars may differ depending on whether they are an integral part of a cellular structure of the food accompanied with micronutrients and bioactive compounds, or are free in solution, present in highly processed, fibre-depleted, rapidly digestible foods, and thus readily available for metabolism11. Earlier experimental evidence showed that higher rate of absorption, metabolism and utilization of added sugars may favor their adverse effects12. So far, added sugars have been investigated only in relation to pancreatic cancer13–14.
Material and methods
Study population
The NIH-AARP Diet and Health Study is a prospective cohort of men and women, aged 50–71 years, from eight states in the U.S. (California, Florida, Louisiana, New Jersey, North Carolina, Michigan, Georgia and Pennsylvania). Recruitment began in 1995 when a self-administered baseline questionnaire, including questions on demographic characteristics, personal and family medical history, diet and other lifestyle factors, was mailed to 3.5 million members of AARP, previously known as the American Association of Retired Persons. The questionnaire was returned by 617,119 members, of whom 567,169 completed the survey satisfactorily. Further details of the recruitment and the study design are reported elsewhere15. The NIH-AARP Diet and Health Study was approved by the Special Studies Institutional Review Board of the U.S. National Cancer Institute.
From 567,169 participants, we excluded subjects with duplicate questionnaires (n = 179), those who moved out of the study areas or died at baseline (n = 582), withdrew from the study (n = 6), were proxy responders (n = 15,760), had less than one year of follow-up (n = 12,031), were prevalent cases of any cancer except non-melanoma skin cancer (n = 51,193), had cancer identified only from death records (n = 3,876) or reported end-stage renal disease (n = 997) or diabetes (n = 43,003) at baseline. We further excluded subjects with implausible energy intake (i.e. beyond twice the interquartile range above the 75th or below the 25th percentile of sex-specific Box-Cox transformed energy intake) (n = 3,868). Our final baseline cohort consisted of 435,686 participants (255,696 men and 179,990 women).
Cohort follow-up and case ascertainment
Cohort members were annually followed for change of address using the U.S. Postal Service and the Maximum Change of Address database (MaxCoA; maintained by Anchor Computer). Additional information on change of address was received directly from participants who reported address changes when responding to a study mailing, such as follow-up questionnaires or newsletters. Follow-up was calculated from baseline (1995–1996) until censoring at the end of 2003, or when the participant moved out of one of the study areas, had a cancer diagnosis, or died, whichever came first. In addition, we expanded our cancer registry ascertainment area by three states (Arizona, Nevada, and Texas) to capture cancer cases occurring among participants who moved to those states during follow-up. Approximately 4% of participants were lost to follow-up from the whole cohort. Vital status was ascertained by annual linkage to the U.S. Social Security Administration Death Master File and follow-up searches of the National Death Index (NDI). Cancer cases were identified by linkage to 11 state cancer registries. For this analysis, we included primary incident cases of 24 cancers defined using the Surveillance Epidemiology and End Results site recode and the International Classification of Diseases for Oncology, Third Edition16.
Dietary assessment
The National Cancer Institute (NCI) self-administered semi-quantitative food frequency questionnaire (FFQ), the Diet History Questionnaire (DHQ) with 124 food items15 was sent at baseline to assess participants’ usual diet over the previous 12 months. A question in the DHQ inquired whether participants usually drank sugar-free or regular-calorie type beverages, and what kind of sweetener they usually added to coffee and tea (sugar or honey, equal or aspartame, saccharin or Sweet-n-Low, or other sweetener). The food items, sex-specific portion sizes, and nutrient database for the DHQ were generated using data from the USDA 1994–1996 Continuing Survey of Food Intake by Individuals, as described by Subar et al17. Individual monosaccharides and disaccharides were estimated using the University of Minnesota’s Nutrition Data System for Research (NDS-R) database Version 5.0_35 (2004). Investigated sugars variables, i.e. total sugars, sucrose, total fructose, added sugar and added sucrose and fructose are described in Figure 1. Added sugars (teaspoons/day) were estimated using the USDA MyPyramid Equivalents Database (MPED) version 118. As shown in Figure 1, we regarded naturally-occurring sucrose and fructose in fruit juice as added sucrose and added fructose, because during processing the cellular structure of the fruit is disrupted thereby making the sugars freely available in solution. Only half of the total fructose and sucrose in applesauce and dried fruits were considered as added, given that those foods are semi-processed and retain some physical characteristics of the original fruit19. From an earlier DHQ validation study, the correlations between added sugars intake from the DHQ and four 24-hour dietary recalls, adjusted for total energy intake, were 0.68 in men and 0.79 in women20.
Statistical analysis
Sex- and age-adjusted correlation between individual sugars was assessed using Spearman correlation coefficient. Sex-specific Cox proportional hazards regression models, with attained age as the underlying time metric, were used to estimate hazard ratios (HR) and 95% confidence intervals (CI). All sugars variables were categorized into quintiles based on sex-specific cut-points. For analysis of cancers with <100 cases, sugars variables were categorized into tertiles. For the low incidence cancers (<100 cases in either gender), we also performed gender-combined analysis to increase the statistical power. Tests for linear trend were performed by assigning participants the median value of their quintiles/tertiles, and entering that score variable in a regression model. The multivariable models for all cancer sites included age, race, education, marital status, body mass index (BMI), family history of cancer, smoking (summary variable combining smoking status, smoking intensity and time since quitting), physical activity, energy and alcohol intake. For each cancer site, we further investigated other potential risk factors pertinent to individual cancers, by individually entering potential confounders into age- and energy-adjusted model with total sugars as the main exposure. Variables that changed the risk estimate by ≥10% were retained in the corresponding model and are listed in the footnotes of Tables 2 & 3. All dietary variables, except alcohol, were energy adjusted using the nutrient density method. Our main analysis investigated the substitution effect, where total energy intake was kept constant, so that increasing the amount of sugars substituted the effect of other energy contributing nutrients. We also investigated the addition effect of sugars using a partition model; we entered sugars in the disease models in absolute amounts and controlled for non-sugar non-alcohol energy, therefore investigating the effect of adding calories from sugars. All investigated sugars were entered in the models one at the time, except for added fructose and added sucrose; models with added fructose were adjusted for naturally-occurring fructose (total fructose – added fructose). Similarly, models with added sucrose were adjusted for naturally-occurring sucrose (total sucrose – added sucrose). In these models we observed the effect of fructose or sucrose from added sugars sources only, while keeping the intake of naturally-occurring fructose or sucrose constant. Models with added sugars were adjusted for fruits as a major source of naturally occurring sugars. In order to investigate whether BMI mediates or modifies the effect of sugars, models for BMI-related cancers (esophageal, colorectal, pancreatic, kidney, breast and endometrial cancer) were re-fitted excluding BMI and re-ran by BMI strata, respectively. Models with the smoking-related cancers, that showed significant associations in the main analysis, were repeated in never smokers. We also investigated whether controlling for fruit (excluding fruit juice) or use of hormone replacement therapy (HRT) in females changed the risk estimates. All analyses were conducted using SAS version 9.1 (SAS Institute, Cary, NC). The P values for statistical tests were two tailed and considered statistically significant at a level of less than 0.05.
Table 2.
Multivariable HR1 and 95% CI across quintiles (Q) of total sugars, added sugars, total fructose and sucrose intake in 255,696 men in the NIH-AARP Diet and Health Study for all cancers, oral, esophageal, lung, pleural and bladder cancer, and leukemia2
| N cases |
Multivariable HRs (95% CI) by quintiles3 of intake |
|||||
|---|---|---|---|---|---|---|
| Q2 | Q3 | Q4 | Q5 | Ptrend | ||
| All cancers5 | 28,752 | |||||
| Total sugars | 0.98 (0.95 – 1.02) | 0.98 (0.94 – 1.02) | 0.97 (0.92 – 1.01) | 0.94 (0.89 – 1.00) | 0.04 | |
| Added sugars4 | 0.99 (0.96 – 1.03) | 1.00 (0.96 – 1.03) | 1.00 (0.97 – 1.05) | 0.97 (0.93 – 1.01) | 0.24 | |
| Total fructose | 1.00 (0.96 – 1.04) | 0.99 (0.95 – 1.03) | 0.96 (0.92 – 1.01) | 0.94 (0.89 – 1.00) | 0.02 | |
| Sucrose | 0.96 (0.93 – 1.00) | 0.97 (0.93 – 1.01) | 0.97 (0.93 – 1.01) | 0.99 (0.95 – 1.04) | 0.84 | |
| Oral cancer6 | 547 | |||||
| Total sugars | 0.78 (0.61 – 1.01) | 0.64 (0.49 – 0.85) | 0.68 (0.52 – 0.90) | 0.71 (0.54 – 0.93) | 0.01 | |
| Added sugars4 | 0.98 (0.75 – 1.27) | 0.87 (0.66 – 1.14) | 0.68 (0.51 – 0.91) | 0.81 (0.61 – 1.08) | 0.07 | |
| Total fructose | 0.84 (0.66 – 1.07) | 0.63 (0.48 – 0.83) | 0.71 (0.54 – 0.93) | 0.71 (0.54 – 0.94) | 0.01 | |
| Sucrose | 0.77 (0.60 – 1.00) | 0.73 (0.56 – 0.95) | 0.72 (0.55 – 0.94) | 0.65 (0.49 – 0.86) | 0.004 | |
| Esophageal cancer7 | 384 | |||||
| Total sugars | 1.07 (0.78 – 1.47) | 1.06 (0.76 – 1.49) | 1.14 (0.79 – 1.63) | 1.09 (0.73 – 1.63) | 0.64 | |
| Added sugars4 | 0.98 (0.70 – 1.35) | 0.85 (0.60 – 1.20) | 1.08 (0.77 – 1.51) | 1.44 (1.03 – 2.03) | 0.007 | |
| Total fructose | 1.09 (0.79 – 1.50) | 1.13 (0.81 – 1.59) | 1.14 (0.79 – 1.63) | 1.28 (0.87 – 1.87) | 0.22 | |
| Sucrose | 0.78 (0.56 – 1.08) | 0.89 (0.64 – 1.24) | 0.97 (0.70 – 1.36) | 1.05 (0.75 – 1.48) | 0.40 | |
| Lung cancer8 | 3,302 | |||||
| Total sugars | 0.86 (0.78 – 0.96) | 0.85 (0.76 – 0.95) | 0.87 (0.77 – 0.97) | 0.85 (0.76 – 0.97) | 0.02 | |
| Added sugars4 | 0.97 (0.87 – 1.09) | 0.96 (0.86 – 1.08) | 0.94 (0.84 – 1.06) | 0.90 (0.80 – 1.01) | 0.06 | |
| Total fructose | 0.87 (0.79 – 0.97) | 0.81 (0.72 – 0.90) | 0.83 (0.74 – 0.93) | 0.85 (0.75 – 0.96) | 0.009 | |
| Sucrose | 0.93 (0.83 – 1.03) | 0.88 (0.78 – 0.98) | 0.86 (0.77 – 0.96) | 0.93 (0.84 – 1.04) | 0.26 | |
| Pleural cancer6 | 102 | |||||
| Total sugars | 1.42 (0.70 – 2.86) | 1.57 (0.78 – 3.17) | 1.13 (0.53 – 2.43) | 2.64 (1.33 – 5.24) | 0.006 | |
| Added sugars4 | 2.07 (0.99 – 4.33) | 2.19 (1.04 – 4.60) | 2.10 (0.98 – 4.51) | 2.90 (1.35 – 6.24) | 0.03 | |
| Total fructose | 1.91 (0.96 – 3.80) | 1.58 (0.77 – 3.24) | 1.40 (0.67 – 2.96) | 2.23 (1.10 – 4.52) | 0.09 | |
| Sucrose | 0.97 (0.48 – 1.99) | 0.96 (0.47 – 1.99) | 1.76 (0.92 – 3.36) | 1.75 (0.90 – 3.42) | 0.02 | |
| Bladder cancer9 | 1,093 | |||||
| Total sugars | 0.85 (0.70 – 1.02) | 0.89 (0.73 – 1.07) | 0.88 (0.72 – 1.08) | 0.85 (0.68 – 1.05) | 0.23 | |
| Added sugars4 | 0.96 (0.79 – 1.17) | 1.01 (0.83 – 1.23) | 1.16 (0.96 – 1.42) | 1.06 (0.86 – 1.31) | 0.31 | |
| Total fructose | 0.95 (0.79 – 1.15) | 1.02 (0.84 – 1.23) | 0.99 (0.82 – 1.21) | 1.00 (0.82 – 1.23) | 0.86 | |
| Sucrose | 0.72 (0.59 – 0.88) | 0.89 (0.73 – 1.08) | 0.96 (0.79 – 1.17) | 1.00 (0.82 – 1.22) | 0.20 | |
| Leukemia6 | 584 | |||||
| Total sugars | 0.99 (0.76 – 1.28) | 0.88 (0.67 – 1.16) | 1.07 (0.82 – 1.39) | 0.97 (0.73 – 1.28) | 0.96 | |
| Added sugars4 | 1.25 (0.95 – 1.64) | 1.28 (0.97 – 1.68) | 1.45 (1.09 – 1.91) | 1.09 (0.80 – 1.48) | 0.90 | |
| Total fructose | 1.10 (0.85 – 1.44) | 1.09 (0.84 – 1.43) | 1.09 (0.83 – 1.43) | 1.00 (0.75 – 1.33) | 0.83 | |
| Sucrose | 1.11 (0.85 – 1.45) | 0.99 (0.75 – 1.30) | 1.07 (0.81 – 1.40) | 1.15 (0.87 – 1.51) | 0.41 | |
Cox proportional hazards regression model adjusted for age, BMI (<18.5, ≥18.5 to <25, ≥25 to <30, ≥30 to <35, ≥35, or missing), family history of cancer, marital status, smoking (never smoker, quit >=10 yrs ago, quit 5–9 yrs ago, quit 1–4 yrs ago, quit <1yr ago <=20 cigs/d, quit <1yr ago >20 cigs/d, current <=20 cigs/d, current 20–40 cigs/d, current >40 cigs/d, or missing), race (Caucasian, Black, Hispanic/Asian/Pacific Islander/American Indian/Alaskan native, or unknown), education (less than high school/unknown, high school graduate, some college, or college graduate), physical activity (never/rarely/missing, 1–3 times per month, 1–2 times per week, 3–4 times per week, or ≥5 times per week), energy intake (kcal, continuous) and alcohol intake (grams, quintiles).
Cancer sites which were statistically significantly associated with dietary sugars in either men or women are reported in this table. Findings for the remaining 17 cancers are reported as online material.
Medians by quintile of intake were: 33.8, 46.1, 55.7, 66.5 and 85.3 g/1000 kcal for total sugars; 2.2, 3.5, 5.0, 7.0 and 11.2 tsp/1000 kcal for added sugars; 12.8, 18.2, 22.7, 28.0 and 38.1 g/1000 kcal for total fructose; and 11.9, 17.0, 21.2, 26.3 and 35.5 g/1000 kcal for sucrose.
Additionally adjusted for fruit without juice (g/1000 kcal, quintiles) and for fruit juice (g/1000 kcal, quintiles) to separate the effect of fruit juice and whole fruits.
Additionally adjusted for vegetables (g/1000 kcal, quintiles), red meat (g/1000 kcal, quintiles), total fat (g/1000 kcal, quintiles), protein (g/1000 kcal, quintiles), fiber (g/1000 kcal, quintiles), folate (µg/1000 kcal, quintiles), beta-carotene (µg/1000 kcal, quintiles), vitamin C (mg/1000 kcal quintiles) and calcium intake (mg/1000 kcal quintiles), use of supplemental calcium (mg, quintiles) and height (cm, continuous).
Additionally adjusted for vegetables intake.
Additionally adjusted for vegetables, red meat, beta-carotene and vitamin C intake.
Additionally adjusted for vegetables, red meat and saturated fat intake (g/1000 kcal, quintiles).
Additionally adjusted for vegetables and red meat intake.
Table 3.
Multivariable HR1 and 95% CI across quintiles (Q)/tertiles (T) of total sugars, added sugars, total fructose and sucrose intake in 179,990 women in the NIH-AARP Diet and Health Study for all cancers, oral, esophageal, lung, pleural, bladder, ovarian cancer and leukemia2
| N cases |
Multivariable HRs (95% CI) by quintiles3 or tertiles4 of intake |
Ptrend | ||||
|---|---|---|---|---|---|---|
| Q2/T2 | Q3/T3 | Q4 | Q5 | |||
| All cancers6 | 13,209 | |||||
| Total sugars | 1.02 (0.97 – 1.08) | 1.02 (0.96 – 1.09) | 1.01 (0.95 – 1.09) | 1.00 (0.91 – 1.08) | 0.75 | |
| Added sugars5 | 1.01 (0.96 – 1.07) | 1.00 (0.95 – 1.06) | 1.01 (0.95 – 1.07) | 1.00 (0.94 – 1.07) | 0.99 | |
| Total fructose | 1.00 (0.95 – 1.06) | 1.01 (0.95 – 1.08) | 1.02 (0.95 – 1.09) | 0.98 (0.90 – 1.06) | 0.59 | |
| Sucrose | 1.01 (0.96 – 1.07) | 0.98 (0.92 – 1.04) | 1.02 (0.96 – 1.08) | 1.00 (0.94 – 1.07) | 0.94 | |
| Oral cancer7 | 205 | |||||
| Total sugars | 0.90 (0.58 – 1.39) | 1.15 (0.75 – 1.75) | 1.06 (0.68 – 1.65) | 1.10 (0.70 – 1.73) | 0.54 | |
| Added sugars5 | 1.08 (0.69 – 1.69) | 1.15 (0.73 – 1.81) | 1.21 (0.77 – 1.90) | 1.19 (0.75 – 1.88) | 0.49 | |
| Total fructose | 1.36 (0.91 – 2.05) | 0.88 (0.55 – 1.41) | 1.16 (0.74 – 1.82) | 1.26 (0.81 – 1.97) | 0.48 | |
| Sucrose | 0.85 (0.55 – 1.33) | 0.99 (0.64 – 1.54) | 1.21 (0.80 – 1.85) | 1.00 (0.64 – 1.56) | 0.64 | |
| Esophageal cancer8 | 68 | |||||
| Total sugars | 1.27 (0.68 – 2.36) | 1.41 (0.69 – 2.91) | 0.35 | |||
| Added sugars5 | 0.71 (0.38 – 1.34) | 1.04 (0.56 – 1.93) | 0.80 | |||
| Total fructose | 1.82 (0.98 – 3.36) | 1.71 (0.83 – 3.54) | 0.17 | |||
| Sucrose | 1.33 (0.74 – 2.41) | 1.13 (0.58 – 2.20) | 0.75 | |||
| Lung cancer9 | 2,008 | |||||
| Total sugars | 0.94 (0.83 – 1.07) | 0.99 (0.86 – 1.14) | 0.86 (0.74 – 1.00) | 0.89 (0.76 – 1.05) | 0.10 | |
| Added sugars5 | 1.01 (0.88 – 1.16) | 1.03 (0.89 – 1.19) | 0.94 (0.81 – 1.09) | 1.00 (0.86 – 1.16) | 0.83 | |
| Total fructose | 0.93 (0.82 – 1.06) | 1.00 (0.88 – 1.15) | 0.83 (0.71 – 0.96) | 0.86 (0.73 – 1.01) | 0.03 | |
| Sucrose | 0.94 (0.82 – 1.07) | 0.87 (0.75 – 1.00) | 0.98 (0.85 – 1.13) | 0.90 (0.78 – 1.04) | 0.26 | |
| Bladder cancer10 | 202 | |||||
| Total sugars | 1.23 (0.79 – 1.92) | 1.05 (0.65 – 1.71) | 1.47 (0.92 – 2.33) | 1.47 (0.90 – 2.41) | 0.10 | |
| Added sugars5 | 1.38 (0.89 – 2.14) | 1.38 (0.88 – 2.16) | 0.97 (0.58 – 1.60) | 1.41 (0.87 – 2.29) | 0.45 | |
| Total fructose | 1.29 (0.83 – 1.99) | 0.96 (0.59 – 1.56) | 1.30 (0.82 – 2.07) | 1.66 (1.05 – 2.65) | 0.03 | |
| Sucrose | 1.38 (0.89 – 2.15) | 1.27 (0.80 – 2.03) | 1.17 (0.72 – 1.90) | 1.59 (1.00 – 2.53) | 0.12 | |
| Leukemia7 | 226 | |||||
| Total sugars | 1.11 (0.72 – 1.72) | 1.03 (0.65 – 1.62) | 1.46 (0.96 – 2.24) | 1.49 (0.96 – 2.31) | 0.03 | |
| Added sugars5 | 0.99 (0.64 – 1.53) | 1.07 (0.69 – 1.67) | 1.01 (0.64 – 1.60) | 1.60 (1.03 – 2.48) | 0.02 | |
| Total fructose | 1.00 (0.64 – 1.55) | 1.14 (0.74 – 1.76) | 1.46 (0.96 – 2.21) | 1.34 (0.87 – 2.08) | 0.07 | |
| Sucrose | 1.03 (0.67 – 1.59) | 1.33 (0.88 – 2.01) | 1.28 (0.84 – 1.95) | 1.03 (0.66 – 1.63) | 0.77 | |
| Ovarian cancer7 | 457 | |||||
| Total sugars | 0.95 (0.71 – 1.26) | 0.82 (0.61 – 1.11) | 0.90 (0.67 – 1.21) | 0.70 (0.51 – 0.97) | 0.03 | |
| Added sugars5 | 1.07 (0.81 – 1.41) | 0.84 (0.62 – 1.13) | 0.84 (0.62 – 1.15) | 0.72 (0.51 – 1.00) | 0.02 | |
| Total fructose | 0.96 (0.72 – 1.28) | 0.91 (0.68 – 1.22) | 0.90 (0.67 – 1.21) | 0.68 (0.49 – 0.95) | 0.02 | |
| Sucrose | 0.93 (0.70 – 1.23) | 0.88 (0.66 – 1.17) | 0.77 (0.57 – 1.04) | 0.65 (0.47 – 0.89) | 0.004 | |
Cox proportional hazards regression model adjusted for age, BMI (<18.5, ≥18.5 to <25, ≥25 to <30, ≥30 to <35, ≥35, or missing), family history of cancer, marital status, smoking (never smoker, quit >=10 yrs ago, quit 5–9 yrs ago, quit 1–4 yrs ago, quit <1yr ago <=20 cigs/d, quit <1yr ago >20 cigs/d, current <=20 cigs/d, current 20–40 cigs/d, current >40 cigs/d, or missing), race (Caucasian, Black, Hispanic/Asian/Pacific Islander/American Indian/Alaskan native, or unknown), education (less than high school/unknown, high school graduate, some college, or college graduate), physical activity (never/rarely/missing, 1–3 times per month, 1–2 times per week, 3–4 times per week, or ≥5 times per week), energy intake (kcal, continuous) and alcohol intake (grams, quintiles).
Only findings for cancer sites which were statistically significantly associated with dietary sugars either in men or women are reported in this table. Findings for the remaining 17 cancers are reported as an additional material.
Medians by quintile of intake were: 38.7, 51.6, 61.5, 72.5 and 91.5 g/1000 kcal for total sugars; 2.4, 3.7, 5.0, 6.9 and 11.0 tsp/1000 kcal for added sugars; 14.8, 20.5, 25.0, 30.4 and 40.6 g/1000 kcal for total fructose; and 13.6, 18.7, 22.9, 28.0 and 37.5 g/1000 kcal for sucrose.
Medians by tertile of intake were: 43.9, 61.4 and 83.1 g/1000 kcal for total sugars; 2.9, 5.0 and 9.0 tsp/1000 kcal for added sugars; 17.0, 25.0 and 35.9 g/1000 kcal for total fructose; and 15.6, 22.9 and 33.2 g/1000 kcal for sucrose.
Additionally adjusted for fruit without juice (g/1000 kcal, quintiles) and for fruit juice (g/1000 kcal, quintiles) to separate the effect of fruit juice and whole fruits.
Additionally adjusted for vegetables (g/1000 kcal, quintiles), red meat (g/1000 kcal, quintiles), total fat (g/1000 kcal, quintiles), protein (g/1000 kcal, quintiles), fiber (g/1000 kcal, quintiles), folate (µg/1000 kcal, quintiles), beta-carotene (µg/1000 kcal, quintiles), vitamin C (mg/1000 kcal, quintiles) and calcium intake (mg/1000 kcal, quintiles), use of supplemental calcium (mg, quintiles) and height (cm, continuous).
Additionally adjusted for vegetables intake.
Additionally adjusted for vegetables, red meat, beta-carotene and vitamin C intake.
Additionally adjusted for vegetables and red meat intake.
Additionally adjusted for vegetables and protein intake.
Results
After an average of 7.2 years follow-up, 29,099 men and 13,355 women were diagnosed with cancer. The baseline characteristics of men and women by quintile of added sugars and total sugars intake are given in Table 1. Some characteristics had similar trends for total and added sugars. For instance, participants in the highest compared to those in the lowest quintile of added and total sugars intake were less likely to be Caucasian White, college educated and, among women, to be HRT users. They also had lower intakes of protein, alcohol, vegetables and red meat. However, for some baseline characteristics participants had opposite trends across categories of total versus added sugars. For example, in contrast to trends for participants with the highest compared to lowest total sugars intake, those in the highest compared to lowest added sugars intake tended to be younger, married (among males), to smoke, exercise less, consume less fruit, dietary fiber, calcium, folate and beta-carotene, and calcium supplements. The correlation among sugars ranged from 0.54 for total and added sugars to 0.93 for total sugars and total fructose. There was also a high correlation between total and added fructose (r = 0.83), and sucrose and added sucrose (r = 0.92). In this population, 80.5% (95% CI: 79.3–81.7%) of total fructose and 78.9% (95% CI: 77.5–80.3%) of sucrose was from added fructose and added sucrose intake, respectively.
Table 1.
Baseline characteristics of men (n = 255,696) and women (n = 179,990) in the NIH-AARP Diet and Health study by quintile of added and total sugars intake1
| Added sugars (tsp/1000 kcal) | Total sugars (g/1000 kcal) | |||||||
|---|---|---|---|---|---|---|---|---|
| Variable | Men | Women | Men | Women | ||||
| Q1 ≤ 2.9 |
Q5 ≥ 8.6 |
Q1 ≤ 3.1 |
Q5 ≥ 8.3 |
Q1 ≤ 40.7 |
Q5 ≥ 73.8 |
Q1 ≤ 46.0 |
Q5 ≥ 79.9 |
|
| Added sugars2, (tsp3/1000 kcal) | 2.1 | 12.6 | 2.3 | 12.6 | 3.1 | 10.1 | 3.5 | 9.7 |
| Total sugars2, (g/1000 kcal) | 44.8 | 78.5 | 51.9 | 82.7 | 32.5 | 90.1 | 37.2 | 96.6 |
| Age2, (years) | 62.1 | 61.3 | 61.9 | 61.1 | 61.5 | 61.9 | 61.3 | 61.8 |
| BMI2, (kg/m2) | 27.4 | 26.9 | 26.2 | 26.8 | 27.7 | 26.7 | 27.0 | 26.2 |
| 1st degree relative with cancer, (%) | 46.5 | 46.8 | 50.2 | 51.1 | 47.7 | 45.9 | 51.7 | 49.6 |
| Married, (%) | 83.0 | 85.1 | 46.1 | 41.0 | 84.7 | 82.8 | 48.5 | 38.5 |
| HRT users, (%) | 46.6 | 40.1 | 46.8 | 40.7 | ||||
| Race | ||||||||
| Caucasian White, (%) | 92.8 | 91.7 | 90.1 | 87.0 | 94.1 | 89.9 | 92.4 | 83.9 |
| African American, (%) | 1.6 | 4.1 | 3.5 | 8.8 | 1.3 | 4.7 | 2.6 | 10.2 |
| Physical activity ≥ 5 times/wk, (%) | 23.9 | 18.3 | 19.1 | 12.8 | 18.2 | 24.0 | 13.0 | 19.0 |
| Education, College graduate or postgraduate, (%) | 50.9 | 34.3 | 33.9 | 23.1 | 45.7 | 41.5 | 29.4 | 28.5 |
| Current smoker or quit <1yr ago, (%) | 10.5 | 18.4 | 16.9 | 22.7 | 16.1 | 11.2 | 22.3 | 15.0 |
| Dietary intake | ||||||||
| Calories2, (kcal/d) | 1945 | 2154 | 1452 | 1706 | 2162 | 1988 | 1560 | 1608 |
| Total fat2, (g/1000 kcal) | 31.7 | 33.4 | 33.1 | 32.8 | 36.9 | 27.7 | 39.3 | 26.3 |
| Protein2, (g/1000 kcal) | 39.0 | 33.3 | 40.5 | 33.0 | 39.0 | 34.2 | 40.6 | 34.3 |
| Carbohydrate2, (g/1000 kcal) | 117 | 140 | 127 | 146 | 102 | 155 | 111 | 162 |
| Total fructose2, (g/1000 kcal) | 18.7 | 34.9 | 22.0 | 36.4 | 12.9 | 40.0 | 14.9 | 42.7 |
| Added fructose2, (g/1000 kcal) | 13.3 | 31.5 | 14.9 | 31.9 | 10.0 | 33.8 | 11.0 | 34.7 |
| Sucrose2, (g/1000 kcal) | 14.4 | 34.2 | 16.4 | 36.4 | 12.7 | 33.3 | 14.7 | 35.0 |
| Added sucrose2, (g/1000 kcal) | 9.1 | 30.6 | 9.5 | 31.9 | 9.5 | 27.5 | 10.6 | 27.7 |
| Glucose2, (g/1000 kcal) | 11.0 | 17.2 | 12.7 | 17.7 | 7.2 | 21.3 | 8.1 | 22.9 |
| Dietary fiber2, (g/1000 kcal) | 11.3 | 8.3 | 12.7 | 9.1 | 9.2 | 10.6 | 10.2 | 11.8 |
| Alcohol2, (g) | 37.9 | 7.8 | 12.6 | 3.0 | 42.9 | 5.8 | 13.4 | 2.4 |
| Calcium2, (mg/1000 kcal) | 383 | 365 | 431 | 405 | 316 | 464 | 357 | 522 |
| Calcium supplement2, (mg/d) | 161 | 120 | 418 | 314 | 130 | 155 | 351 | 388 |
| Folate2, (µg/1000 kcal) | 239 | 191 | 263 | 201 | 201 | 234 | 222 | 248 |
| Vitamin C2, (mg/1000 kcal) | 96.1 | 68.4 | 118.5 | 81.4 | 52.6 | 121.6 | 66.7 | 142.6 |
| Beta carotene2, (mg/1000 kcal) | 2527 | 1492 | 3743 | 2068 | 1752 | 2194 | 2586 | 3126 |
| Vegetables2, (cup equivalents/1000 kcal) | 1.2 | 0.8 | 1.5 | 0.9 | 1.0 | 0.9 | 1.3 | 1.1 |
| Fruit (including juice)2, (cup equivalents/1000 kcal) | 1.2 | 0.8 | 1.5 | 1.0 | 0.5 | 1.7 | 0.6 | 2.1 |
| Fruit (excluding fruit juice)2, (g/1000kcal) | 0.7 | 0.5 | 1.0 | 0.6 | 0.3 | 0.9 | 0.5 | 1.2 |
| Red meat2, (g/1000 kcal) | 37.9 | 36.7 | 30.9 | 28.0 | 48.8 | 26.3 | 40.7 | 19.3 |
P for trend < 0.0001 for all variables except for 1st degree relative with cancer across added sugars intake (men, P = 0.12; women, P = 0.02), as estimated by the Cohrain-Armitage tests for categorical variables and the t test for slope in generalized linear models for continuous variables.
Mean value.
One teaspoon of added sugars equals 4.2 grams total sugars 50.
In Table 2 and 3 we report risk estimates for those cancer sites which were statistically significantly associated with dietary sugars in either men or women (see online material for findings on the remaining 17 cancers). In men, total sugars and fructose intake showed weak inverse association with risk of all cancers and lung cancer (Table 2). Those in the highest versus lowest quintile of total sugars, fructose and sucrose intake had approximately 30% lower risk of developing oral cancer. There was a statistically significant positive association between added sugars intake and risk of esophageal cancer. Further analysis by histological sub-type showed a strong risk of adenocarcinoma with high intake of added sugars (cases = 249) (HRQ5 vs. Q1: 1.81, 95% CI: 1.16–2.84; Ptrend = 0.008), and no risk for squamous cell carcinoma (cases = 79) (HRQ5 vs. Q1: 0.61, 95% CI: 0.29–1.26; Ptrend = 0.24). High intakes of total and added sugars were also strongly associated with increased risk of pleural cancer.
In men, added fructose, similar to total fructose, was associated with decreased risk of all cancers (HRQ5 vs. Q1: 0.94, 95% CI: 0.90–0.99; Ptrend = 0.006), and both added sucrose and added fructose were associated with decreased risk of oral cancer (added sucrose: HRQ5vs. Q1: 0.66, 95% CI: 0.50–0.88; Ptrend = 0.003; added fructose: HRQ5vs. Q1: 0.77, 95% CI: 0.59–1.01; Ptrend = 0.05). Reduced risks remained after controlling for fruit intake (data not shown).
Similar to findings in men, fructose intake in women was weakly inversely associated with risk of lung cancer; none of the other statistically significant associations observed in men were confirmed in women (Table 3). Women in the highest versus lowest quintile of fructose intake had 1.7 times higher risk of developing bladder cancer. Furthermore, total and added sugars intakes were positively associated with the risk of leukemia. Interestingly, we found all investigated sugars to be inversely associated with the risk of ovarian cancer. After controlling for fruit intake, all risk estimates remained unchanged (data not shown).
We also conducted further analyses on the effect of added sucrose and added fructose in women. Intake of added fructose was associated with increased risk of leukemia (HRQ5 vs Q1: 1.53, 95% CI: 0.98–2.38; Ptrend = 0.03) and decreased risk of lung cancer (HRQ5 vs. Q1: 0.87, 95% CI: 0.75–1.01; Ptrend = 0.03). Intake of added fructose and added sucrose were also statistically significantly inversely related to risk of ovarian cancer, although the estimates for the highest versus lowest quintile of intake did not reach statistical significance (added fructose, HRQ5 vs Q1: 0.72; 95% CI: 0.52–1.01; Ptrend = 0.03; added sucrose, HRQ5 vs. Q1: 0.76, 95% CI: 0.55–1.06; Ptrend = 0.02). High added fructose was strongly related to lower risk of liver cancer (HRT3 vs. T1: 0.43, 95% CI: 0.22–0.86; Ptrend = 0.02). Further, both added fructose and added sucrose were inversely associated with pancreatic cancer risk (added fructose, HRQ5 vs Q1: 0.67, 95% CI: 0.44–1.01; Ptrend = 0.05; added sucrose, HRQ5 vs Q1: 0.63, 95% CI: 0.42–0.94; Ptrend = 0.03). In contrast, there was a suggestion of an increased risk with high intake of naturally occurring fructose (HRQ5 vs. Q1: 1.44, 95% CI: 0.94–2.21; Ptrend = 0.05). Adjustment for HRT did not change any of the risk estimates (data not shown). Due to few cases of pleural cancer in women (n = 14), risk estimates for this site were not presented.
Gender-combined analysis showed similar results to those observed in men for oral, lung cancer (data not shown), and esophageal adenocarcinoma (cases = 269) (HRQ5 vs. Q1: 1.62, 95% CI: 1.07–2.45; Ptrend = 0.01), and revealed a statistically significant association between pleural cancer risk (cases = 116) and all sugars (HRQ5 vs Q1, 95% CI, Ptrend for total sugars: 2.54, 1.35–4.79, 0.01; fructose: 2.10, 1.12–3.97, 0.03; sucrose: 2.02, 1.10–3.69, 0.003; added sugars: 2.86, 1.43–5.71, 0.007; added fructose: 2.07, 1.10–3.89, 0.03; and added sucrose: 2.19, 1.17–4.0, 0.005, respectively). Furthermore, we observed a statistically significant elevated risk of small intestine cancer (n = 135) with high fructose (HRQ5 vs. Q1: 2.10, 95% CI: 1.06–4.16; Ptrend = 0.05) and added fructose intake (HRQ5 vs Q1: 2.20, 95% CI: 1.16–4.16; Ptrend = 0.009). None of the investigated sugars were associated with colorectal cancer risk in gender-combined or gender-specific analysis (see online Table 4 & 5).
In sensitivity analyses (data not shown), excluding BMI from the models for BMI-related cancers did not change any of the findings. In stratified analysis by BMI, we found statistically significant positive association between added sugars intake and risk of esophageal adenocarcinoma in overweight and obese (n = 207) (HRQ5 vs. Q1: 1.79, 95% CI: 1.10–2.93; Ptrend = 0.05). In normal-weight participants, the number of cases was low (n = 54) and the HRQ5 vs. Q1 was not statistically significant (1.59, 95% CI: 0.65–3.89; Ptrend = 0.08). No statistically significant associations were detected in BMI-stratified analysis for the other BMI-related cancers. In never smokers, we did not find reduced risk for oral and lung cancer in relation to sugars, and the increased risk for esophageal cancer was no longer statistically significant. In the partition models compared to findings from the substitution models, the positive associations with risk of esophageal and small intestinal cancer became stronger. In contrast, the reduced risk for oral cancer and the increased risk for bladder cancer and leukemia in women became statistically non-significant. The trend and direction of all other associations did not notably change.
Discussion
In the NIH-AARP Diet and Health cohort, none of the investigated sugars were associated with increased risk of colorectal cancer or with any other potentially IGF-I-related cancer (i.e. breast, prostate, pancreatic or endometrial cancer). In gender-combined analyses, added sugars were positively associated with risk of esophageal adenocarcinoma; fructose, particularly added fructose, were associated with risk of small intestinal cancer, and all investigated sugars were related to increased risk of pleural cancer. Total sugars, fructose and added fructose intake were associated with decreased risk of all cancers only among men. In women, all investigated sugars were inversely associated with risk of ovarian cancer. The observed positive findings for some rare cancers, as well as inconsistency in results between genders suggest a possibility for some chance results. We discuss our findings in light of the existing prospective evidence; case-control studies were reviewed only if no prospective data were available. Comparison with other studies though remains problematic as some studies investigated sugars as foods and not as nutrients, examined dietary patterns or defined variables differently (e.g. free vs. total fructose).
We observed a strong positive association between intake of added sugars and risk for esophageal adenocarcinoma. In a recent ecological analysis in the U.S., the rise in esophageal adenocarcinoma strongly paralleled the rise in percentage of energy intake from corn syrup as well as obesity for the period from 1973 to 199721. In our cohort, BMI was strongly associated with this type of malignancy22, however, omitting BMI from the model did not change the risk estimate, suggesting an independent effect of added sugars. The lack of statistical significance in normal weight participants, as well as in never smokers may have been due to low statistical power. Causes of the increasingly prevalent esophageal adenocarcinoma23 are largely unknown, and this finding provides an etiological clue for further investigation.
We observed more than 2-fold increase in risk for small intestine cancer with high fructose, especially high added fructose intake. An earlier case-control study suggested that sugars may be associated with small intestine adenocarcinoma, yet the assessment of sugars intake was crude, and based on sugars as foods24. We had a limited number of cases (n = 135), thus when more are accrued, further analyses by histological type in ours as well as other cohorts are warranted.
We observed a particularly strong risk of pleural cancer for all investigated sugars. Occupational and environmental exposures to asbestos are established risk factors25, and little is known about the possible dietary etiology of this malignancy. Although we could not control for participants’ occupation, we adjusted for their educational level, given that low education in this cohort was a strong risk factor for pleural cancer26. Occupation and education have been used interchangeably as proxy measures for socioeconomic status27. In our cohort, education was strongly associated with added sugars intake, but less so with total sugars. In addition, total and added sugars had opposite trends for proportion of current smokers across quintiles of intake. Nonetheless, for both total and added sugars, we observed robust risk estimates of a similar magnitude, suggesting that residual confounding from education or smoking may be an unlikely reason for these associations, although occupation still could not be entirely ruled out as a potential confounder.
In women, total sugars, added sugars and added fructose intakes were positively associated with risk of leukemia, and high fructose intake was associated with increased risk of bladder cancer. Although leukemia has been previously shown to be associated with obesity and the association was stronger in women than in men28, in our cohort, BMI was not a mediator of the effect. The observed association with bladder cancer was somewhat consistent with results from two case-control studies that reported increased risk with intake of foods high in added sugars29,30. However, for both leukemia and bladder cancer, the increased risk observed in the substitution model was no longer significant in the partition model. It may be that in the former, the increased risk occurred due to decreasing energy-contributing foods high in protective micronutrients and bioactive compounds, rather than increasing sugars intake.
All investigated sugars were inversely associated with risk of ovarian cancer. Only one cohort has investigated the effect of sugars other than lactose on ovarian cancer and found a suggestion of an increased risk for total sugars among post-menopausal women31. Ninety seven percent of the ovarian cancer cases in our cohort were post-menopausal. Few risk factors for ovarian cancer are known, thus, our findings may have been confounded by unknown factors or indicative of a dietary pattern.
In women, we also detected a decrease in risk of liver cancer with high added fructose intake, which may have been due to a chance or an unidentified confounder, given inconsistent results between men and women. An intriguing finding was the inverse association of added sucrose and added fructose with pancreatic cancer risk in women, whereas there was a suggestion of an increased risk with fructose from fruit. Contrary to the methods used here, an earlier analysis of the AARP cohort32, which included prevalent cases of any cancer except pancreatic cancer, as well as deceased pancreatic cancer cases (n = 1,151), reported 1.3-fold increased risk of pancreatic cancer in the highest versus lowest quintile of free fructose intakes (not including fructose from sucrose). Consistent with our findings, they also observed an increased risk for fructose from fruit and fruit juice32. A similar suggestion came from other cohorts, which showed elevated risk for pancreatic cancer with high intake of free fructose13, 33 and fruit, but not fruit juice13. Two cohorts, however, found no association between free fructose intake and pancreatic cancer risk34–35. The evidence for pancreatic cancer risk and other sugars is also inconclusive; the suggestion for an increased risk with total sugar intake found by one cohort13 was not confirmed by others34, 36; three cohorts found no association with sucrose intake 13, 33–34, and one found the association with sucrose confined to the first 2 years of follow-up35. In our analysis, we did not find an association between added sugars intake and pancreatic cancer risk, as earlier reported by this14 and another cohort13.
In our cohort, we could not confirm the finding for a positive association between high sugars intake and risk of colorectal cancer, mainly originating from case control studies2. Among previous cohorts37–41, one study showed an increased risk with both sucrose and fructose intake37, while others found neither sucrose nor fructose to be associated with risk37–38. None of the cohorts reported a significant association with total sugars intake39–41.
A few mechanisms can explain the role of sugars in carcinogenesis and they are likely to be site specific. The synthesis of insulin and IGF-I induced by the glycemic effect of diets high in added sugars may enhance tumour development through promoting cell proliferation and inhibiting apoptosis, stimulating synthesis of sex steroids3, or through promoting production of vascular endothelial growth factor (VEGF), which supports tumor growth, and promotes tumor cell migration42. Another potential mechanism is the increased oxidative stress induced by postprandial hyperglycemia4. As a potent reducing sugar43, fructose can produce advanced glycation end-products (AGEs), which may be involved in development and progression of cancers44. Fructose was also shown to increase serum uric acid, which can lead to insulin resistance and hyperinsulinemia45. Sugars, to the extent that they contribute to energy intake, may promote obesity, which by favoring insulin resistance and elevated levels of bio-active IGF-I, leptin, sex steroid hormone and pro-inflammatory factors may increase the risk for certain cancers46. We found no evidence of mediation or interaction effect by BMI for any of the obesity-related cancers suggesting that sugars may act through insulin, the IGF system or other mechanism independent of obesity.
We observed differences in the associations between men and women, which may have been due to behavioral, biological, genetic or hormonal gender differences, or due to the tendency among female respondents to report dietary intake differently than men47. Similarly to our positive findings, a previous report of the NIH-AARP study on the association of glycemic index (GI) and glycemic load (GL) and cancer risk found GI to be positively associated with esophageal cancer risk in men, and GL to be inversely associated with total cancer risk in men, and with risk of ovarian, liver and pancreatic cancer in women48.
Ours is the first cohort to investigate the association between different types of sugars and multiple malignancies. Apart from the evidence on highly prevalent cancers, the available epidemiologic data on sugars in relation to other cancer types have been limited, while our large sample size provided the opportunity to assess effects of sugars on rare cancers. A particular strength of the analysis is that we created cancer specific models pertinent to each cancer site, therefore carefully controlling for potential site-specific risk factors. We were also first to investigate the effect of added sugars, added sucrose and added fructose in relation to various cancers.
The problem of multiple comparisons is inherent to this type of analysis, and there is high probability that some of the findings may have occurred due to a chance. However, this is an exploratory and not a confirmatory analysis, and more detailed investigations with relevant risk factors, histological type, or cancer staging are warranted before any association with sugars intake is confirmed or ruled-out. Even though we adjusted for potential confounders, there is still a possibility of residual confounding, particularly from unknown risk factors in the analysis of under-investigated low-incidence cancers. Furthermore, the lack of reduced risk for lung and oral cancer in our never smokers, which was observed in the main analyses, suggests that the latter may have been due to residual negative confounding from smoking. The measurement error associated with self-reported intake of sugars, which are particularly prone to misreporting49, possibly affected the magnitude of the observed risk estimates and may have distorted the confidence intervals. Although it may be theoretically possible that the measurement error could have inflated the risk estimates for some of the cancers for which we are seeing significant results, it is much more likely that measurement error attenuated their true risk estimates, which in reality are even stronger; whereas for the cancers with weaker true association with sugars, it may have attenuated the association towards null.
In summary, in our large prospective study, we found no association between dietary sugars measured by an FFQ and risk of colorectal or any other major cancer. The problematic estimation of sugars intake renders the possibility that there still may be some associations to cancer risk that we have not been able to detect using the FFQ. Investigation of the effect of sugars densities in a substitution model vs. the effect of absolute sugars amounts in a partition model generated similar findings. The effects observed on some of the rare cancers, such as pleural, esophageal and small intestinal cancer, as well as on ovarian cancer, are intriguing and open questions on possible mechanisms, but may have been due to a chance, and warrants further investigation.
Supplementary Material
Acknowledgements
The investigators are indebted to all participants for their commitment to the NIH-AARP Diet and Health Study.
The authors' responsibilities were as follows— NT: developed the idea and the analytical strategy; analyzed and interpreted the data; and drafted the manuscript. LJ and NP: interpreted the data; contributed to the data analysis; and to drafting of the manuscript. AJC: interpreted the data; and contributed to data analysis. NT, JL and AFS: created the dietary variables; VK: provided statistical support; VK, AFS, AH and AS: helped with the conception and design of the NIH-AARP Diet and Health Study; acquired the data; and interpreted the data. NT, LJ, AJC, VK, AFS, AH, AS and NP: critically reviewed and revised the manuscript; and approved the final version of the manuscript.
Footnotes
Our report is the first comprehensive prospective analysis on the association between different types of dietary sugars and 24 malignancies, and it was conducted in approximately half a million participants. The public interest in this area of research remains high, as sugars, particularly from added sources, mark increasing trends in consumption over the past decades.
None of the authors had any conflicts of interest.
References
- 1.Popkin BM, Nielsen SJ. The sweetening of the world's diet. Obes Res. 2003;11:1325–1332. doi: 10.1038/oby.2003.179. [DOI] [PubMed] [Google Scholar]
- 2.World Cancer Research Fund (WCRF)/American Institute for Cancer Research (AICR) Food, Nutrition, Physical Activity and the prevention of Cancer: a Global Perspective. Washington DC: AICR; 2007. [Google Scholar]
- 3.Kaaks R, Lukanova A. Energy balance and cancer: the role of insulin and insulin-like growth factor-I. Proc Nutr Soc. 2001;60:91–106. doi: 10.1079/pns200070. [DOI] [PubMed] [Google Scholar]
- 4.Ceriello A, Bortolotti N, Motz E, Pieri C, Marra M, Tonutti L, Lizzio S, Feletto F, Catone B, Taboga C. Meal-induced oxidative stress and low-density lipoprotein oxidation in diabetes: the possible role of hyperglycemia. Metabolism. 1999;48:1503–1508. doi: 10.1016/s0026-0495(99)90237-8. [DOI] [PubMed] [Google Scholar]
- 5.World Health Organization (WHO)/Food and Agriculture Organization (FAO) Report of a Joint WHO/FAO Expert Consultation. Geneva, Switzerland: WHO; 2003. Diet, nutrition and the prevention of chronic diseases. [Google Scholar]
- 6.Thompson FE, McNeel TS, Dowling EC, Midthune D, Morrissette M, Zeruto CA. Interrelationships of added sugars intake, socioeconomic status, and race/ethnicity in adults in the United States: National Health Interview Survey, 2005. J Am Diet Assoc. 2009;109:1376–1383. doi: 10.1016/j.jada.2009.05.002. [DOI] [PMC free article] [PubMed] [Google Scholar]
- 7.Key TJ, Spencer EA. Carbohydrates and cancer: an overview of the epidemiological evidence. Eur J Clin Nutr. 2007;61(Suppl 1):S112–S121. doi: 10.1038/sj.ejcn.1602941. [DOI] [PubMed] [Google Scholar]
- 8.Burley VJ. Sugar consumption and cancers of the digestive tract. Eur J Cancer Prev. 1997;6:422–434. doi: 10.1097/00008469-199710000-00003. [DOI] [PubMed] [Google Scholar]
- 9.Burley VJ. Sugar consumption and human cancer in sites other than the digestive tract. Eur J Cancer Prev. 1998;7:253–277. doi: 10.1097/00008469-199808000-00002. [DOI] [PubMed] [Google Scholar]
- 10.Key TJ, Schatzkin A, Willett WC, Allen NE, Spencer EA, Travis RC. Diet, nutrition and the prevention of cancer. Public Health Nutr. 2004;7:187–200. doi: 10.1079/phn2003588. [DOI] [PubMed] [Google Scholar]
- 11.Johnson IT, Southgate DA, Durnin JV. Intrinsic and non-milk extrinsic sugars: does the distinction have analytical or physiological validity? Int J Food Sci Nutr. 1996;47:131–140. doi: 10.3109/09637489609012574. [DOI] [PubMed] [Google Scholar]
- 12.Oettle GJ, Emmett PM, Heaton KW. Glucose and insulin responses to manufactured and whole-food snacks. Am J Clin Nutr. 1987;45:86–91. doi: 10.1093/ajcn/45.1.86. [DOI] [PubMed] [Google Scholar]
- 13.Nothlings U, Murphy SP, Wilkens LR, Henderson BE, Kolonel LN. Dietary glycemic load, added sugars, and carbohydrates as risk factors for pancreatic cancer: the Multiethnic Cohort Study. Am J Clin Nutr. 2007;86:1495–1501. doi: 10.1093/ajcn/86.5.1495. [DOI] [PubMed] [Google Scholar]
- 14.Bao Y, Stolzenberg-Solomon R, Jiao L, Silverman DT, Subar AF, Park Y, Leitzmann MF, Hollenbeck A, Schatzkin A, Michaud DS. Added sugar and sugar-sweetened foods and beverages and the risk of pancreatic cancer in the National Institutes of Health-AARP Diet and Health Study. Am J Clin Nutr. 2008;88:431–440. doi: 10.1093/ajcn/88.2.431. [DOI] [PMC free article] [PubMed] [Google Scholar]
- 15.Schatzkin A, Subar AF, Thompson FE, Harlan LC, Tangrea J, Hollenbeck AR, Hurwitz PE, Coyle L, Schussler N, Michaud DS, Freedman LS, Brown CC, et al. Design and serendipity in establishing a large cohort with wide dietary intake distributions: the NIH-AARP Diet and Health Study. Am J Epidemiol. 2001;154:1119–1125. doi: 10.1093/aje/154.12.1119. [DOI] [PubMed] [Google Scholar]
- 16.World Health Organization (WHO) International Classification of Diseases for Oncology. Third Edition. Geneva, Switzerland: WHO; 2000. [Google Scholar]
- 17.Subar AF, Midthune D, Kulldorff M, Brown CC, Thompson FE, Kipnis V, Schatzkin A. Evaluation of alternative approaches to assign nutrient values to food groups in food frequency questionnaires. Am J Epidemiol. 2000;152:279–286. doi: 10.1093/aje/152.3.279. [DOI] [PubMed] [Google Scholar]
- 18.U.S. Department of Agriculture (USDA) Database for the Added Sugars Content of Selected Foods. Release 1. Beltsville, Maryland: USDA; 2006. [Google Scholar]
- 19.Kelly SA, Summerbell C, Rugg-Gunn AJ, Adamson A, Fletcher E, Moynihan PJ. Comparison of methods to estimate non-milk extrinsic sugars and their application to sugars in the diet of young adolescents. Br J Nutr. 2005;94:114–124. doi: 10.1079/bjn20051448. [DOI] [PubMed] [Google Scholar]
- 20.Millen AE, Midthune D, Thompson FE, Kipnis V, Subar AF. The National Cancer Institute diet history questionnaire: validation of pyramid food servings. Am J Epidemiol. 2006;163:279–288. doi: 10.1093/aje/kwj031. [DOI] [PubMed] [Google Scholar]
- 21.Thompson CL, Khiani V, Chak A, Berger NA, Li L. Carbohydrate consumption and esophageal cancer:an ecological assessment. Am J Gastroenterol. 2008;103:555–561. doi: 10.1111/j.1572-0241.2007.01613.x. [DOI] [PubMed] [Google Scholar]
- 22.Abnet CC, Freedman ND, Hollenbeck AR, Fraumeni JF, Jr, Leitzmann M, Schatzkin A. A prospective study of BMI and risk of oesophageal and gastric adenocarcinoma. Eur J Cancer. 2008;44:465–471. doi: 10.1016/j.ejca.2007.12.009. [DOI] [PMC free article] [PubMed] [Google Scholar]
- 23.Devesa SS, Blot WJ, Fraumeni JF., Jr Changing patterns in the incidence of esophageal and gastric carcinoma in the United States. Cancer. 1998;83:2049–2053. [PubMed] [Google Scholar]
- 24.Wu AH, Yu MC, Mack TM. Smoking, alcohol use dietary factors and risk of small intestinal adenocarcinoma. Int J Cancer. 1997;70:512–517. doi: 10.1002/(sici)1097-0215(19970304)70:5<512::aid-ijc4>3.0.co;2-0. [DOI] [PubMed] [Google Scholar]
- 25.Hughes RS. Malignant pleural mesothelioma. Am J Med Sci. 2005;329:29–44. doi: 10.1097/00000441-200501000-00007. [DOI] [PubMed] [Google Scholar]
- 26.Mouw T, Koster A, Wright ME, Blank MM, Moore SC, Hollenbeck A, Schatzkin A. Education and risk of cancer in a large cohort of men and women in the United States. PLoS One. 2008;3:e3639. doi: 10.1371/journal.pone.0003639. [DOI] [PMC free article] [PubMed] [Google Scholar]
- 27.Davey Smith G, Hart C, Hole D, MacKinnon P, Gillis C, Watt G, Blane D, Hawthorne V. Education and occupational social class: which is the more important indicator of mortality risk? J Epidemiol Community Health. 1998;52:153–160. doi: 10.1136/jech.52.3.153. [DOI] [PMC free article] [PubMed] [Google Scholar]
- 28.Renehan AG, Tyson M, Egger M, Heller RF, Zwahlen M. Body-mass index and incidence of cancer: a systematic review and meta-analysis of prospective observational studies. Lancet. 2008;371:569–578. doi: 10.1016/S0140-6736(08)60269-X. [DOI] [PubMed] [Google Scholar]
- 29.De Stefani E, Boffetta P, Ronco AL, Deneo-Pellegrini H, Acosta G, Mendilaharsu M. Dietary patterns and risk of bladder cancer: a factor analysis in Uruguay. Cancer Causes Control. 2008;19:1243–1249. doi: 10.1007/s10552-008-9195-9. [DOI] [PubMed] [Google Scholar]
- 30.Riboli E, Gonzalez CA, Lopez-Abente G, Errezola M, Izarzugaza I, Escolar A, Nebot M, Hemon B, Agudo A. Diet and bladder cancer in Spain: a multi-centre case-control study. Int J Cancer. 1991;49:214–219. doi: 10.1002/ijc.2910490212. [DOI] [PubMed] [Google Scholar]
- 31.Silvera SA, Jain M, Howe GR, Miller AB, Rohan TE. Glycaemic index, glycaemic load and ovarian cancer risk: a prospective cohort study. Public Health Nutr. 2007;10:1076–1081. doi: 10.1017/S1368980007696360. [DOI] [PubMed] [Google Scholar]
- 32.Jiao L, Flood A, Subar AF, Hollenbeck AR, Schatzkin A, Stolzenberg-Solomon R. Glycemic index, carbohydrates, glycemic load, and the risk of pancreatic cancer in a prospective cohort study. Cancer Epidemiol Biomarkers Prev. 2009;18:1144–1151. doi: 10.1158/1055-9965.EPI-08-1135. [DOI] [PMC free article] [PubMed] [Google Scholar]
- 33.Michaud DS, Liu S, Giovannucci E, Willett WC, Colditz GA, Fuchs CS. Dietary sugar, glycemic load, and pancreatic cancer risk in a prospective study. J Natl Cancer Inst. 2002;94:1293–1300. doi: 10.1093/jnci/94.17.1293. [DOI] [PubMed] [Google Scholar]
- 34.Silvera SA, Rohan TE, Jain M, Terry PD, Howe GR, Miller AB. Glycemic index, glycemic load, and pancreatic cancer risk (Canada) Cancer Causes Control. 2005;16:431–436. doi: 10.1007/s10552-004-5028-7. [DOI] [PubMed] [Google Scholar]
- 35.Meinhold CL, Dodd KW, Jiao L, Flood A, Shikany JM, Genkinger JM, Hayes RB, Stolzenberg-Solomon RZ. Available carbohydrates, glycemic load, and pancreatic cancer: is there a link? Am J Epidemiol. 2010;171:1174–1182. doi: 10.1093/aje/kwq061. [DOI] [PMC free article] [PubMed] [Google Scholar]
- 36.Heinen MM, Verhage BA, Lumey L, Brants HA, Goldbohm RA, van den Brandt PA. Glycemic load, glycemic index, and pancreatic cancer risk in the Netherlands Cohort Study. Am J Clin Nutr. 2008;87:970–977. doi: 10.1093/ajcn/87.4.970. [DOI] [PubMed] [Google Scholar]
- 37.Michaud DS, Fuchs CS, Liu S, Willett WC, Colditz GA, Giovannucci E. Dietary glycemic load, carbohydrate, sugar, and colorectal cancer risk in men and women. Cancer Epidemiol Biomarkers Prev. 2005;14:138–147. [PubMed] [Google Scholar]
- 38.Howarth NC, Murphy SP, Wilkens LR, Henderson BE, Kolonel LN. The association of glycemic load and carbohydrate intake with colorectal cancer risk in the Multiethnic Cohort Study. Am J Clin Nutr. 2008;88:1074–1082. doi: 10.1093/ajcn/88.4.1074. [DOI] [PMC free article] [PubMed] [Google Scholar]
- 39.Kabat GC, Shikany JM, Beresford SA, Caan B, Neuhouser ML, Tinker LF, Rohan TE. Dietary carbohydrate, glycemic index, and glycemic load in relation to colorectal cancer risk in the Women's Health Initiative. Cancer Causes Control. 2008;19(10):1291–1298. doi: 10.1007/s10552-008-9200-3. [DOI] [PMC free article] [PubMed] [Google Scholar]
- 40.Terry PD, Jain M, Miller AB, Howe GR, Rohan TE. Glycemic load, carbohydrate intake, and risk of colorectal cancer in women: a prospective cohort study. J Natl Cancer Inst. 2003;95:914–916. doi: 10.1093/jnci/95.12.914. [DOI] [PubMed] [Google Scholar]
- 41.Terry P, Giovannucci E, Michels KB, Bergkvist L, Hansen H, Holmberg L, Wolk A. Fruit, vegetables, dietary fiber, and risk of colorectal cancer. J Natl Cancer Inst. 2001;93:525–533. doi: 10.1093/jnci/93.7.525. [DOI] [PubMed] [Google Scholar]
- 42.Bustin SA, Jenkins PJ. The growth hormone-insulin-like growth factor-I axis and colorectal cancer. Trends Mol Med. 2001;7:447–454. doi: 10.1016/s1471-4914(01)02104-9. [DOI] [PubMed] [Google Scholar]
- 43.Levi B, Werman MJ. Fructose and related phosphate derivatives impose DNA damage and apoptosis in L5178Y mouse lymphoma cells. J Nutr Biochem. 2003;14:49–60. doi: 10.1016/s0955-2863(02)00254-1. [DOI] [PubMed] [Google Scholar]
- 44.Abe R, Yamagishi S. AGE-RAGE system and carcinogenesis. Curr Pharm Des. 2008;14:940–945. doi: 10.2174/138161208784139765. [DOI] [PubMed] [Google Scholar]
- 45.Nakagawa T, Hu H, Zharikov S, Tuttle KR, Short RA, Glushakova O, Ouyang X, Feig DI, Block ER, Herrera-Acosta J, Patel JM, Johnson RJ. A causal role for uric acid in fructose-induced metabolic syndrome. Am J Physiol Renal Physiol. 2006;290:F625–F631. doi: 10.1152/ajprenal.00140.2005. [DOI] [PubMed] [Google Scholar]
- 46.Renehan AG, Frystyk J, Flyvbjerg A. Obesity and cancer risk: the role of the insulin-IGF axis. Trends Endocrinol Metab. 2006;17:328–336. doi: 10.1016/j.tem.2006.08.006. [DOI] [PubMed] [Google Scholar]
- 47.Krebs-Smith SM, Graubard BI, Kahle LL, Subar AF, Cleveland LE, Ballard-Barbash R. Low energy reporters vs others: a comparison of reported food intakes. Eur J Clin Nutr. 2000;54:281–287. doi: 10.1038/sj.ejcn.1600936. [DOI] [PubMed] [Google Scholar]
- 48.George SM, Mayne ST, Leitzmann MF, Park Y, Schatzkin A, Flood A, Hollenbeck A, Subar AF. Dietary glycemic index, glycemic load, and risk of cancer: a prospective cohort study. Am J Epidemiol. 2009;169:462–472. doi: 10.1093/aje/kwn347. [DOI] [PMC free article] [PubMed] [Google Scholar]
- 49.Poppitt SD, Swann D, Black AE, Prentice AM. Assessment of selective under-reporting of food intake by both obese and non-obese women in a metabolic facility. Int J Obes Relat Metab Disord. 1998;22:303–311. doi: 10.1038/sj.ijo.0800584. [DOI] [PubMed] [Google Scholar]
- 50.Bowman SA, Friday JE, Moshfegh AJ. Food Surveys Research Group. Beltsville Human Nutrition Research Center, Agricultural Research Service. Beltsville, MD: U.S. Department of Agriculture; 2008. MyPyramid Equivalents Database, 2.0 for USDA Survey Foods, 2003–2004 [Online]. Available at: http://www.ars.usda.gov/ba/bhnrc/fsrg. [Google Scholar]
Associated Data
This section collects any data citations, data availability statements, or supplementary materials included in this article.