

Bioluminescence imaging (BLI) makes use of light-generating luciferase enzymes, most commonly firefly luciferase (FLuc), Renilla reniformis luciferase or Gaussia luciferase in combination with their appropriate substrates.[1] Noninvasive BLI of living subjects has become a routine technique in cancer biology research because it enables monitoring of gene expression, gene delivery, tumor growth, enzyme activity, response to experimental drug therapies, and protein-protein interactions.[2]
The major limitation in in vivo BLI experiments is absorption and scattering of light by tissue, which results in strong attenuation of BL signal emitted below 600 nm.[3] The yellow-green BL emission from the native FLuc (D-luciferin substrate, λem,max=553–559 nm),[4] which is the most red-shifted native bioluminescent system, decreases substantially with tissue depth. Consequently applications of this system are restricted mainly to small animals at superficial depths. To overcome this limitation, red-shifted variants of native FLuc have been selected using random mutagenesis.[5] Considerable efforts have also been directed toward the development of analogues of D-luciferin[6] that produce longer wavelength light, an orthogonal approach to enzyme engineering. A recent report describes the development of a D-luciferin analogue, which emits in the near-infrared region.[6e] This analogue is an aminoluciferin-Cy5 conjugate and is based on bioluminescence resonance energy transfer (BRET). This type of modification, however, alters the cellular uptake properties of the substrate and likely changes its biodistribution in vivo. Here we describe a simple modification to D-luciferin, a selenium analogue, which exhibits red-shifted BL emission, and we demonstrate its use for in vivo BLI.
We designed a D-luciferin analogue containing a selenium atom substitution for the native sulphur atom at position 1 (3c). We hypothesized that this replacement would red shift the emission maximum because of the polar effect of the selenium atom, which has been previously reported in fluorophores.[7] Furthermore, it is known that several enzymes recognize selenium analogues equally well as the natural sulphur-containing substrates,[8] making it likely that the derivative would be an efficient luciferase substrate. Finally, on account of the red shift induced by the 6′-amino substituent in 3b, and the usefulness of the amino group in the preparation of bioluminogenic substrates,[2d,9] we chose to preserve this functionality in our design.
The synthesis of native luciferin 3a[10b–d] and its analogue 6′-aminoluciferin 3b[6b] is straightforward and involves a condensation reaction[10] between 2-cyanobenzothiazole 1a,b and cysteine 2a. 3b is a competent substrate for FLuc and exhibits red-shifted BL with λem,max =578 nm.[11] The only known D-luciferin analogues tolerated by native FLuc consist of 4′- or 6′-substitutions on the benzothiazole ring[6a–b] and substitution of the benzothiazole for naphthalene or quinoline,[12] though aliphatic[6c] and cyclic alkylaminoluciferin[6f] substrates can generate light with mutated variants of FLuc. We coupled seleno-D-cysteine 2b with 2-cyano-6-aminobenzothiazole 1b at room temperature in 0.5 M Tris-HCl (pH 7.5) buffer with 13% DMSO to afford aminoseleno-D-luciferin 3c. The product was isolated by HPLC in 78% yield. Because the L-enantiomer of luciferin generates no BL signal but inhibits FLuc,[13] it is desirable to employ enantiomerically pure seleno-D-cysteine 2b in the synthesis, which can be prepared from elemental selenium.[14] In this manner, [75Se]3c and [77Se]3c for dual modality BLI/PET and BLI/MRI, respectively, are readily accessible. Finally, we note that other chalcogen-substituted cysteines, such as tellurocysteine 2c, which is known to react analogously to 2a, might also be successfully incorporated in the reaction shown in Scheme 1.
Scheme 1.

Structure and synthesis of D-luciferin (3a), amino-D-luciferin (3b) and designed aminoseleno-D-luciferin (3c).
The absorbance spectra of amino-D-luciferin 3b and its selenium analogue, aminoseleno-D-luciferin 3c, are nearly identical with both containing a local maximum at 350 nm in 50 mM Tris-HCl (pH 7.5) buffer, and the molar absorptivities were determined to be 15,100 M −1cm−1 and 15,500 M−1cm−1, respectively. The value for 3b is in good agreement with a previous measurement in 95% ethanol (15,500 M−1 cm−1).[6a]
In the presence of ATP, Mg2+, and oxygen, 3c is a competent substrate for purified native FLuc, emitting red BL that is readily distinguished from the yellow-green BL of D-luciferin 3a and the orange BL of amino-D-luciferin 3c (Figure 1a). The BL emission maxima for 3a, 3b, and 3c were 559 nm, 588 nm, and 600 nm, respectively (Figure 1b). The red-shifted BL of 3c also persists at 37 °C (data not shown). The percentage of integrated BL emission above 600 nm—an important figure of merit for transmission through tissue in in vivo BLI—for 3c is 55%, which is higher than the values for 3a and 3b, 23% and 41%, respectively.
Figure 1.

a) Bioluminescence photographic images of 3a (left), 3b (middle), and 3c (right). b) In vitro bioluminescence spectra of 3a, 3b, and 3c at 23 °C.
To determine the apparent Michaelis constant Km of 3c, which is defined as the substrate concentration at half of the maximum reaction velocity, the initial rate of luminescence was measured as a function of substrate concentration and plotted in Figure 2a. The reaction of FLuc with 3c exhibits typical Michaelis-Menten kinetics, as evidenced by the linearity of the Lineweaver-Burk plot (Figure 2b). Nonlinear regression analysis of the Michaelis-Menten plot (Figure 2a) generated a Km of 0.70 ± 0.04 μM for 3c, which is not statistically different by t-test from the value reported for 3b, 0.62 ± 0.05 μM (see Supporting Information).[11] Thus, substitution of the sulphur atom for selenium does not appreciably perturb the affinity of the substrate for FLuc.
Figure 2.
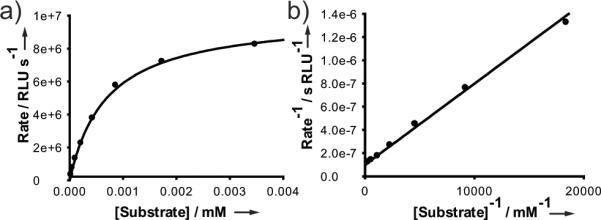
a) Michaelis-Menten plot for 3c using light output from luminescence as a readout of the reaction rate. b) The same data represented in a Lineweaver-Burk plot.
To compare the emission rates of 3b and 3c under biologically relevant conditions, both substrates were incubated with a human breast adenocarcinoma cell line (MDA-MB-468) that stably expressed FLuc. The time course of BL emission in cell culture for each substrate, shown in Figure 3, qualitatively resembles the in vitro time course obtained using purified FLuc (see Supporting Information). Following an initial period characterized by flash kinetics, 3c exhibited a lower and more stable basal emission rate relative to 3b; after 10 min, the signal from 3b decayed in a quasi-linear manner with an emission rate decrease of approximately 2.5×10⁴ photons s−1 min−1 (R2 = 0.994) while 3c decayed considerably slower. Extrapolation of each line to y = 0 followed by integration of the area under each curve indicates that 3c emitted approximately 74% the number of photons of 3b (see Supporting Information), suggesting a lower quantum yield for 3c if equal numbers of molecules reacted. Indeed, more efficient non-radiative relaxation would be expected for 3c on account of the well known heavy-atom effect.[15] A reduced quantum yield is not sufficient to explain the differences in the kinetic profiles of 3b and 3c, however. Recent work by Ribiero et al.[16a] indicates that dehydroluciferyl adenylate (L-AMP), a non-BL byproduct of the reaction,[17] behaves as a potent competitive inhibitor of FLuc (Ki = 3.8 nM),[16,18] and is responsible for much of the early decrease in BL. The faster initial decay of 3c and its lower basal level could be explained by the dehydroaminoselenoluciferyl-AMP byproduct having a lower Ki than the corresponding sulphur analogue.
Figure 3.

a) Time course of baseline-corrected BL from equimolar solutions of 3b and 3c in cell suspensions of MDA-MB-468 expressing FLuc. Lines represent the least squares best fits for the quasi-linear basal signals from 3b and 3c after 10 min. b) False-color BL intensity images superimposed on the corresponding white light images of the wells at various times.
The in vivo performance of 3c was also compared to 3b in nude mice bearing subcutaneous tumor xenografts of an MDA-MB-468 cell line constitutively expressing FLuc (FLuc+). Each mouse was sequentially injected with either substrate, with a 5 h delay observed between substrates to allow for enzyme recovery and substrate clearance. Following tail vein injection of either substrate into mice (n = 4), BL emission was imaged at several time points (Figure 4a). To account for differences in tumor sizes among the mice, BL at each time point and for each substrate was normalized to the maximum BL signal. This always occurred with substrate 3b at the first time point (t = 1 min). The normalized BL values for each substrate were averaged at each time point and plotted with their standard deviations (Figure 4b).
Figure 4.

a) Representative BLI of a nude mouse implanted with FLuc+ MDA-MB-468 xenografts after i.v. injection of either 3b or 3c. b) Time course of tumor-localized BL after i.v. injection of either 3b or 3c into mice implanted with FLuc+ MDA-MB-468 xenografts. Each data point represents the average baseline-corrected BL signal from four mice. To account for variations in tumor size, BL signals for each tumor were normalized to the maximum signal obtained from that tumor before averaging; the maximum signal was always obtained with substrate 3c at t = 5 min. y-Error bars show the standard deviation of BL.
In contrast to in vitro studies, the time courses of in vivo BL for 3b and 3c are comparable; with the exception of the 5 min time point in Figure 4b, there is no statistically significant difference between the substrates (P > 0.05). The discrepancy between in vitro and in vivo experiments cannot be fully explained by the theoretically higher penetration of the red-shifted BL of 3c through tissue (~34%) because this effect is more than offset by its slower emission rate (see Figure 3). The differentially improved performance of 3c in in vivo imaging may be attributed to some organism-level process, such as temperature regulation, perfusion, biodistribution, or elimination.[19] We note that such a process need only induce a small change in the steady-state concentration of a potent inhibitor species (e.g., L-AMP) relative to in vitro conditions to induce a large change in the BL emission kinetics.
In conclusion, we have described the first selenium-containing luciferin 3c and demonstrated that it is a competent substrate for native FLuc, exhibiting a red-shifted BL maximum relative to its sulphur-containing analogue 3b. Though the substitution does not decrease the substrate's affinity for FLuc, it results in less light output in vitro, due in part to a lower quantum yield. For in vivo BLI applications, the substitution is benign; it has no net effect on the emission kinetics, likely due to a trade-off between greater tissue penetration of the BL emission and lower quantum yield.
Our demonstration of the feasibility of chalcogen substitution without a detrimental effect upon in vivo BLI enables the prospect of luciferin probes for multimodal imaging. One implementation for BLI/MRI relies upon the ability of FLuc to catalyze the conversion of luciferin to oxyluciferin, for which the enol tautomer is the predominant ground-state species.[20] Thus, the chalcogen at position 1, which is singly allylic in the substrate, becomes doubly allylic in the product. As both 77Se and 125Te are stable spin-½ nuclei with narrow lines and a wide range of chemical shifts, this chemical shift change is, in principle, detectable by MRI; we suspect that hyperpolarization might be required for the low sensitivity 77Se nucleus.21 If successful, this method could be generally applied to BL/MR imaging of any luciferase-expressing mouse tumor model.
Experimental Section
Synthesis of 3c
Seleno-D-cystine (5.7 mg, 0.017 mmol), synthesized according to ref. 14, was reduced to 2b by incubation in a Tris-HCl (0.5 M, pH 7.5, 2.1 mL) solution of tris(2-carboxyethyl)phosphine hydrochloride (14.7 mg, 0.0513 mmol) for 5 min. The aqueous solution of 2b (0.034 mmol, 2 eq) was added to a solution of 1b (3.0 mg, 0.017 mmol, 1 eq) in DMSO (300 μL), mixed thoroughly, and allowed to react for 1.5 h at room temperature under an atmosphere of nitrogen. Aliquots of the reaction mixture were separated by reverse-phase HPLC using an Acclaim 120 C18 column with gradient elution (0% to 85% acetonitrile with water balance over 30 minutes; both elution solvents contained 0.1% trifluoroacetic acid; 1 mL/min flow-rate). Upon elution, fractions of 3c were combined and subjected to rotary evaporation, yielding 3c as a light-yellow solid (78%).
Bioluminescence photos
The photos in Figure 1a were taken in the dark with a Nikon D70 digital camera equipped with an AF-S Nikkor 18–70 mm DX lens. BL solutions were prepared as described for the BL spectra (vide infra), but on a larger scale and with 10× the concentration of FLuc. To collect the maximum amount of light, the largest available aperture size was employed (f3.5). Integration times were 10 s for 3a and 30 s for 3b and 3c.
Bioluminescence spectra
To a solution containing 40 μL of pH 7.4 PBS buffer (Dulbecco's, 1×), 20 μL of ATP buffer (Stratagene; 0.5 mM ATP, 0.5 mM CoA, 10 mM Mg(II) sulfate, pH 7.8), and 1 μL of 1.5 mM luciferin substrate 3 in pH 7.4 PBS buffer was added 5.0 μL of FLuc solution (130 μg mL−1 in pH 7.4 PBS buffer containing 1% BSA) with mixing, and incubated in a small-volume cuvette (Starna, 16.40F-Q-10/Z15) for 2 min to allow the BL signal to stabilize. Spectra were collected using a wavelength-calibrated FluoroMax-3 fluorimeter (Horiba Jobin Yvon) with a blocked excitation path (0.5 s integration time; 1 nm increments; 10 nm emission slit).
Determination of Km
Two-fold serial dilutions of 3c were performed using 1× PBS (pH 7.4) to give eight 50 μL solutions ranging in concentration from 32.3 μM to 0.252 μM, each in a 1.5 ml microfuge tube. To each tube was added 100 μL of Luciferase Assay Buffer II (Promega) supplemented with 3.31 mg/ml ATP (6 mM). Immediately before measuring the luminescence of a sample, 50 μL of a freshly prepared 1.1 μg/ml QuantiLum Recombinant Luciferase (Promega) solution in 1× PBS was added to the tube. The solution was briefly vortexed, and the resulting luminescence emission was measured over 10s using a Turner Biosystems 20/20n luminometer. Km was determined by nonlinear regression analysis of the Michaelis-Menten plot using the Enzyme Kinetics Wizard in the SigmaPlot 12.0 software package.
Cell culture kinetics
To a 60 μL suspension of ~ 6×10⁴ MDA-MB-468 FLuc+ cells in pH 7.4 PBS buffer was added 20 μL of 100 μM substrate 3b or 3c in pH 7.4 PBS buffer with gentle mixing. The time course of BL was measured using an IVIS200 with 10 s integration at each time point (no emission filter).
In vivo kinetics
All animal handling was performed in accordance with Stanford University's Animal Research Committee guidelines. Nude, athymic mice were subcutaneously implanted with 107 MDA-MB-468 FLuc+ cells at a single site. Once tumors grew to ~5 mm in diameter (~10 days), the mice were injected with 100 μL of 2.5 mM substrate 3b or 3c via the tail vein. Mice were anesthetized with isoflurane, and the time course of BL emission from the tumor was measured using IVIS200 with 30 s integration at each time point (no emission filter). Each substrate was tested in four different mice, and a 5 h delay between same-mouse experiments was employed to allow for clearance and FLuc recovery. In the absence of substrate, mice exhibited no BL. No toxic effects were observed with 3c.
Supplementary Material
Footnotes
This work was supported by grants 1R01GM086196-01, 1P20-HG003638, R01CA135294 and ICMIC P50CA114747 from the NIH. We thank Gaolin Liang and Winston Wei for their assistance with mice imaging and Eric Johnson at Bruker BioSpin for his assistance with NMR experiments.
Supporting information for this article is available on the WWW under http://www.angewandte.org or from the author.
References
- [1].Close DM, Xu T, Sayler GS, Ripp S. Sensors. 2011;11:180–206. doi: 10.3390/s110100180. [DOI] [PMC free article] [PubMed] [Google Scholar]
- [2].a) Dothager RS, Flentie K, Moss B, Pan M-H, Kesarwala A, Piwnica-Worms D. Curr. Opin. Biotechnol. 2009;20:45–53. doi: 10.1016/j.copbio.2009.01.007. [DOI] [PMC free article] [PubMed] [Google Scholar]; b) Contag CH, Bachmann MH. Annu. Rev. Biomed. Eng. 2002;4:235–260. doi: 10.1146/annurev.bioeng.4.111901.093336. [DOI] [PubMed] [Google Scholar]; c) Söling A, Rainov NG. Expert Opin. Biol. Ther. 2003;3:1163–1172. doi: 10.1517/14712598.3.7.1163. [DOI] [PubMed] [Google Scholar]; d) Dragulescu-Andrasi A, Liang G, Rao J. Bioconjug. Chem. 2009;20:1660–1666. doi: 10.1021/bc9002508. [DOI] [PMC free article] [PubMed] [Google Scholar]; e) Liu JJ, Wang W, Dicker DT, El-Deiry WS. Cancer Biol. Ther. 2005;4:885–892. doi: 10.4161/cbt.4.8.2133. [DOI] [PubMed] [Google Scholar]; f) Chan CT, Paulmurugan R R, Gheysens OS, Kim J, Chiosis G, Gambhir SS. Cancer Res. 2008;68:216–226. doi: 10.1158/0008-5472.CAN-07-2268. [DOI] [PMC free article] [PubMed] [Google Scholar]; g) Dragulescu-Andrasi A, Chan CT, De A, Massoud TF, Gambhir SS. Proc. Natl. Acad. Sci. USA. 2011;108:12060–12065. doi: 10.1073/pnas.1100923108. [DOI] [PMC free article] [PubMed] [Google Scholar]; h) Yao H, So M-K, Rao J. Angew. Chem. Intl. Ed. 2007;46:7031–7034. doi: 10.1002/anie.200701931. [DOI] [PubMed] [Google Scholar]
- [3].Negrin RS, Contag CH. Nat. Rev. Immunol. 2006;6:484–490. doi: 10.1038/nri1879. [DOI] [PubMed] [Google Scholar]
- [4].Naumov P, Ozawa Y, Ohkubo K, Fukuzumi S. J. Am. Chem. Soc. 2009;131:11590–11605. doi: 10.1021/ja904309q. [DOI] [PubMed] [Google Scholar]
- [5].a) Branchini BR, Southworth TL, Khattak NF, Michelini E, Roda A. Anal. Biochem. 2005;345:140–148. doi: 10.1016/j.ab.2005.07.015. [DOI] [PubMed] [Google Scholar]; b) Branchini BR, Ablamsky DM, Murtiashaw MH, Uzasci L, Fraga H, Southworth TL. Anal. Biochem. 2007;361:253–262. doi: 10.1016/j.ab.2006.10.043. [DOI] [PubMed] [Google Scholar]; c) Kajiyama N, Nakano E. Protein Eng. 1991;4:691–693. doi: 10.1093/protein/4.6.691. [DOI] [PubMed] [Google Scholar]; d) Caysa H, Jacob R, Müther N, Branchini B, Messerle M, Söling A. Photochem. Photobiol. Sci. 2009;8:52–56. doi: 10.1039/b814566k. [DOI] [PubMed] [Google Scholar]
- [6].a) White EH, Wörther H. J. Org. Chem. 1966;31:1484–1488. doi: 10.1021/jo01343a039. [DOI] [PubMed] [Google Scholar]; b) White EH, Wörther H, Seliger HH, McElroy WD. J. Am. Chem. Soc. 1966;88:2015–2019. [Google Scholar]; c) Woodroofe CC, Shultz JW, Wood MG, Osterman J, Cali JJ, Daily WJ, Meisenheimer PL, Klaubert DH. Biochemistry. 2008;47:10383–10393. doi: 10.1021/bi800505u. [DOI] [PubMed] [Google Scholar]; d) Though the keto-constrained 5,5-diMeLH2 does not produce light with FLuc, synthetic adenylate 5,5-diMeLH2-AMP produces slow and sustained BL with FLuc: Branchini BR, Murtiashaw MH, Magyar RA, Portier NC, Ruggiero MC, Stroh JG. J. Am. Chem. Soc. 2002;124:2112–2113. doi: 10.1021/ja017400m.. Takakura H, Kojima R, Urano Y, Terai T, Hanaoka K, Nagano T. Chem. Asian J. 2011;6:1800–1810. doi: 10.1002/asia.201000873.; Reddy GR, Thompson WC, Miller SC. J. Am. Chem. Soc. 2010;132:13586–13587. doi: 10.1021/ja104525m.
- [7].Yamashita Y, Ono K, Tomura M, Tanaka S. Tetrahedron. 1997;53:10169–10178. [Google Scholar]; b) Detty MR, Prasad PN, Donnelly DJ, Ohulchanskyy T, Gibson SL, Hilf R. Bioorg. Med. Chem. 2004;12:2537–2544. doi: 10.1016/j.bmc.2004.03.029. [DOI] [PubMed] [Google Scholar]
- [8].a) De Marco C, Rinaldi A, Dessí MR, Dernini S. Mol. Cell. Biochem. 1976;12:89–92. doi: 10.1007/BF01731554. [DOI] [PubMed] [Google Scholar]; b) Shrift A. Fed. Proc. 1961;20:695–702. [Google Scholar]; c) De Marco C, Rinaldi A, Dessí MR, Corda M. Ital. J. Biochem. 1976;25:382–389. [PubMed] [Google Scholar]
- [9].Monsees T, Miska W, Geiger R. Anal. Biochem. 1994;221:329–334. doi: 10.1006/abio.1994.1421. [DOI] [PubMed] [Google Scholar]
- [10].a) Baganz H, Domaschke L. Chem. Ber. 1962;95:1842–1843. doi: 10.1002/ardp.19622951006. [DOI] [PubMed] [Google Scholar]; b) White EH, McCapra F, Field GF. J. Am. Chem. Soc. 1963;85:337–343. [Google Scholar]; c) White EH, Wörther H, Field GF, McElroy WD. J. Org. Chem. 1965;30:2344–2348. [Google Scholar]; d) Bowie LJ. Methods Enzymol. 1978;57:15–28. [Google Scholar]
- [11].Shinde R, Perkins J, Contag CH. Biochemistry. 2006;45:11103–11112. doi: 10.1021/bi060475o. [DOI] [PubMed] [Google Scholar]
- [12].a) Branchini BR. Methods Enzymol. 2000;305:188–195. doi: 10.1016/s0076-6879(00)05488-4. [DOI] [PubMed] [Google Scholar]; b) Branchini BR, Hayward MM, Bamford S, Brennan PM, Lajiness EJ. Photochem. Photobiol. 1989;49:689–695. doi: 10.1111/j.1751-1097.1989.tb08442.x. [DOI] [PubMed] [Google Scholar]
- [13].See, for example: Seliger HH, McElroy WD, White EH, Field GF. Proc. Natl. Acad. Sci. USA. 1961;47:1129–1134. doi: 10.1073/pnas.47.8.1129.; McElroy WD, Seliger HH. Fed. Proc. 1962;21:1006–1012.; c) There is one report in which L-luciferin is supposed to produce light: Lembert N. Biochem. J. 1996;317:273–277. doi: 10.1042/bj3170273.
- [14].Tanaka H, Soda K. Methods Enzymol. 1987;143:240–243. doi: 10.1016/0076-6879(87)43045-0. [DOI] [PubMed] [Google Scholar]
- [15].Turro NJ. Modern Molecular Photochemistry. University Science Books; Sausalito, CA: 1991. pp. 191–195. [Google Scholar]
- [16].a) Ribeiro C, Esteves da Silva JCG. Photochem. Photobiol. Sci. 2008;7:1058–1090. doi: 10.1039/b809935a. [DOI] [PubMed] [Google Scholar]; b) Fraga H, Fernandes D, Fontes R, Esteves da Silva JCG. FEBS J. 2005;272:5206–5216. doi: 10.1111/j.1742-4658.2005.04895.x. [DOI] [PubMed] [Google Scholar]
- [17].a) Fontes R, Ortiz B, de Diego A, Sillero A, Sillero MAG. FEBS Lett. 1998;438:190–194. doi: 10.1016/s0014-5793(98)01301-5. [DOI] [PubMed] [Google Scholar]; b) Fontes R, Dukhovich A, Sillero A, Sillero MA. Biochem. Biophys. Res. Commun. 1997;237:445–450. doi: 10.1006/bbrc.1997.7161. [DOI] [PubMed] [Google Scholar]
- [18].a) Morrison JF. Biochim. Biophys. Acta. 1969;185:269–286. doi: 10.1016/0005-2744(69)90420-3. [DOI] [PubMed] [Google Scholar]; b) Williams JW, Morrison JF. Methods Enzymol. 1979;63:437–467. doi: 10.1016/0076-6879(79)63019-7. [DOI] [PubMed] [Google Scholar]; c) Copeland RA. Enzymes. 2nd Ed. Wiley; New York: 2000. pp. 305–317. [Google Scholar]
- [19].a) Lee KH, Byun SS, Paik JY, Lee SY, Song SH, Choe YS, Kim BT. Nucl. Med. Commun. 2003;24:1003–1009. doi: 10.1097/00006231-200309000-00009. [DOI] [PubMed] [Google Scholar]; b) Berger F, Paulmurugan R, Bhaumik S, Gambhir SS. Eur. J. Nucl. Med. Mol. Imaging. 2008;35:2275–2285. doi: 10.1007/s00259-008-0870-6. [DOI] [PMC free article] [PubMed] [Google Scholar]
- [20].Naumov P, Ozawa Y, Ohkubo K, Fukuzumi SJ. J. Am. Chem. Soc. 2009;131:11590–11605. doi: 10.1021/ja904309q. [DOI] [PubMed] [Google Scholar]
- [21].a) Miéville P, Jannin S, Helm L, Bodenhausen G. J. Am. Chem. Soc. 2010;132:5006–5007. doi: 10.1021/ja1013954. [DOI] [PubMed] [Google Scholar]; b) Miéville P, Jannin S, Helm L, Bodenhausen G. Chimia. 2011;65:260–263. [PubMed] [Google Scholar]
Associated Data
This section collects any data citations, data availability statements, or supplementary materials included in this article.