Abstract
This work describes properties of thermo-sensitive submicron sized particles having the same chemical composition but different morphologies. These particles have been prepared with an aerosol technique using dimethylformamide solutions of linear polystyrene-block-poly(N-isopropylacrylamide-block-polystyrene, PS-b-PNIPAM-b-PS. The particles were characterized by cryo-electron microscopy, microcalorimetry, and light scattering. Block-copolymers self-assembled within the particles forming onion-like, gyroid-like, and spherical morphologies having poly(N-isopropylacrylamide) matrix and physically cross-linking polystyrene domains. The particles were dispersed in aqueous media and their behavior in water was studied both below and above the lower critical solution temperature of poly(N-isopropylacrylamide). We found out that the particles with spherical and gyroid-like morphologies swell considerably in water at 20 °C, whereas at 40 °C the particles resemble more of those studied without water treatment. Light scattering experiments showed that the particles gradually aggregate and precipitate with time at 40 °C. Microcalorimetric studies revealed for all three studied morphologies that PNIPAM undergoes a two-step transition due to the different hydration levels of PNIPAM inside and outside the particles. Thicknesses of the PS and PNIPAM layers within the onion-like particles were analyzed using the TEM micrographs by fitting a model of electron density to the integrated electron intensity data. The surface layer of the particles was found out to be PNIPAM, which was supported by light scattering and microcalorimetry. It was also found out from the TEM micrograph analysis that the width of the outmost PS layer is considerably thinner than the one in the dry state prior to immersion in water, and a degradation scheme is proposed to explain these results.
Keywords: Self-assembly, block copolymer, cryo-TEM, thermo-sensitive, stimuli-responsive, PS, PNIPAM, hydrogel, aerosol, physical cross-link, functional material
INTRODUCTION
Nature offers countless examples of complex functional nanosized entities such as viruses and bacteria to name only a few, which play a very important role in our every-day lives. While most of the complexity of the nature is still impossible to reproduce synthetically, some of the functions, shapes and sizes that exist in nature can already be mimicked in laboratory. One of these kinds of functional properties is stimuli-responsive phase separation, which can be observed in some naturally existing biopolymers like tropoelastin.1 The phase separation occurs as a result of the change in the strength of the intra- and intermolecular bonding between the polymer and the solvent as the temperature is changed. During the conformation transition the polymer transforms from coil to a globule and the polymer phase separates from the solvent or vice versa.
Poly(N-isopropylacrylamide) is a synthetic polymer, which behaves similarly as tropoelastin, phase-separating from water due to changes in the competing inter- and intra-molecular interactions between the polymer and the surrounding water, as the solution temperature is increased beyond 32 °C.2 This behavior has been widely used, for example, in stimuli-responsive hydrogels, whose swelling can be controlled by temperature, and it has also been employed, for instance, in sensors, actuators, filters, or in drug release.3-7
Hydrogel swelling and shrinking are diffusion based processes. The response time is directly proportional to the square of the size of the hydrogel.8 For example, swelling of a hydrogel particle on the size scale of millimeters can take hours.9 To prepare rapidly responding systems the dimensions must be decreased or alternatively the gel can be made porous to enable fast solvent immersion throughout the gel.10, 11 The dimension of the gel can be decreased by preparing thin films, fibres or spherical particles having small enough radii. While nature's biosynthesis of entities is superior to any method developed in laboratory, there are still several ways to prepare submicron sized hydrogel particles synthetically using techniques such as microfluid, lithographic, or spray drying methods, or by applying one of the several different types of polymerization methods available.12, 13 The hydrogel particles prepared by the previous list of techniques are usually chemically cross-linked during the preparation process. However the chemical cross-linking can be avoided by utilizing amphiphilic block copolymers for the hydrogel preparation. Typically block copolymers have been used as self-assembling building blocks for nano-scale structures.14, 15 Chemically different polymer blocks, which are connected from one end, prefer to microphase separate into their own domains rather than of chemically mixing.16 For diblock copolymers and for ABA-type triblock copolymers, the microphase separation results in various different structures such as spherical, cylindrical, bicontinuous or lamellar depending on the degree of polymerization, composition and interaction strength between the polymer blocks.17, 18 Hydrogels can be formed by ABA-type amphiphilic triblock copolymer, where B-type middle block is water-soluble and A-type block is hydrophobic acting as physical cross-linker. One of the advantages of using block copolymers is that they can be melted, molded and processed unlike chemically cross-linked gels.
Block copolymer nanoparticles can be prepared synthetically using dispersion and emulsion polymerization techniques.19 In addition to the spherical shapes, the synthesis has been developed further to prepare more anisotropic particles such as cone- or popcorn-like shapes.20 Even though the synthesis may be very laborious, the particle size distribution can also be made very narrow. The advantage of using block copolymers is the possible formation of inner complex structure, which also provides the possibility for preparation of, for example, hollow particles by subsequent removal of the core polymer block in core-shell particles.21, 22 Block copolymer particles can also be prepared directly from polymer solution for example by filling lithographically prepared voids and removing the template afterwards.23-25 A widely used preparation method for block copolymer nanoparticles is to disperse the polymer solution in a non-solvent and letting solvent diffuse and evaporate. This will result in particle dispersion in a non-solvent, but the size distribution control is difficult.26-31 Gas-phase methods, where polymer solutions are converted to aerosols, have been used for the production of solid nanoparticles or as templates for mesoporous particles.32-40 The gas-phase aerosol flow reactor method is versatile because it works generally for all polymer solutions, it is easily scalable, and the resulting dry particles can be collected from the gas-phase directly on a substrate. The system complexity can be increased by dissolving additional molecules in the polymer solution and supramolecular structures can be achieved within the particles already during the particle preparation. Moreover, in the aerosol preparation process the particles can be thermally annealed at the defined temperature in the process gas. Thomas et al. were the first scientists to experimentally study block copolymer aerosol particles41. They showed that the morphology of the symmetric composition of polystyrene-block-polyisoprene diblock copolymer varied with the degree of polymerization. Polymer with molecular weight of 20 kg·mol-1 for both blocks formed particles with onion-like concentric shells whereas polymer with molecular weight of 80 kg·mol-1 for both blocks showed chaotic bicontinuous morphology. Since the first report of Thomas et al. there have been many aerosol particle studies made for different block copolymer systems. Yang et al.42-44 used diblock and triblock copolymers with gelable poly(3-triethoxysilyl)propyl block to create aerosol particles with cylindrical and onion-like structures. The authors showed that it was possible to prepare curved hybrid silica or polystyrene nanoplatelets by subsequent dispersion of the particles into acidic water or to tetrahydrofuran.43, 44 Moreover when using poly(2-vinylpyridine) as the other block they were able to reduce gold nanoparticles within the concentric P2VP layers inside the onion-particles afterwards.43 Theoretical and computational studies regarding the block copolymer self-assembly in 3D-confinement suggest that the confinement effect plays an important role for morphology, when the particle dimension is in the order of the block copolymer periodicity and the existence of the frustrated phases is predicted.45-50
We have earlier reported studies of linear polystyrene-block-poly(N-isopropylacrylamide)-block-polystyrene, PS-b-PNIPAM-b-PS in bulk and in films.51, 52 The kinetics and aggregation behavior of the micellar solution have also been studied for this polymer by Adelsberger et al.53, 54 In this work, we use the same triblock copolymer for the preparation of thermally responsive submicron sized particles using gas-phase aerosol technique. Depending on the polymer composition different intra-particle architectures, such as onion-like concentric lamellar, gyroid-like bicontinuous, and spherical morphologies are formed. In water the poly(N-isopropylacrylamide) domains have thermally responsive behavior whereas polystyrene domains act as physical cross-link points. Properties of aqueous dispersions of these particles are discussed herein. The effect of temperature on the particles below and above the lower critical solution temperature of the PNIPAM block has been studied by means of cryo-electron microscopy, microcalorimetry and light scattering. These particles, whose size is scalable from tens of nanometers to few microns, can be used as excellent models for temperature induced controlled release of various chemicals to the outer media with the release rate and profile determined by the particles’ morphology.
EXPERIMENTAL METHODS
Materials
N,N- dimethylformamide (DMF) was used as received from Sigma-Aldrich. Synthesis of polystyrene-block-poly(N-isopropylacrylamide)-block-polystyrene, PS-b-PNIPAM-b-PS, triblock copolymer by controlled RAFT polymerization is described in our previous paper.52 For this study three of those triblock copolymer compositions were selected, namely PN77.118K, PN61.106K, and PN43.65K, whose data are listed on Table 1.
Table 1.
There are listed below the PS-b-PNIPAM-b-PS polymer compositions used in this study. The samples are coded with PNx.yK, where x is the percentual weight fraction of PNIPAM in the polymer and y is the total molecular weight of the polymer in unit kg·mol-1.
| Sample code | wt%PNIPAM | Mn | Mw/Mn |
|---|---|---|---|
| PN43.65K | 43 | 64 600 | 1,27 |
| PN61.106K | 61 | 106 000 | 1,52 |
| PN77.118K | 77 | 118 300 | 1,51 |
Particle preparation
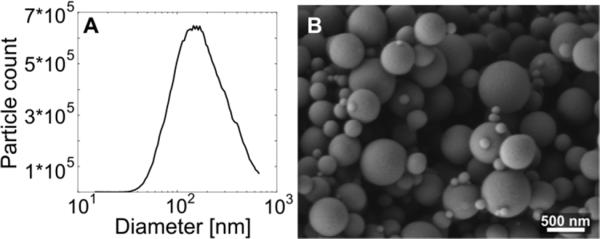
Approximately 40 mg of polymer were dissolved in DMF to yield 1 wt-% polymer concentration. Polymer solution was sprayed into small droplets in nitrogen gas and then led to a reactor oven which was heated to 180 °C. The flow of particles was led through a differential mobility analyzer (DMA) (TSI Model 3071) and a condensation particle counter (CPC) (TSI Model 3775) to record the particle size distribution. The average particle diameter was 198 nm with standard deviation of 163 nm. The particle size was normally distributed on a logarithmic scale. The particles were finally fractionated to ten different size fractions using a Berner-type low-pressure impactor and collected on both TEM grids and on aluminum foils.55
Transmission electron microscopy (TEM)
Aerosol particles were collected directly from the reactor to holey carbon copper grids using an electrostatic precipitator (ESP). Samples were imaged first dry and then vitrified from wet state both below and above PNIPAM coil-globule transition temperature, e.g. at 20 °C and at 40 °C, respectively. Aerosol particles were equilibrated by applying water on grids in the environmental chamber of FEI Vitrobot having relative air humidity of 100% and at temperature of 20 °C or 40 °C. After keeping the samples in the environmental chamber for 5 - 10 minutes the excess water was removed by blotting twice for one second followed by an immediate plunging of the samples into 1:1 mixture of liquid ethane and liquid propane cooled below -175 °C. Vitrified samples were cryo-transferred into Jeol JEM-3200FSC cryo-transmission electron microscope operating at -188 °C. Micrographs were recorded with Gatan Ultrascan 4000 camera operating the microscope in the bright field mode, using 300 kV acceleration voltage and the in-column energy filter set to 0-20 eV energy-loss range (zero-loss imaging). Tilt series starting from angle -70 until angle 60 by one degree increment was taken from sample PN61.106K for transmission electron microtomography (3DTEM) using SerialEM56 software. Image alignment using 3 nm gold fiducials and tomogram reconstruction were done with the help of IMOD software package57 and the tomograms were visualized with UCSF Chimera software58.
Scanning electron microscopy (SEM)
SEM was used to study the morphology and stability of the particles in aqueous environment. Samples were measured both dry and wet after having been exposed to water. Samples were immersed in water at 20 °C or at 40 °C for one minute or for four hours and then quenched into liquid propane cooled below -175 °C. Vitrified samples were transferred to vacuum oven and freeze-dried for 10 hours. Before measurements the samples were coated by a thin layer (ca. 2 nm) of gold. Jeol JSM-7500FA operating at normal SEM mode was used at 2 kV high tension and 10 μA emission current. Electron beam scanned 1280×960 points on the sample, which was located approximately 15 mm below the objective lens and secondary electrons emitted by the sample were recorded with Everhart-Thornley-type detector, which was located at the side of the specimen chamber.
Light scattering (LS)
For LS experiments, aqueous dispersions of comparable total mass concentration were prepared by cutting a piece of the aluminum foil with the polymer particles on it (sample mass ~100 μg) and immersing the piece of foil in 2 mL of distilled water. For samples PN77.118K, PN61.106K, and PN43.65K the mass concentrations were 0.07 mg·mL-1, 0.05 mg·mL-1 and 0.05 mg·mL-1 respectively. Dispersions were sonicated for five minutes and left for stirring over night before the measurements. Light scattering measurements were conducted using a Brookhaven Instruments BI) 200SM goniometer, a BIC-TurboCorr digital pseudo-cross-correlator, and a BI-CrossCorr detector, including two BIC-DS1 detectors. Pseudo-cross-correlation functions of the scattered light intensity were collected at 90° scattering angle with the self-beating scheme.59, 60 A Sapphire 488-100 CDRH laser from Coherent GmbH operating at λo = 488 nm and the power of 50 mW was used as a light source. The temperature of the samples was controlled by means of a Lauda RC 6C thermostated water bath. For each temperature setting, the intensity of scattered light was recorded as a function of time. When it reached a constant value, LS measurements were performed.
High sensitive microcalorimetric analysis (HS-DSC)
The same sample solutions, which were used in LS, were measured in microcalorimetry. High-sensitivity differential scanning calorimetry (HS-DSC) measurements were performed for aqueous polymer dispersions using a VP-DSC MicroCalorimeter (MicroCal Inc.) under an external pressure of ca. 180 kPa. The temperature interval studied was from 15 °C to 50 °C and the heating/cooling rate was 90 °C per hour.
RESULTS AND DISCUSSION
Particle preparation and characterization of as-prepared particles by TEM
The PS-b-PNIPAM-b-PS aerosol particles were prepared by atomizing the polymer solution into small droplets in a gas-phase and letting the solvent evaporate in an oven, which was heated up to 180 °C. Spherical particles were formed with an average particle diameter of 198 nm and with standard deviation of 163 nm as shown in Figure 1.
Figure 1.
(A). Particle size distribution measured with the differential mobility analyzer and the condensation particle counter. (B) A SEM micrograph of freshly prepared aerosol particles.
The temperature used for the particles preparation is above the Tg of both polymer blocks and above the boiling point of the dimethylformamide solvent. Thus the block copolymer self-assembles in conditions close to the molten state, resulting in the morphologies, which minimize the unfavorable mixing enthalpy of the chemically different polymer blocks. We used TEM to study the internal structure of the aerosol particles. Micrographs, taken from particles of polymer compositions PN77.118K, PN61.106K, and PN43.65K, are shown in Figures 2A, 2B, and 2C, respectively. The samples were stained with iodine, which selectively stains PNIPAM domains appearing darker in the micrographs. In contrast, the PS domains appear light grey in all the micrographs. The sample morphology within the particle in Figure 2C appears to be onion-like lamellar, but it is more difficult to make accurate definition of morphologies from Figures 2A and 2B. Nevertheless, more insight to these particle morphologies will be given by observing the cryo-TEM micrographs in the next section.
Figure 2.
TEM micrographs of aerosol polymer particles with spherical, gyroid-like, and onion-like morphologies from samples PN77.118K (A), PN61.106K (B), and PN43.65K (C), respectively. Samples were stained with iodine, which selectively stains the PNIPAM domains appearing darker in the micrographs.
The self-assembly of the polymers in the molten state happens in a relatively short time, in about 10 seconds, but still the structures are well formed, especially in the onion-like morphology, when compared to the structures of bulk samples, which were annealed at the same temperature for four days.52
Particle behavior in water at 20 °C
The particles were immersed in water at 20 °C to find out their behavior in aqueous environment below the PNIPAM coil-globule transition temperature. PNIPAM blocks are water soluble under these conditions, which results in the PNIPAM domain swelling. This can be observed from cryo-TEM micrographs in Figures 3A, 3B, and 3C, which were taken after 5-10 minutes of water immersion at 20 °C. The electron density of the water swollen PNIPAM domains is lower than the PS domains. Thus, no traditional staining methods are needed to reveal the block polymer morphology in cryo-TEM. One can observe PS spheres, worm-like PS domains, and curved PS-layers in micrographs 3A, 3B, and 3C, respectively. It is easier to observe the differences between the morphologies of samples PN77.118 and PN61.108K in cryo-TEM micrographs, Figures 3A and 3B, than in iodine stained particles without any water treatment, in Figures 2A and 2B, respectively. This is firstly because in cryo-TEM the contrast is formed without staining, which makes domain boundaries sharper, secondly, because the PS domains are more separated due to the PNIPAM domain swelling, and finally, because the particles are surrounded by a thin film of water which flattens laterally the originally spherical particles. The flattening can also be observed from electron microtomography (3DTEM) reconstruction, taken from sample PN61.106K (see Supporting Information. In the onion-like particle of Figure 3C, it is possible to observe the PNIPAM corona at the surface of the particle, which has been highlighted by a red dashed line. Moreover, observing electron density contrast between the different layers in the onion-like particle in Figure 3C proves that water molecules are able to penetrate inside the particle, since the as) prepared particles did not show any electron density contrast without staining. However, only the outmost PNIPAM layer of the onion-like particles was observed to swell considerably. Thus the continuous PS layers prevent the swelling of the inner PNIPAM layers in this morphology.
Figure 3.
Cryo-TEM micrographs of polymer particles with spherical, gyroid-like and onion-like morphologies vitrified from T = 20 °C, when the PNIPAM block is in the hydrophilic state. Micrographs are from samples PN77.118K (A), PN61.106K (B), and PN43.65K (C), respectively. The darker domain consists of polystyrene. In (C) the PNIPAM corona has been highlighted by a red dashed line. The samples were equilibrated in water for 5-10 minutes before vitrification. No staining was used.
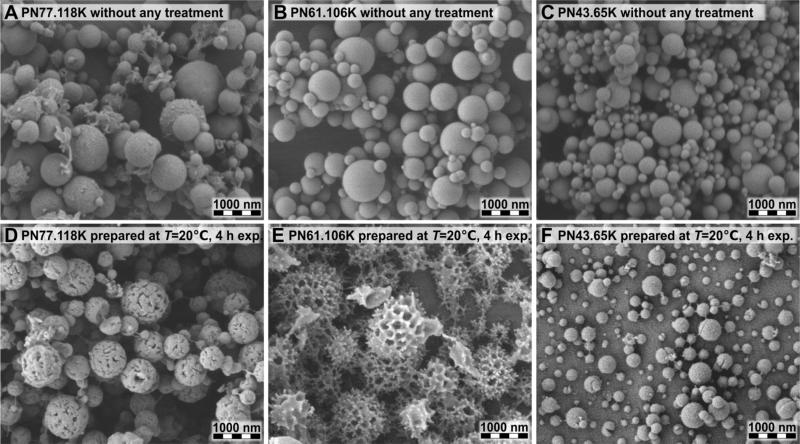
The cryo-TEM study was done in purpose to see the morphology and temperature dependent behavior of individual particles on a TEM grid. With SEM it is possible to study the surface of a larger amount of particles and to get statistical information of the behavior. At the time of particle preparation, a flow of particles is directed on an aluminum foil, where the particles form a heap and are initially attached with each other. Such a heap of particles on an aluminum foil was used as a sample in this experiment. The samples were exposed to water for one minute or for four hours at temperatures 20 °C or 40 °C, i.e. below and above the PNIPAM coil-globule transition temperature, respectively. At the end of the experiment the samples were quenched with liquid propane and freeze-dried in vacuum. SEM micrographs reveal the polymer network at the state in which it was at the time of quenching. Ice sublimates away during the freeze-drying process and the only material left is the polymer network. As a consequence, the water swollen particles become porous as can be seen from some of the SEM micrographs.
SEM micrographs in Figure 4 show the particles without any water treatment and the particles, which were left in water at 20 °C for four hours and then freeze-dried. We can observe that the water treated particles with spherical morphology PN77.118K and gyroid-like morphology PN61.106K, in Figures 4D and 4E respectively, look porous, whereas the particles with onion-like morphology PN43.65K, in Figure 4F, appear as full solids.
Figure 4.
SEM micrographs comparing the samples without any water treatment, Figures (A), (B), and (C), to the samples after being four hours in water at T = 20 °C, and subsequent freeze-drying, Figures (D), (E), and (F), respectively. Micrographs are from samples PN77.118K (A) and (D), PN61.106K (B) and (E), and PN43.65K (C) and (F), respectively.
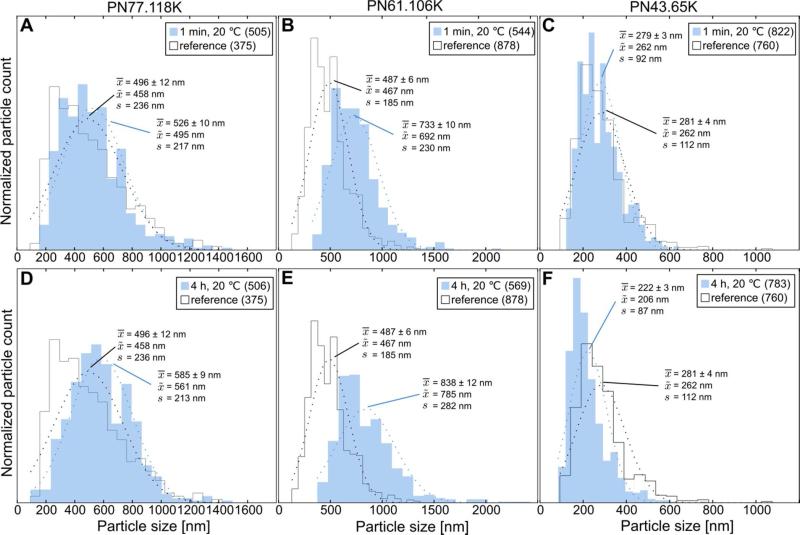
Particle diameters were measured from SEM micrographs, for statistical analysis. Figure 5 shows the diameter distributions of the particles without any water treatment and after being in water for one minute and for four hours at 20 °C. The percentual changes of the particle diameters, upon immersion in water at 20 °C or at 40 °C, have also been summarized in Table 2. We can observe that the average diameter increases for both the particles with spherical morphology PN77.118K and the particles with gyroid-like morphology PN61.106K, which confirms the idea of particle swelling at 20 °C. The average increase of particle diameter for samples PN77.118K and PN61.106K is 18 ± 5% and 72 ± 5%, respectively, which corresponds to a volume increase of 64% and 410%, respectively. These values are far from the ones, which were measured earlier in the bulk swelling experiments based on the measurement of mass change.52 The mass increases of 3400% and 600%, compared to the dry state, were measured at 24 °C for PN77.118K and PN61.106K, respectively. The diameter of the particles having the onion-like morphology PN43.65K does not increase upon immersion in water at 20 °C, which is consistent with the results reported earlier. On the contrary, the average diameter had decreased unexpectedly 21 ± 2% after being in water for four hours, which corresponds to 50% of volume decrease.
Figure 5.
Particle diameter size distributions acquired from SEM micrographs for as-prepared particles (black line) and for freeze-dried particles after being one minute or four hours in water at 20 °C (blue area). Sample mean (x-bar), median (x-tilde) and standard deviation s, were calculated from the statistics. The amount of particles used for the statistics is written inside the parentheses in the label box. Normal distributions fitted to the data have been plotted with dashed lines.
Table 2.
Percentual change Δd = 100·(dwet-dorig)/dorig of the average particle diameter in aqueous environment dwet compared to the particle diameter without any water treatment dorig. Values are based on the statistics acquired from the SEM micrographs.
| T = 20 °C | T = 40 °C | |||
|---|---|---|---|---|
| Sample code | Δd, 1 min | Δd, 4 h | Δd, 1 min | Δd, 4 h |
| PN77.118K | 6 ± 5 | 18 ± 5 | -1 ± 5 | 6 ± 4 |
| PN61.106K | 51 ± 4 | 72 ± 5 | 2 ± 3 | -16 ± 2 |
| PN43.65K | -1 ± 2 | -21 ± 2 | 10 ± 3 | 2 ± 3 |
Particle behavior in water at 40 °C
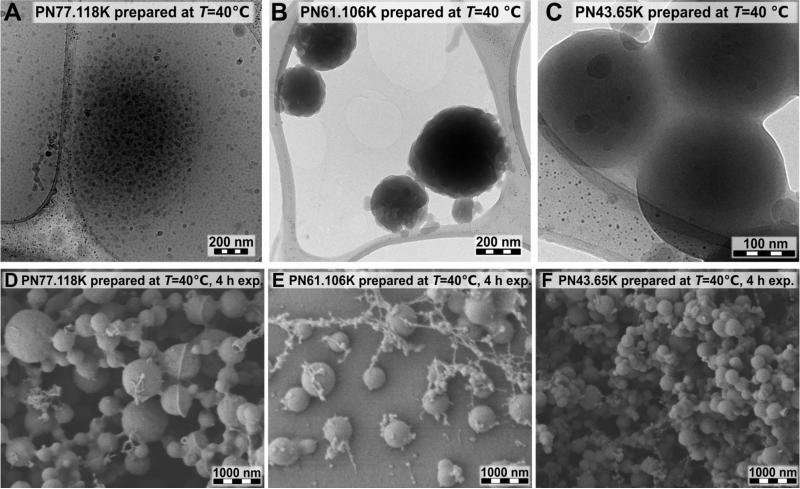
When the samples were immersed in water at elevated temperature of 40 °C, the particle structure could not be resolved any longer by TEM for particles made of PN61.106K and PN43.65K, as can be seen in Figures 6B and 6C, respectively. At this temperature the PNIPAM blocks are always in the hydrophobic state and, therefore, the water does not enter inside the particles and the electron contrast between the PNIPAM and the PS blocks remains low. However the surface of the spheres is slightly deformed if compared with the particles without any water treatment in Figure 2. Another observation is that at 40 °C the hydrophobic particles tend to aggregate in order to minimize the surface area against the surrounding water. This behavior was observed especially for particles made of PN61.106K and PN43.65K, as can be seen in Figures 6B and 6C, respectively. Surprisingly, we did not see any notable difference in the particle appearance in the cryo-TEM at different temperatures for particles of the sample PN77.118K as can be observed by comparing Figures 3A and 6A.
Figure 6.
Cryo-TEM micrographs of polymer particles with spherical, gyroid-like, and onion-like morphologies vitrified after being 5-10 minutes in water at T = 40 °C, when the PNIPAM block is in the hydrophobic state. Micrographs are from samples PN77.118K (A), PN61.106K (B), and PN43.65K (C), respectively. In (D), (E), and (F), there are SEM micrographs shown of the freeze-dried particles. Samples were vitrified after being four hours in water at T = 40 °C. Micrographs are from samples PN77.118K (D), PN61.106K (E), and PN43.65K (F), respectively.
The SEM micrographs in Figures 6D, 6E and 6F, which have been taken after the particles being four hours in water at 40 °C, show that the particles are full solids, which implies that they did not swell, as expected, due to the hydrophobic state of the PNIPAM. The average particle diameters acquired from SEM micrographs support this observation, since the average diameter stays almost at constant, see Table 2 and the diameter distributions in Figure S1.
High sensitive microcalorimetric analysis
The cryo-electron microscopy observations confirmed that the temperature has an effect on the particle swelling but also that the polymer composition and morphology play a major role in the particles’ behavior in an aqueous environment. The aqueous particle dispersions were further investigated by microcalorimetry in order to qualitatively estimate the fraction of NIPAM units, which take part in the phase separation process in respect to particle architecture.
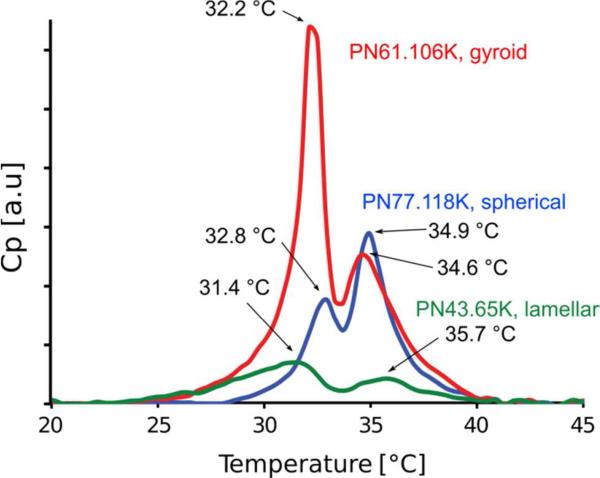
The most important results of this analysis are summarized in Figure 7.
Figure 7.
(A) Microcalorimetric endotherms (heating) of stock solutions of PN77.118K, PN61.106K, and PN43.65K measured with a heating rate of 90 °C·h-1. Values of the maximum heat capacities for each peak are shown.
Firstly, we observed two well separated peaks in the microcalorimetric endotherms for all studied dispersions of PN77.118K, PN61.106K, and PN43.65K, see Figure 7. Such bimodal phase transition has not been observed for linear PNIPAM in water. However, a similar two-step phase transition has been observed for the PNIPAM-protected gold nano-particles61, 62 as well as for a PNIPAM shell grafted from a hydrophobic dendritic core.63, 64 Shan et al. 61 proposed a model to explain the double peak behavior for the PNIPAM-protected gold nano-particles. In that model the PNIPAM chains were subdivided into two zones. They suggested that the interchain cooperative transition of the NIPAM units at the inner shell occurred at a lower temperature due to their lower hydration level. The second transition at a higher temperature owed to the collapse of the remaining “free” NIPAM units situated relatively far from the gold core. The earlier reports by Afroze et al.66 and Boutris et al.67 show that the phase separation temperature of the linear PNIPAM in aqueous solution decreases with increasing concentration up to the weight fraction of 0.5, after which the temperature starts to increase again. Thus, it would be reasonable to expect broader or separated phase transition peaks for a system with multiple different concentration regions.
In our triblock copolymer aerosol particle system we can expect of having three different regions of NIPAM units based on their surroundings. First, the PNIPAM on the surface of the particles is free to interact with the surrounding water and the PNIPAM concentration is the lowest. Inside the particle the PNIPAM concentration is higher, however it can be assumed to be highest close to the PS-PNIPAM interface and to decrease quite rapidly as the distance from the PS-PNIPAM domain interface increases. The molecular weights of the polymers in our study are higher than for example for Shan et al., who observed the two-step transition for polymers having molecular weight of only 5 kg·mol-1. Thus also the relative amount of well-hydrated NIPAM units is much higher in our study, if we assume that the size of poorly hydrated zone close to the gold core is comparable with the less hydrated zone at the PS-PNIPAM interface.
It can be observed from the Figure 7 that the temperature of the maximum heat capacity of the first peak varied depending on the polymer composition. The lowest value 31.4 °C was observed for PN43.65K, next 32.2 °C for PN61.106K, and finally the highest value 32.8 °C for PN77.118K. The transition temperature decreased consistently with the increasing amount of hydrophobic polystyrene on the particles. This makes sense knowing that the PNIPAM demixing temperature can be decreased by adding hydrophobic moieties to PNIPAM.65 This observation supports the assumption that the first peak comes from the part of the PNIPAM chain which is inside the particle and close to the PS-PNIPAM domain interface.
The HS-DSC experiments also reveal that the number of NIPAM units, which actually takes part in the phase separation process, is determined by the internal architecture of the studied particles. The relative ratio of the first peaks and the area under the Cp vs. T curves clearly indicate the difference between the samples, see Figure 7. For the PN43.65K particles, that have onion-like structure, the NIPAM units of only the most outer shells are solvated and take part in the phase separation process. As a result, the area under the Cp vs. T curves is the smallest for the PN43.65K particles. Surprisingly, the sample PN61.106K, having gyroid-like morphology, has the largest area under the Cp vs. T curves even though the spherical morphology of the PN77.118K particles has the highest amount of NIPAM units. This indicates that the amount of NIPAM units that take part into the conformation transition is relatively much higher for PN61.106K than for PN77.118K. This result is supported by the cryo-electron microscopy, where the strongest temperature dependent swelling was also observed for PN61.106K.
The reasons for the strongest PNIPAM transition for sample PN61.106K can be further discussed. The ABA-type triblock copolymer can be either in looping or bridging conformation as a result of self-assembly. The polymer is defined to be looping if the end-blocks of the same polymer chain locate in the same domain and bridging if they locate in the different domains, in which case the polymer physically cross-links the end-block domains. It has been shown experimentally and theoretically to lamellar and spherical morphologies that the ratio of bridging polymer chains to the looping ones is approximately 0.4.66-68
If the polymer is looping in our system, the middle PNIPAM block can move more freely and in principle all the NIPAM units are able to take part into the conformation transition. However, if the polymer chain is bridging between the two PS domains, it is physically more restricted to move than the looping chain because the chain ends are fixed to different locations. The conformation transition might not be as complete as for the looping chains, in which case the resulting enthalpy is also smaller. The absolute value of enthalpy of the phase transition (ΔH) cannot be calculated for the studied samples even if the precise polymer concentration of solutions is known. This is because the number of the NIPAM units, which actually take part in the phase separation, is unknown due to the architecture differences of the studied particles. However, it is possible that the surprisingly large enthalpy difference that was observed between the samples PN61.106K and PN77.118K is due to the different bridging to looping ratios. More precisely, this might indicate that PN77.118K polymers form denser bridging network within the aerosol particles than PN61.106K.
Study of the layer thicknesses in the onion-like morphology by TEM
The behavior of the onion-like morphology PN43.65K in water was analyzed further because the outmost PS layer was unexpectedly thin on the TEM micrographs, see Figure 3C.
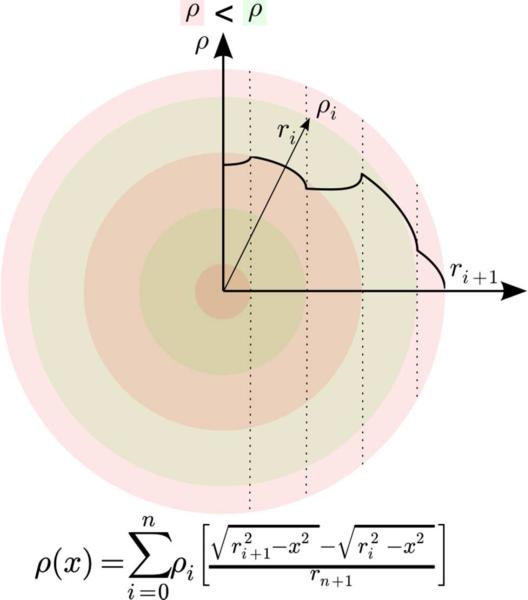
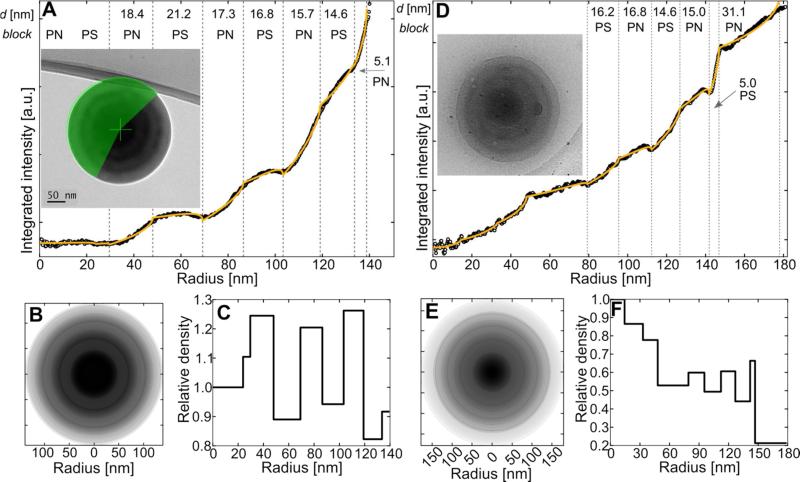
All the TEM micrographs were taken without sectioning the spherical particles. During the TEM experiment electrons transmit through the sphere and, in the case of the onion-like morphology, projection of a spherically symmetric particle of concentric layers is recorded on a CCD-camera. To maximize the usage of the available data, the recorded electron intensity in the TEM micrographs was integrated around the center point of the projection of the spherical particle. The integration result is proportional to the inverse of the electron density within the sphere projected through the axis of the electron beam, as can be observed by comparing the graphs in Figures 8 and 9. We can study the layer thicknesses of the onion-like morphology more accurately by fitting a model of the electron density of a sphere with concentric layers of alternating electron density to the data, see Figure 8. Moreover, the model can be used to estimate the relative electron densities of the layers. Figures 9A and S4-S8 show the integrated data and the fitted model for the iodine stained particles without any water treatment. Iodine stains PNIPAM layers, which result as darker domains in the micrographs. In Figures 9B and 9C, a simulated micrograph based on the fitted model and the relative electron densities of the layers have been plotted, respectively. The modeled electron density is alternating as a function of radius as expected, but the electron density difference is lower at the surface of the particle. This might be since the iodine evaporates easily from the particle surface in vacuum during the TEM experiments. Figures 9D and S9-S12 show the integrated data and fitted model for the particles, which have been in water at 20 °C. In these micrographs, the contrast is inversed and the darker layers correspond to PS.
Figure 8.
The equation in the figure models the electron density projected through a spherical particle with concentric layers of alternating electron density. ρi is the electron density and ri is the radius of the ith layer and x is the coordinate of the axis perpendicular to the axis of projection. The inset graph shows the electron density for the case of ρgreen = 2 * ρpink.
Figure 9.
Integrated intensities of projections of spherical particles with onion-like morphology are plotted in Figures (A) and (D). Integrations were performed on the unmasked area around the center point of the particles as shown in the inset TEM micrographs. The particle in Figure (A) was imaged after staining at iodine vapor for four hours and without any water treatment. Iodine stains the PNIPAM domains, which can be seen darker in the micrograph. The sample in Figure (D) was equilibrated for 5-10 minutes in water at 20 °C before cryo-TEM sample preparation and no staining was used. An inverse of the model of projected electron density of a sphere with concentric layers (yellow line) is fitted on the data. The layer widths given by the models are listed on top of the graphs. Simulated micrographs, based on the fitted models in Figures (B) and (E), can be compared with the original TEM micrograph for model validation. Electron densities of the layers given by the fitted model are plotted in Figures (C) and (F).
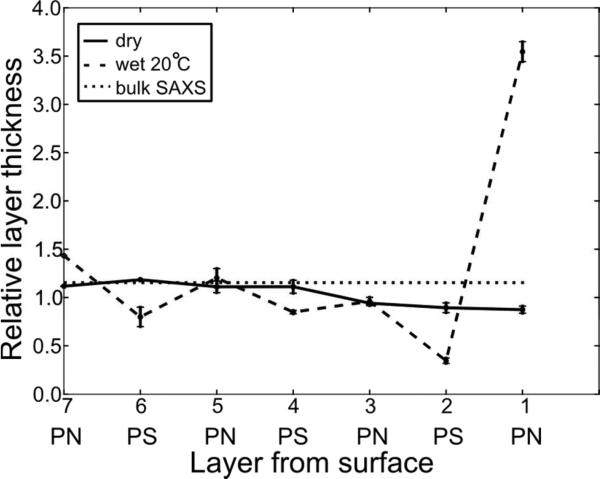
Averages of the absolute layer thicknesses have been listed in Table 3 and the relative layer thicknesses measured from the water swollen particles and from the iodine stained particles without any water treatment have been plotted in Figure 10. In all the analyzed particles, the surface layer was found out to be PNIPAM. One can observe from the solid line in Figure 10, that for the iodine stained particles the relative layer width decreases from core to the surface. One can also notice that the outmost layer of PNIPAM has swollen considerably and its width has increased in average of 3.5 times compared to the dry state. On the other hand the width of the second layer, which is PS, has decreased to half compared to the PS layers measured from particles without any water treatment.
Table 3.
Absolute layer thicknesses, standard deviations and the number of particles, from which the average value has been calculated. No water treatment was done for the iodine stained particles.
| Layer from surface | 7th | 6th | 5th | 4th | 3rd | 2nd | 1st | |
|---|---|---|---|---|---|---|---|---|
| Polymer block | PN | PS | PN | PS | PN | PS | PN | |
| Dry iodine stained particles | Average [nm] | 18,4 | 21,2 | 18,3 | 19,9 | 15,5 | 16,0 | 7,2 |
| Std. dev. [nm] | 1,4 | 2,4 | 0,6 | 2,2 | 1,4 | |||
| Number of particles | 1 | 1 | 2 | 4 | 6 | 6 | 6 | |
| Wet particles | Average [nm] | 23,6 | 14,3 | 19,8 | 15,2 | 15,8 | 6,2 | 29,2 |
| Std. dev. [nm] | 2,6 | 3,2 | 0,7 | 1,6 | 1,2 | 3,7 | ||
| Number of particles | 1 | 2 | 4 | 5 | 5 | 5 | 5 | |
Figure 10.
Relative layer thicknesses as a result of TEM micrograph analysis obtained for the onion) like PN43.65K. Particles without any water treatment (solid line) and water equilibrated particles prepared from 20 °C (dashed line) have been used. Averages of the layer thicknesses measured from particles without any water treatment have been used for normalization. The bulk periodicity measured in SAXS was 14 % larger than the average periodicity measured from the particles in TEM. The SAXS data can be found from the Supporting information.
The decrease of the width of the layers from core to surface is a surprising result. According to the theory and simulations, a slight increase in the layer width would be expected instead.45 The unexpected decrease can be due to the shrinking caused by iodine for the stained particles. The middle PNIPAM-blocks situated in the outmost layers are all at the loop-conformation and the increase of the width of this layer is expected as the polymer chains can freely wet in water. The increase of 350±25 % corresponds well to the maximum swelling capacity of the block copolymer gel of spherical morphology PN77.118K in bulk, which was measured to be approximately 34 times in volume (~3.2 times in radius).52
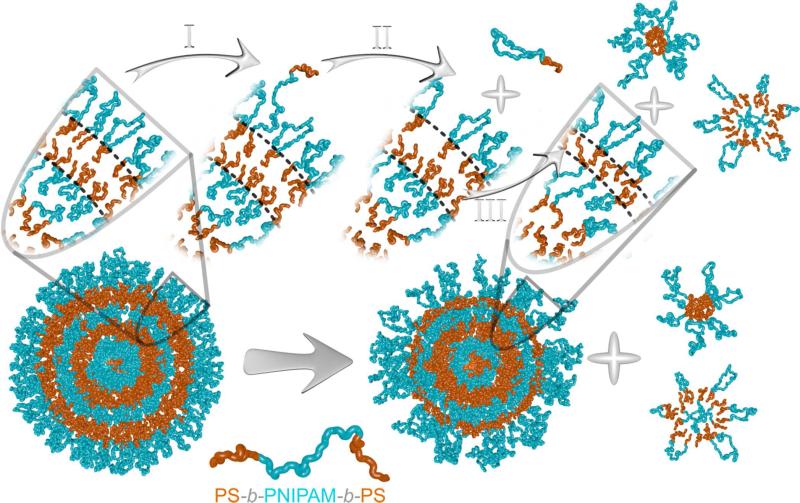
It is more complicated to explain the decrease of the layer width of the outmost PS layer, which is the second layer from the surface. Its width was decreased approximately to a half from the original as a result of water immersion at 20 °C. A part of this decrease is caused by the error in the actual layer thicknesses measured from the stained particles. The iodine staining distorts the measurements first by shrinking the PNIPAM layer and secondly by not totally staining the PNIPAM layer, which causes the PS layers to be measured too large, see also Figure S3. This can also be seen from Figure 10, where all the PS layers, measured from the wet particles are thinner than the layers measured from the iodine stained particles. However, this is not enough to explain the amount of thinning at the outmost PS layer. We suppose that the particle starts to “degrade” from the surface so that the polymer chains depart from it causing both the PS-layer to become thinner and a formation of separate micelles and vesicles in the solution, as depicted in schematic Figure 11. Vesicles were indeed observed together with onion-like particles for PN43.65K in cryo-TEM micrographs, for details see Figure S13. The fact that the polystyrene end blocks are terminated with hydrophilic carboxylic acid groups52, 69 make this proposal even more acceptable, because then the PS chain ends can remain in water without being energetically in an unbearable situation. According to the statistical analysis made from SEM micrographs the average particle diameter decreased 21 ± 2% after keeping the particles four hour at 20 °C, which also supports the idea of particle degradation.
Figure 11.
Schematic representation describing the suggested reason for the observed thinning of the outmost PS layer of the onion-like particle in water.
The suggested degradation mechanism is very attracting regarding the possibility to apply it for layer-wise controlled release.
Comparable particle “degradation” is expected also for the other two studied morphologies, since separate micelles were found from all the studied samples with help of cryo-TEM (see Figure S13).
Light scattering of aqueous particle dispersions
Light scattering studies were performed on particle dispersions of PN77.118K, PN61.106K, and PN43.65K in order to estimate the particles size, their size distributions in water, and the effect of temperature within the temperature interval of 20 – 40 °C. At 20 °C, the apparent hydrodynamic radius Rh of the PN77.118K particles of spherical morphology (Rh~1000 nm) is about twice larger than corresponding Rh of PN61.106K, and PN43.65K (Rh~500 nm) and the distributions of hydrodynamic radius are moderately narrow for all studied samples. Small separate micelles or particles cannot be detected by DLS owing to the strong scattering from the larger particles and this unfortunately reduces the relevance of the DLS measurements in this study. In the range of 30-35 °C, the PNIPAM blocks collapse and the particles of all three morphologies appear as monodisperse hard spheres. Above 30-35 °C, intensity of scattered light increases due to formation of large inter particle aggregates. These secondary aggregates sediment gradually with time and/or upon further heating, which is observed by the decrease of the total intensity of the scattered light in time at 40 °C (for details, see Figure S14).
CONCLUSIONS
Aerosol process can be used to prepare physically cross-linked block copolymer hydrogels with self-assembled morphologies. The particles of PS-b-PNIPAM-b-PS with spherical and gyroid-like morphology swell after immersion in water at 20 °C, whereas at 40 °C, they resemble the particles without any water treatment. Microcalorimetric studies revealed that PNIPAM phase separation takes place in two steps. The first transition was assigned to come from the PNIPAM inside the sphere and the second step from the surface of the particles. The outmost layer of the particles with the onion-like morphology was found to be PNIPAM. The width of the next outmost PS layer, which was measured from the particles immersed in water at 20 °C, was found to be considerably thinner than in the particles without any water treatment. A degradation scheme was suggested to explain this layer thinning, which was supported by the observation of separate micelles and vesicles in the micrographs. The suggested degradation mechanism is very attracting regarding the possibility to use it for controlled release application. At 40 °C, particles in aqueous dispersions form larger aggregates and gradually precipitate from the dispersion.
Supplementary Material
ACKNOWLEDGMENTS
We gratefully acknowledge Academy of Finland (project number 140362) and National Graduate School of Material Physics for financial support. This work made use of facilities of Nanomicroscopy Center of Aalto University School of Science. Video of the tomogram was produced with the UCSF Chimera package. Chimera is developed by the Resource for Biocomputing, Visualization, and Informatics at the University of California, San Francisco, with support from the National Institutes of Health (National Center for Research Resources grant 2P41RR001081, National Institute of General Medical Sciences grant 9P41GM103311).
REFERENCES
- 1.Chilkoti A, Christensen T, MacKay JA. Curr. Opin. Chem. Biol. 2006;10(6):652–657. doi: 10.1016/j.cbpa.2006.10.010. [DOI] [PMC free article] [PubMed] [Google Scholar]
- 2.Schild HG. Prog. Polym. Sci. 1992;17(2):163–249. [Google Scholar]
- 3.Gerlach G, Guenther M, Suchaneck G, Sorber J, Arndt K-F, Richter A. Macromolecular Symposia. 2004;210(1):403–410. [Google Scholar]
- 4.Tokarev I, Minko S. Adv. Mater. 2010;22(31):3446–3462. doi: 10.1002/adma.201000165. [DOI] [PubMed] [Google Scholar]
- 5.Gil ES, Park S-H, Tien LW, Trimmer B, Hudson SM, Kaplan DL. Langmuir. 2010;26(19):15614–15624. doi: 10.1021/la102509a. [DOI] [PubMed] [Google Scholar]
- 6.Wei H, Cheng S-X, Zhang X-Z, Zhuo R-X. Prog. Polym. Sci. 2009;34(9):893–910. [Google Scholar]
- 7.Ahn S.-k., Kasi RM, Kim S-C, Sharma N, Zhou Y. Soft Matter. 2008;4(6):1151–1157. doi: 10.1039/b714376a. [DOI] [PubMed] [Google Scholar]
- 8.Tanaka T, Fillmore DJ. J. Chem. Phys. 1979;70(3):1214–1218. [Google Scholar]
- 9.Silva Nykanen VP, Nykanen A, Puska MA, Silva GG, Ruokolainen J. Soft Matter. 2011;7(9):4414–4424. [Google Scholar]
- 10.Gotoh T, Nakatani Y, Sakohara S. J. Appl. Polym. Sci. 1998;69(5):895–906. [Google Scholar]
- 11.Okay O. Prog. Polym. Sci. 2000;25(6):711–779. [Google Scholar]
- 12.Helgeson ME, Chapin SC, Doyle PS. Current Opinion in Colloid & Interface Science. 2011;16(2):106–117. doi: 10.1016/j.cocis.2011.01.005. [DOI] [PMC free article] [PubMed] [Google Scholar]
- 13.Oh JK, Drumright R, Siegwart DJ, Matyjaszewski K. Prog. Polym. Sci. 2008;33(4):448–477. [Google Scholar]
- 14.Lecommandoux S, Lazzari M, Liu G. Block Copolymers in Nanoscience. Wiley-VCH Verlag GmbH & Co. KGaA; 2008. An Introduction to Block Copolymer Applications: State-of-the-Art and Future Developments. pp. 1–7. [Google Scholar]
- 15.Hamley IW. Angew. Chem. Int. Ed. 2003;42(15):1692–1712. doi: 10.1002/anie.200200546. [DOI] [PubMed] [Google Scholar]
- 16.Leibler L. Macromolecules. 1980;13(6):1602–1617. [Google Scholar]
- 17.Matsen MW, Thompson RB. J. Chem. Phys. 1999;111(15):7139–7146. [Google Scholar]
- 18.Hamley IW. The physics of block copolymers. Vol. 19. Oxford University Press; New York: 1998. [Google Scholar]
- 19.Yang S-M, Kim S-H, Lim J-M, Yi G-R. J. Mater. Chem. 2008;18(19):2177–2190. [Google Scholar]
- 20.Kim JW, Larsen RJ, Weitz DA. Adv. Mater. 200719(15):2005–2009. [Google Scholar]
- 21.Li G, Yang X, Wang B, Wang J, Yang X. Polymer. 2008;49(16):3436–3443. [Google Scholar]
- 22.Li X, Zuo J, Guo Y, Yuan X. Macromolecules. 2004;37(26):10042–10046. [Google Scholar]
- 23.Yabu H, Jinno T, Koike K, Higuchi T, Shimomura M. Macromolecules. 2011;44(15):5868–5873. [Google Scholar]
- 24.Arsenault AC, Rider DA, Tétreault N, Chen JIL, Coombs N, Ozin GA, Manners I. J. Am. Chem. Soc. 2005;127(28):9954–9955. doi: 10.1021/ja052483i. [DOI] [PubMed] [Google Scholar]
- 25.Rider DA, Chen JIL, Eloi J-C, Arsenault AC, Russell TP, Ozin GA, Manners I. Macromolecules. 2008;41(6):2250–2259. [Google Scholar]
- 26.Tanaka T, Saito N, Okubo M. Macromolecules. 2009;42(19):7423–7429. [Google Scholar]
- 27.Jeon SJ, Yi GR, Yang SM. Adv. Mater. 2008;20(21):4103–4108. [Google Scholar]
- 28.Higuchi T, Tajima A, Motoyoshi K, Yabu H, Shimomura M. Angew. Chem. Int. Ed. 2008;47(42):8044–8046. doi: 10.1002/anie.200803003. [DOI] [PubMed] [Google Scholar]
- 29.Jeon S-J, Yi G-R, Koo CM, Yang S-M. Macromolecules. 2007;40(23):8430–8439. [Google Scholar]
- 30.Li L, Matsunaga K, Zhu J, Higuchi T, Yabu H, Shimomura M, Jinnai H, Hayward RC, Russell TP. Macromolecules. 2010;43(18):7807–7812. [Google Scholar]
- 31.Yabu H. Chaos. 2005;15(4):047505. doi: 10.1063/1.2137621. [DOI] [PubMed] [Google Scholar]
- 32.Yamauchi Y, Gupta P, Fukata N, Sato K. Chem. Lett. 2009;38(1):78–79. [Google Scholar]
- 33.Lu Y, Fan H, Stump A, Ward TL, Rieker T, Brinker CJ. Nature. 1999;398(6724):223–226. [Google Scholar]
- 34.Jiang X, Brinker CJ. J. Am. Chem. Soc. 2006;128(14):4512–4513. doi: 10.1021/ja058260+. [DOI] [PubMed] [Google Scholar]
- 35.Ruiz-Hernández E, López-Noriega A, Arcos D, Izquierdo-Barba I, Terasaki O, Vallet-Regí M. Chem. Mater. 2007;19(14):3455–3463. [Google Scholar]
- 36.Tsung C-K, Fan J, Zheng N, Shi Q, Forman AJ, Wang J, Stucky GD. Angew. Chem. Int. Ed. 2008;47(45):8682–8686. doi: 10.1002/anie.200802487. [DOI] [PubMed] [Google Scholar]
- 37.Ruiz-Hernández E, López-Noriega A, Arcos D, Vallet-Regí M. Solid State Sciences. 2008;10(4):421–426. [Google Scholar]
- 38.Yan Y, Zhang F, Meng Y, Tu B, Zhao D. Chem. Commun. 2007;(27):2867–2869. doi: 10.1039/b702232h. [DOI] [PubMed] [Google Scholar]
- 39.Arcos D, López-Noriega A, Ruiz-Hernández E, Terasaki O, Vallet-Regí M. Chem. Mater. 2009;21(6):1000–1009. [Google Scholar]
- 40.Ji X, Hu Q, Hampsey JE, Qiu X, Gao L, He J, Lu Y. Chem. Mater. 2006;18(9):2265–2274. [Google Scholar]
- 41.Thomas E,L, Reffner J,R, Bellare J. J. Phys. Colloques. 1990;51(C7):C7–363-C7-374. [Google Scholar]
- 42.Zhang K, Gao L, Chen Y, Yang Z. Chem. Mater. 2007;20(1):23–25. [Google Scholar]
- 43.Zhang K, Gao L, Chen Y, Yang Z. J. Colloid Interface Sci. 2010;346(1):48–53. doi: 10.1016/j.jcis.2010.02.039. [DOI] [PubMed] [Google Scholar]
- 44.Zhang K, Yu X, Gao L, Chen Y, Yang Z. Langmuir. 2008;24(13):6542–6548. doi: 10.1021/la800096w. [DOI] [PubMed] [Google Scholar]
- 45.Yu B, Li B, Jin Q, Ding D, Shi A-C. Macromolecules. 2007;40(25):9133–9142. [Google Scholar]
- 46.He X, Song M, Liang H, Pan C. J. Chem. Phys. 2001;114(23):10510–10513. [Google Scholar]
- 47.Yu B, Li B, Jin Q, Ding D, Shi A-C. Soft Matter. 2011;7(21):10227–10240. [Google Scholar]
- 48.Li S, Chen P, Zhang L, Liang H. Langmuir. 2011;27(8):5081–5089. doi: 10.1021/la200379h. [DOI] [PubMed] [Google Scholar]
- 49.Fraaije JGEM, Sevink GJA. Macromolecules. 2003;36(21):7891–7893. [Google Scholar]
- 50.Chen P, Liang H, Shi A-C. Macromolecules. 2008;41(22):8938–8943. [Google Scholar]
- 51.Nykänen A, Nuopponen M, Hiekkataipale P, Hirvonen S-P, Soininen A, Tenhu H, Ikkala O, Mezzenga R, Ruokolainen J. Macromolecules. 2008;41(9):3243–3249. [Google Scholar]
- 52.Nykänen A, Nuopponen M, Laukkanen A, Hirvonen S-P, Rytelä M, Turunen O, Tenhu H, Mezzenga R, Ikkala O, Ruokolainen J. Macromolecules. 2007;40(16):5827–5834. [Google Scholar]
- 53.Adelsberger J, Kulkarni A, Jain A, Wang W, Bivigou-Koumba AM, Busch P, Pipich V, Holderer O, Hellweg T, Laschewsky A, Müller-Buschbaum P, Papadakis CM. Macromolecules. 2010;43(5):2490–2501. [Google Scholar]
- 54.Adelsberger J, Metwalli E, Diethert A, Grillo I, Bivigou-Koumba AM, Laschewsky A, Müller-Buschbaum P, Papadakis CM. Macromol. Rapid Commun. 2012;33(3):254–259. doi: 10.1002/marc.201100631. [DOI] [PubMed] [Google Scholar]
- 55.Hillamo RE, Kauppinen EI. Aerosol Sci. Technol. 1991;14(1):33–47. [Google Scholar]
- 56.Mastronarde DN. Journal of Structural Biology. 2005;152(1):36–51. doi: 10.1016/j.jsb.2005.07.007. [DOI] [PubMed] [Google Scholar]
- 57.Kremer JR, Mastronarde DN, McIntosh JR. Journal of Structural Biology. 1996;116(1):71–76. doi: 10.1006/jsbi.1996.0013. [DOI] [PubMed] [Google Scholar]
- 58.Pettersen EF, Goddard TD, Huang CC, Couch GS, Greenblatt DM, Meng EC, Ferrin TE. J. Comput. Chem. 2004;25(13):1605–1612. doi: 10.1002/jcc.20084. [DOI] [PubMed] [Google Scholar]
- 59.Chu B. Laser Light Scattering : basic principles and practice. Academic Press; Boston: 1991. [Google Scholar]
- 60.Schärtl W. Light scattering from polymer solutions and nanoparticle dispersions. Springer Verlag; 2007. [Google Scholar]
- 61.Shan J, Chen J, Nuopponen M, Tenhu H. Langmuir. 2004;20(11):4671–4676. doi: 10.1021/la0363938. [DOI] [PubMed] [Google Scholar]
- 62.Shan J, Tenhu H. Chem. Commun. 2007;(44) doi: 10.1039/b707740h. [DOI] [PubMed] [Google Scholar]
- 63.Luo S, Xu J, Zhu Z, Wu C, Liu S. The Journal of Physical Chemistry B. 2006;110(18):9132–9139. doi: 10.1021/jp061055b. [DOI] [PubMed] [Google Scholar]
- 64.Xu J, Luo S, Shi W, Liu S. Langmuir. 2005;22(3):989–997. doi: 10.1021/la0522707. [DOI] [PubMed] [Google Scholar]
- 65.Taylor LD, Cerankowski LD. Journal of Polymer Science: Polymer Chemistry Edition. 1975;13(11):2551–2570. [Google Scholar]
- 66.Matsen MW. J. Chem. Phys. 1995;102(9):3884–3887. [Google Scholar]
- 67.Watanabe H. Macromolecules. 1995;28(14):5006–5011. [Google Scholar]
- 68.Watanabe H, Sato T, Osaki K, Yao M-L, Yamagishi A. Macromolecules. 1997;30(19):5877–5892. [Google Scholar]
- 69.Nuopponen M. Organized Nanostructures of Thermoresponsive Poly(N-isopropylacrylamide) Block Copolymers Obtained Through Controlled RAFT Polymerization. University of Helsinki; Helsinki: 2008. [Google Scholar]
Associated Data
This section collects any data citations, data availability statements, or supplementary materials included in this article.


