

Abstract
The thermodynamics of binding reactions is usually studied in the framework of the linear van’t Hoff analysis of the temperature dependence of the equilibrium constant. The logarithm of the equilibrium constant is plotted versus inverse temperature to discriminate between two terms: an enthalpic contribution that is linear in the inverse temperature, and a temperature-independent entropic contribution. When we apply this approach to a particular case—blockage of the anthrax PA63 channel by a multicharged cyclodextrin derivative—we obtain a nearly linear behavior with a slope that is characterized by enthalpy of about 1 kcal/mol. In contrast, from blocker partitioning between the channel and the bulk, we estimate the depth of the potential well for the blocker in the channel to be at least 8 kcal/mol. To understand this apparent discrepancy, we use a simple model of particle interaction with the channel and show that this significant difference between the two estimates is due to the temperature dependence of the physical forces between the blocker and the channel. In particular, we demonstrate that if the major component of blocker–channel interaction is van der Waals interactions and/or Coulomb forces in water, the van’t Hoff enthalpy of the binding reaction may be close to zero or even negative, including cases of relatively strong binding. The results are quite general and, therefore, of importance for studies of enzymatic reactions, rational drug design, small-molecule binding to proteins, protein–protein interactions, and protein folding, among others.
Keywords: protein-ligand binding, molecular docking
Motivated by the search for efficient small-molecule blockers of “virulent” transmembrane channels (1–3), we investigated the temperature behavior of the blockage reaction. The temperature dependence of the equilibrium constant of blocker association with the pore, that is, the reaction blocker(bulk) + channel(empty)  channel
  blocker, was found to be surprisingly weak, with the temperature coefficient
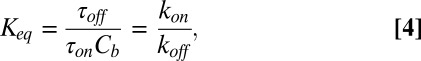
  1.08. Applying the standard linear van’t Hoff analysis to evaluate the enthalpy of an association reaction (4) to that of channel blockage (5), we arrive at an estimated enthalpy for the channel–blocker interaction of about 1 kcal/mol. However, examination of blocker partitioning between the bulk and the channel interior gives an estimate for the depth of the potential well for the blocker in the pore of at least 8 kcal/mol. Although these two estimates generally do not have to coincide, this impressive difference compelled us to take a detailed look at the assumptions that are often used in the thermodynamic analysis of blocking reactions as well as at the possible physical forces involved in the channel–blocker interaction. Our analysis is based on consideration of a simple model of particle interaction with the channel (6–8), which allows an explicit calculation of the involved thermodynamics. As might be expected, in the case of the temperature-independent flat potential well, the enthalpy of the binding reaction is equal to the depth of the potential well. However, in the realistic case of temperature-dependent interactions, the situation may be drastically different. In particular, we demonstrate that accounting for the temperature dependence of van der Waals and/or Coulomb forces may lead to very small or even negative enthalpy values. These conclusions go beyond the particular case of channel blockage to being helpful in the analysis of other problems such as protein–ligand binding, protein–protein interaction, and molecular docking for drug design, to mention just a few.
Results
The blockage of the anthrax PA63 channel by per-6-S-(3-amino)propylthio-β-cyclodextrin (AmPrβCD), a derivative of β-cyclodextrin carrying seven positive charges (1–3), is temperature-dependent. Fig. 1 gives three representative records of the ion current through a single channel at 15, 23, and 40 °C (Top to Bottom, respectively) in the presence of 0.3 μM AmPrβCD. It is seen that higher temperatures (i) speed up the kinetics of the blockage process and (ii) increase channel conductance. The increase in the on- and off-rates of the reaction manifests itself in the decrease of the average times spent by the channel in both open and blocked states. As temperature is elevated from 15 to 40 °C the conductance of the channel grows by a factor of 2, which is close to the effect of the temperature on ionic conductance of other large channels (9).
Fig. 1.

Typical recordings of an ionic current through a single PA63 channel in the presence of 0.3 μM AmPrβCD on the cis side of the membrane demonstrate temperature-dependent amplitudes and kinetics. Measurements were performed in 1 M KCl (pH 6.6) bathing solution at 50-mV transmembrane voltage and are presented at 10-ms time resolution. It can be seen that the current through the open channel and the frequency of blockage events increase with solution temperature, whereas the AmPrβCD binding time decreases.
Fig. 2 demonstrates the temperature dependence of the characteristic on- and off-times of the blockage reaction. Both the average time between successive blockages,  , measured at the fixed blocker concentration of 0.3 μM, and the average time the blocker molecule spends in the channel,
  , decrease with increasing temperature. The temperature-induced drop in
  only slightly exceeds that in
  . The times were calculated from the characteristic corner frequencies of Lorentzian spectra and the independently measured probability of finding the channel in the blocked state, as described earlier (3).
Fig. 2.

Kinetic parameters of AmPrβCD-induced current blockage depend on the temperature of the bathing solutions. Both  (time between successful blockages) and
  (binding time) decrease exponentially when the temperature increases. Error bars show SDs.
The plot of the natural logarithm of the equilibrium constant of the blocking reaction as a function of the inverse temperature, 1,000/T, the linear van’t Hoff plot (4), is given in Fig. 3. The equilibrium constant is calculated from the probability of finding the channel in the blocked state at a given blocker concentration, as described earlier (3). It is seen that within the accuracy of our measurements the dependence is linear and very weak. To illustrate this point, the figure also shows the conductivity of salt solution in the same temperature range, with  1.18.
1.18.
Fig. 3.

The equilibrium binding constant of AmPrβCD to the channel shows only slight temperature dependence (solid circles), which is even weaker than the temperature dependence of salt solution conductivity (open squares). Error bars show SDs.
Discussion
Temperature Dependence of the Equilibrium Binding Constant.
Our analysis of the data in Fig. 3 gives  1.38 for the change of the equilibrium constant when the temperature of the system is varied from 10 to 50 °C. This leads to a
  value of about (1.38)1/4
 1.08 that is significantly smaller than even the
  for solution conductivity. This weak dependence is usually interpreted as an anomalously low binding energy, which would correspond to a very shallow potential well for the blocker–channel attraction.
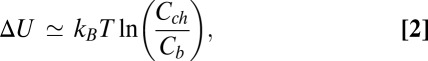
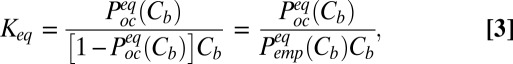
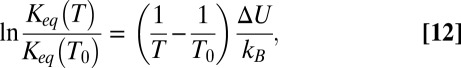
Indeed, if we fit the equilibrium constant data in Fig. 3 with the linear van’t Hoff equation widely used for the thermodynamic analysis of binding reactions (4, 10, 11),
where  and
and  are the absolute temperature and universal gas constant, respectively, and, if both enthalpy
  and entropy
  are assumed to be temperature-independent, we obtain
  1 kcal/mol or about 2
  per molecule, where
  is the Boltzmann constant. The enthalpy term is supposed to characterize the strength of the blocker–channel interaction and be equal to the depth
  of the temperature-independent flat potential well for the blocking particle inside the channel (see model considerations below).
This energy estimate is drastically smaller, by more than 10  , than the depth of the potential well estimated from blocker partitioning between the channel lumen and the bulk. For the depth of the potential well describing blocker partitioning under the simplifying assumptions detailed below, we have
 |
where  is the blocker concentration in the channel and
  is the blocker concentration in the bulk.
From the very beginning it is necessary to point out that Eq. 2 provides only the lower limit for the depth of the potential well describing the blocker–channel interaction. The main reason, as explained below, is that the notion of “blocker concentration in the channel” is a simplification based on the assumption of a homogeneous, square-well interaction potential for the blocker within the whole length of the blocker-accessible part of the channel. This concentration could be estimated by combining the data in Fig. 1, showing that channel occupancy by the blocker molecule is of the order of 1, with the existing predictions for the channel structure (12) illustrated in Fig. 4. However, even with the accepted simplifications, the estimate in Eq. 2 is inaccurate in the case of high occupancy, because of the strong repulsion between blocker molecules. To escape this additional complication, we make use of the data obtained at an order of magnitude lower blocker concentration in the bulk,  3 × 10⁻⁸ M (3). In this case the channel occupancy by the blocker,
  , which is equal to the average number of blocker molecules in the channel,
  , is much smaller than 1. Taking the values of
  1.2 s and
  0.11 s from figure 3 b and c of ref. 3, for this blocker concentration we have
  0.084. To calculate the blocker concentration in the channel,
  , we need an estimate for the volume
  available for the center of the blocker molecule inside the channel lumen,
 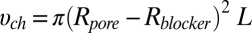 , where
  is the pore radius,
  is the blocker radius, and
  is the blocker-accessible channel length; we assume that this part of the channel has a cylindrical shape. Based on the structure of the blocker (2) and structural predictions of ref. 12 for the PA63 pore reproduced in Fig. 4, we accept the following values for the parameters:
  2 nm,
2 nm,  1 nm,
1 nm,  4 nm. This leads to
 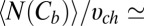 0.7 × 1025 m−3, which translates into the molar blocker concentration in the channel
  1.2 × 10⁻² M at
  3 × 10⁻⁸ M in the bulk. Substituting these concentrations into Eq. 2, we obtain
  13
13  or about 8 kcal/mol. It has to be noted here that this value gives only a lower estimate for the depth of the potential well, because the effective “binding volume” (13) of the blocker molecule can indeed be much smaller than the volume anticipated on the basis of the structure shown in Fig. 4.
Fig. 4.

Schematic representation of the PA63 channel and AmPrβCD (β-CD) drawn in CorelDRAW 11 (Corel Corporation) after the structure published in ref. 12. The rectangular well, two-rectangular well, and “binding site” and tilted potentials are plotted as explained in the Discussion. The vertical dashed lines indicate the part of the channel lumen accessible to the blocker molecule.
Thermodynamics of the Continuum Diffusion Model.
The huge difference in the two estimates above suggests that the physical forces responsible for the blocker interaction with the channel are temperature-dependent. Our further analysis is based on a simple model of particle interaction with the channel (6–8). We assume that (i) the maximal occupancy of the channel by a blocker molecule is one—to account for strong repulsion of the molecules carrying seven positive charges—and (ii) the blockage is a two-state Markov process, as is strongly supported by the simple Lorentzian shape of the spectral density reported earlier (3).
The equilibrium probability of finding the blocker in the channel,  , can be written as a function of blocker concentration in the bulk,
  , and the equilibrium binding constant,
  ,
,  . Therefore,
 |
where  is the probability of finding the channel empty. On the other hand,
 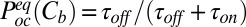 , so that
 |
where  and
and  are the on- and off-rate constants of the blockage, respectively,
  and
and  .
.
The equilibrium constant can also be expressed through the partition functions in the blocker-occupied,  , and blocker-empty,
  , states of the channel. Taking advantage of the fact that the ratio of the residence times entering into Eq. 4 is equal to the ratio of the partition functions of the occupied and empty states,
  , the equilibrium constant in Eq. 4 can be written as
 |
The partition function for the empty state is given by
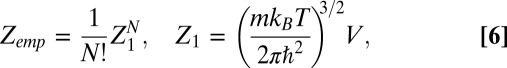 |
where  is the partition function of a single particle (blocker molecule) in the system of volume
  (14) and
  is the number of particles in this system, so that the bulk blocker concentration is
 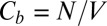 ,
,  is the blocking particle mass, and
  is the Planck constant. For the occupied state, the partition function is
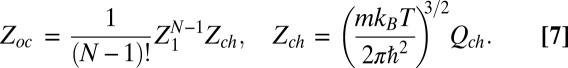 |
Here  is the configuration integral (14),
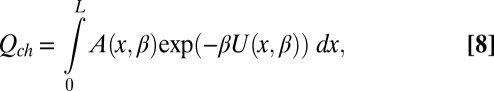 |
where  ,
,  is a coordinate measured along the channel axis,
  ,
,  is the coordinate-dependent cross-sectional area of the channel, and
  is the coordinate-dependent potential of mean force describing particle interaction with the channel (6–8). Both the cross-sectional area and the potential of mean force are, in general, functions of temperature. It should be noted here that a rigorous evaluation of the configuration integral for a particular system must include the effects of the changes in all internal degrees of freedom, including those of the water molecules that are pushed out by the blocker molecule, the change in blocker and channel hydration, and so forth. However, for the purpose of the present analytical consideration, all these effects can be packed into the cross-sectional area
  and the potential of mean force
  , whose temperature dependences would then account for the above-mentioned effects. From Eqs. 5–7 it follows that
and the van’t Hoff equation is
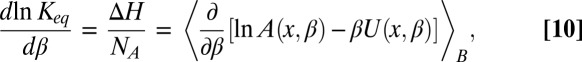 |
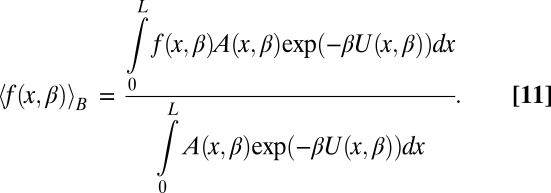
where  is the Avogadro number and the angular brackets denote Boltzmann averaging over the channel,
 |
Temperature-Independent Rectangular Potential.
We first consider the case of a cylindrical channel of radius  and length
  , assuming that the interaction with the blocker particle is described by a square-well potential of depth
  , which is temperature-independent (Fig. 4A). For such a channel, Eq. 10 takes the form
  , leading to
 |
where  is a reference temperature. It is seen that Eq. 12 yields a linear dependence of
  on the inverse temperature with the slope equal to the well depth that characterizes the strength of blocker–channel interaction, measured in
  units. Importantly, in this case,
  , that is, the depth of the potential well equals the enthalpy of the binding reaction.
Arbitrary Temperature-Independent Potential.
The square-well potential of mean force occupying the entire blocker-accessible part of the channel represents a grossly simplified situation. We will now consider a cylindrical channel with an arbitrary coordinate-dependent potential. In this case, it is easy to show that Eq. 1 does not hold true even for temperature-independent  and a constant cross-sectional area. Indeed, from Eq. 10 it follows that the derivative
  is
is
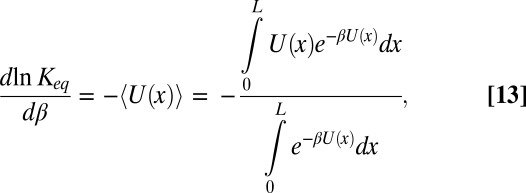 |
where the Boltzmann-averaged potential  is a function of temperature. This temperature dependence comes from the fact that at different temperatures the blocker molecule explores different parts of the potential well with different probabilities.
As an example, consider the case when the bottom of the potential well occupying the entire channel is a step with the parameters  and
and  and the corresponding depths
  and
and  , as shown in Fig. 4B. In such a case, Eq. 10 leads to
 |
This shows that  is a function of temperature unless
  =
=  and/or
  or
or  is zero. As a consequence, Eq. 1 is inapplicable in this case.
Nevertheless, in many important cases of temperature-independent  , the plot of
  versus
  in the narrow temperature range corresponding to functional protein states is remarkably linear. One of them corresponds to
  or
or  . Another one is the case of a localized potential well—a narrow deep binding site, illustrated in Fig. 4C. Similar close-to-linear behavior is found for a tilted potential (Fig. 4D) when the slope of the tilt is large enough. Moreover, as we demonstrate below, even in the case of a temperature-dependent potential, which leads to
  for the square-well potential shown in Fig. 4A, the van’t Hoff plot may be nearly linear.
Temperature-Dependent Strength of the Interaction: Electrostatic, van der Waals, and Hydrogen-Bonding Forces.
In the considerations presented above, we assumed that the physical interactions, described by the potential of mean force, are temperature-independent. However, for the water-filled channel pore under consideration, this is hardly the case, and potential  is a function of temperature. Then, in the simplest case of a cylindrical channel with the square-well potential of depth
  (Fig. 4A), Eq. 10 leads to
 |
As we show below, the temperature dependence of the interactions determining the depth  of the potential well is able to significantly change the slope
  and even invert its sign.
Experimental evidence, especially the strong reduction in binding strength with the increase in bathing solution salt concentration (3), suggests that the channel–blocker interaction involves Coulomb forces. If so, the depth of the potential is expected to be temperature-dependent. This is due to the temperature dependence of the water dielectric constant  −1.35 at room temperature (15).
Let us consider a hypothetical case wherein the depth of the potential well is defined by Coulomb interactions between the “fixed” charges on the channel lumen and the charge on the blocker molecule. The interaction energy of two charges  and
and  positioned at distance
  in 1:1 electrolyte with number concentration
  m−3, where
  is the molar electrolyte concentration and
  is the elementary charge, is given by
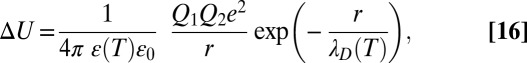 |
where  is the dielectric constant of vacuum,
  is the temperature-dependent ratio of the dielectric constant of the medium to that of vacuum, and
  is the temperature-dependent Debye length,
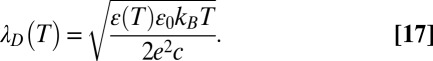 |
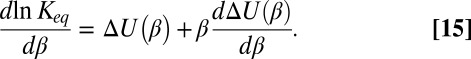
Thus, the temperature behavior of the equilibrium constant, Eq. 15, depends on both the changing dielectric constant and the distance between charges. The temperature dependence of the dielectric constant for macroscopic samples of water is well-studied. If the values of  are taken for bulk water, which are 84.1 at 10 °C and 69.9 at 50 °C (15), then the expected temperature dependence of
  not only gets weaker but is reversed. We plotted this dependence in Fig. 5 (solid line) in comparison with the dependence expected for the temperature-independent rectangular potential well of depth
  = 13
= 13  at 20 °C (dashed-dotted line). The solid line is calculated by substituting Eqs. 16 and 17 into 15 and taking the temperature-dependent
  from ref. 15. Other parameters are
  =
=  = 7
= 7  ,
,  = 6.02 × 1026 m−3 (1 M KCl), and
  = 0.51 nm (to match 13
  at 20 °C for the dashed-dotted line). For both curves, we use the same reference temperature,
  = 20 °C, to facilitate their comparison. It is clear that the formal application of Eq. 1 would give a negative enthalpic contribution even in the case of very deep potential wells, corresponding to the strong attractive interactions between the channel and the blocker.
Fig. 5.

The van’t Hoff plots of the temperature dependence of the equilibrium constant are very sensitive to a particular interaction responsible for the depth of potential wells shown in Fig. 4. The dash-dotted line shows  calculated according to Eq. 12 with the temperature-independent potential well depth
  = 13
= 13  using
using  = 20 °C as the reference temperature, indicated by the vertical dashed line. In the case of Coulomb interactions, the temperature dependence of the dielectric constant may significantly compensate the van’t Hoff slope and even lead to its inversion, staying approximately linear in this temperature range. This is illustrated by the solid curve calculated according to Eqs. 15–17, as explained in the text. Temperature dependence of van der Waals (vdW) forces may induce slope corrections in the same direction, whereas in the case of hydrogen bonding the slope of the temperature dependence is expected to increase (arrows around the dash-dotted line).
In the case of van der Waals forces at room temperature, the corresponding  is supposed to grow nearly proportionally to the temperature (16). Then, Eq. 15 leads to
  , and the enthalpy calculated from the linear van’t Hoff plot is close to zero. On the contrary, the forces due to hydrogen bonding may decrease linearly with temperature (17). Thus, according to Eq. 15, the slope of the temperature dependence of
  will increase, as illustrated by the counterclockwise arrow in Fig. 5. It should be noted that quantitative treatment of these two cases is complicated. The point is that the depth of the potential well for the blocker in the channel is the difference between the temperature-dependent van der Waals and hydrogen-bonding interactions of the blocker molecule with water in the bulk and with water and protein in the channel. Therefore, the explicit calculation of the slopes is not as straightforward as for Coulomb interactions in bulk water, and only tentative directions of slope changes, assuming predominance of interactions with the channel, are given in Fig. 5. The crucial importance of hydration effects is commonly recognized in the wide spectrum of biologically relevant processes from simple binding reactions (18) to macromolecular association (19) and protein folding (20).
Conclusions
Evaluating the depth of the potential well describing the blocker interaction with the anthrax channel, we have shown that the linear van’t Hoff analysis of the temperature dependence of  may be grossly misleading (21, 22) because of the temperature dependence of the actual physical forces involved in the blocker–channel interaction. The enthalpy of the reaction is equal to the potential well depth only for temperature-independent interactions and a simple shape of the well. Importantly, in the narrow temperature range corresponding to the fully functional conformations of many proteins,
  can be nearly linear in the inverse temperature even if the interactions are temperature-dependent. This is illustrated by a hypothetical case of purely Coulombic interaction shown by the solid line in Fig. 5. We conclude that in the case of van der Waals or Coulomb interactions, one should generally expect a decrease or even a change in the sign of the slope of the van’t Hoff plot. At the same time, for interactions whose strength decreases with temperature, such as hydrogen bonding, the slope of the plot characterizing the apparent enthalpy increases.
Although the analysis given above deals with a relatively narrow subclass of binding reactions, namely channel blockage by a low–molecular-weight compound, the results obtained clearly go well beyond this example. For example, in many instances of theoretical analysis of experimental data on ion channels, the temperature dependence of channel conductance is used to estimate the number and structure of barriers and wells for ion translocation. Our results clearly demonstrate that a straightforward interpretation of the temperature effects in terms of the rate theory may be misleading if the temperature dependence of barriers and wells is ignored. In many cases of practical interest, the energy landscape seen by an ion in the channel is a sum of contributions due to interactions of different natures, as exemplified by the analysis of selectivity of potassium channels (23). As many of these interactions, similar to Coulomb forces in water, include an entropic component (24), caution is needed in interpreting experimental results. Only highly detailed approaches, such as all-atom molecular dynamics simulations, where temperature effects on all of the elements of the system are explicitly taken into account, can be free of this defect. However, this is not necessarily true for methods of multiscale modeling, which inevitably include certain simplifications of interaction potentials.
For the AmPrβCD interaction with the PA63 pore studied here, the involvement of electrostatics is made clear by the strong decrease in blocker binding at increasing salt concentration in the membrane-bathing solution (3). According to the arguments presented above, the temperature dependence of  could be expected not only to be reduced but inverted. In reality, the temperature dependence of the forces creating the potential well for the blocker molecule in the channel is much more complex. Even if long-range electrostatics were the major driving force of the binding reaction, calculating the total electrostatic energy is not an easy task (25). Several effects should be taken into account. First, the Debye screening in the channel must be different from that in the bulk due to limitation of space and, therefore, of the number of available counterions in the channel cavity. Second, the dielectric behavior of water in the strong fields around a 3-nm–diameter particle carrying seven positive charges and in the predominantly negatively charged channel pore is significantly different from that of bulk water (26), including its dependence on temperature. Third, as the binding reaction takes place within the strong confinement of the channel-forming protein, protein dielectric properties and its conformational dynamics are of importance. Except for field-induced dielectric response saturation, these effects are able to factor in both directions, either increasing temperature sensitivity or decreasing it. Nevertheless, we hope that our thermodynamic analysis of this particular case—blockage of the anthrax PA63 channel by a cationic blocker—within the framework of a simple model will provide valuable insights for the broad community of researchers who work on similar problems, including those of structure-inspired design of new efficient drugs.
Materials and Methods
Reagents, lipid bilayer technique (after ref. 27), and methods of channel reconstitution were identical to those described earlier (3). Different temperatures were maintained with a thermostatic bath connected to a water jacket with the bilayer chamber (3) and controlled by a Cole-Parmer (model 92000-00) Digi-Sense scanning thermometer. AmPrbCD was custom synthesized at CycloLab (Budapest, Hungary) with the details of the synthesis given earlier (2).
Acknowledgments
We thank Donald Rau for fruitful discussions and reading the manuscript. This study was supported by the Intramural Research Program of the National Institutes of Health, Eunice Kennedy Shriver National Institute of Child Health and Human Development, and Center for Information Technology.
Footnotes
The authors declare no conflict of interest.
*This Direct Submission article had a prearranged editor.
References
- 1.Karginov VA, Nestorovich EM, Moayeri M, Leppla SH, Bezrukov SM. Blocking anthrax lethal toxin at the protective antigen channel by using structure-inspired drug design. Proc Natl Acad Sci USA. 2005;102(42):15075–15080. doi: 10.1073/pnas.0507488102. [DOI] [PMC free article] [PubMed] [Google Scholar]
- 2.Karginov VA, et al. Search for cyclodextrin-based inhibitors of anthrax toxins: Synthesis, structural features, and relative activities. Antimicrob Agents Chemother. 2006;50(11):3740–3753. doi: 10.1128/AAC.00693-06. [DOI] [PMC free article] [PubMed] [Google Scholar]
- 3.Nestorovich EM, Karginov VA, Berezhkovskii AM, Bezrukov SM. Blockage of anthrax PA63 pore by a multicharged high-affinity toxin inhibitor. Biophys J. 2010;99(1):134–143. doi: 10.1016/j.bpj.2010.03.070. [DOI] [PMC free article] [PubMed] [Google Scholar]
- 4.Voet D, Voet JG. Biochemistry. New York: John Wiley; 1995. [Google Scholar]
- 5.Arias HR. Temperature and ionic strength dependence of quinacrine binding and quinacrine displacement elicited by high concentrations of agonists on the nicotinic acetylcholine receptor. Arch Biochem Biophys. 1996;333(1):1–11. doi: 10.1006/abbi.1996.0357. [DOI] [PubMed] [Google Scholar]
- 6.Berezhkovskii AM, Bezrukov SM. Optimizing transport of metabolites through large channels: Molecular sieves with and without binding. Biophys J. 2005;88(3):L17–L19. doi: 10.1529/biophysj.104.057588. [DOI] [PMC free article] [PubMed] [Google Scholar]
- 7.Bezrukov SM, Berezhkovskii AM, Szabo A. Diffusion model of solute dynamics in a membrane channel: Mapping onto the two-site model and optimizing the flux. J Chem Phys. 2007;127(11):115101. doi: 10.1063/1.2766720. [DOI] [PubMed] [Google Scholar]
- 8.Berezhkovskii AM, Pustovoit MA, Bezrukov SM. Fluxes of non-interacting and strongly repelling particles through a single conical channel: Analytical results and their numerical tests. Chem Phys. 2010;375(2-3):523–528. doi: 10.1016/j.chemphys.2010.04.040. [DOI] [PMC free article] [PubMed] [Google Scholar]
- 9.Biró I, Pezeshki S, Weingart H, Winterhalter M, Kleinekathöfer U. Comparing the temperature-dependent conductance of the two structurally similar E. coli porins OmpC and OmpF. Biophys J. 2010;98(9):1830–1839. doi: 10.1016/j.bpj.2010.01.026. [DOI] [PMC free article] [PubMed] [Google Scholar]
- 10.Boysen RI, Wang Y, Keah HH, Hearn MTW. Observations on the origin of the non-linear van’t Hoff behaviour of polypeptides in hydrophobic environments. Biophys Chem. 1999;77(2-3):79–97. doi: 10.1016/s0301-4622(99)00002-2. [DOI] [PubMed] [Google Scholar]
- 11.Perozzo R, Folkers G, Scapozza L. Thermodynamics of protein-ligand interactions: History, presence, and future aspects. J Recept Signal Transduct Res. 2004;24(1-2):1–52. doi: 10.1081/rrs-120037896. [DOI] [PubMed] [Google Scholar]
- 12.Katayama H, et al. GroEL as a molecular scaffold for structural analysis of the anthrax toxin pore. Nat Struct Mol Biol. 2008;15(7):754–760. doi: 10.1038/nsmb.1442. [DOI] [PMC free article] [PubMed] [Google Scholar]
- 13.Gilson MK, Given JA, Bush BL, McCammon JA. The statistical-thermodynamic basis for computation of binding affinities: A critical review. Biophys J. 1997;72(3):1047–1069. doi: 10.1016/S0006-3495(97)78756-3. [DOI] [PMC free article] [PubMed] [Google Scholar]
- 14.Ben-Naim A. Water and Aqueous Solutions. New York: Plenum; 1974. [Google Scholar]
- 15. Army Cold Regions Research and Engineering Laboratory Report. (2007) Available at www.tpub.com/content/ArmyCRREL/SR98_02/SR98_020009.htm.
- 16.Parsegian VA. van der Waals Forces: A Handbook for Biologists, Chemists, Engineers, and Physicists. Cambridge, UK: Cambridge Univ Press; 2005. [Google Scholar]
- 17.Dougherty RC. Temperature and pressure dependence of hydrogen bond strength: A perturbation molecular orbital approach. J Chem Phys. 1998;109:7372–7378. [Google Scholar]
- 18.Gurnev PA, Harries D, Parsegian VA, Bezrukov SM. Osmotic stress regulates the strength and kinetics of sugar binding to the maltoporin channel. J Phys Condens Matter. 2010;22(45):454110. doi: 10.1088/0953-8984/22/45/454110. [DOI] [PMC free article] [PubMed] [Google Scholar]
- 19.Stanley C, Rau DC. Evidence for water structuring forces between surfaces. Curr Opin Colloid Interface Sci. 2011;16(6):551–556. doi: 10.1016/j.cocis.2011.04.010. [DOI] [PMC free article] [PubMed] [Google Scholar]
- 20.Privalov PL. Thermodynamic problems in structural molecular biology. Pure Appl Chem. 2007;79:1447–1462. [Google Scholar]
- 21.Naghibi H, Tamura A, Sturtevant JM. Significant discrepancies between van’t Hoff and calorimetric enthalpies. Proc Natl Acad Sci USA. 1995;92(12):5597–5599. doi: 10.1073/pnas.92.12.5597. [DOI] [PMC free article] [PubMed] [Google Scholar]
- 22.Chaires JB. Calorimetry and thermodynamics in drug design. Annu Rev Biophys. 2008;37:135–151. doi: 10.1146/annurev.biophys.36.040306.132812. [DOI] [PubMed] [Google Scholar]
- 23.Noskov SY, Roux B. Importance of hydration and dynamics on the selectivity of the KcsA and NaK channels. J Gen Physiol. 2007;129(2):135–143. doi: 10.1085/jgp.200609633. [DOI] [PMC free article] [PubMed] [Google Scholar]
- 24.Jackson MB. Molecular and Cellular Biophysics. Cambridge, UK: Cambridge Univ Press; 2006. [Google Scholar]
- 25.Gilson MK, Honig B. Calculation of the total electrostatic energy of a macromolecular system: Solvation energies, binding energies, and conformational analysis. Proteins. 1988;4(1):7–18. doi: 10.1002/prot.340040104. [DOI] [PubMed] [Google Scholar]
- 26.Aguilella-Arzo M, Andrio A, Aguilella VM, Alcaraz A. Dielectric saturation of water in a membrane protein channel. Phys Chem Chem Phys. 2009;11(2):358–365. doi: 10.1039/b812775a. [DOI] [PubMed] [Google Scholar]
- 27.Montal M, Mueller P. Formation of bimolecular membranes from lipid monolayers and a study of their electrical properties. Proc Natl Acad Sci USA. 1972;69(12):3561–3566. doi: 10.1073/pnas.69.12.3561. [DOI] [PMC free article] [PubMed] [Google Scholar]