

Abstract
Background
Despite a pressing and well-documented need for better sharing of information on clinical trials data quality assurance methods, many research organizations remain reluctant to publish descriptions of and results from their internal auditing and quality assessment methods.
Purpose
We present findings from a review of a decade of internal data quality audits performed at the Duke Clinical Research Institute, a large academic research organization that conducts data management for a diverse array of clinical studies, both academic and industry-sponsored. In so doing, we hope to stimulate discussions that could benefit the wider clinical research enterprise by providing insight into methods of optimizing data collection and cleaning, ultimately helping patients and furthering essential research.
Methods
We present our audit methodologies, including sampling methods, audit logistics, sample sizes, counting rules used for error rate calculations, and characteristics of audited trials. We also present database error rates as computed according to two analytical methods, which we address in detail, and discuss the advantages and drawbacks of two auditing methods used during this ten-year period.
Results
Our review of the DCRI audit program indicates that higher data quality may be achieved from a series of small audits throughout the trial rather than through a single large database audit at database lock. We found that error rates trended upward from year to year in the period characterized by traditional audits performed at database lock (1997–2000), but consistently trended downward after periodic statistical process control type audits were instituted (2001–2006). These increases in data quality were also associated with cost savings in auditing, estimated at 1000 hours per year, or the efforts of one-half of a full time equivalent (FTE).
Limitations
Our findings are drawn from retrospective analyses and are not the result of controlled experiments, and may therefore be subject to unanticipated confounding. In addition, the scope and type of audits we examine here are specific to our institution, and our results may not be broadly generalizable.
Conclusions
Use of statistical process control methodologies may afford advantages over more traditional auditing methods, and further research will be necessary to confirm the reliability and usability of such techniques. We believe that open and candid discussion of data quality assurance issues among academic and clinical research organizations will ultimately benefit the entire research community in the coming era of increased data sharing and re-use.
Introduction
A number of authors have commented on the relative dearth of publications evaluating clinical trials data quality.1–13 Research organizations may be reluctant to publish such information; many organizations regard audit information as highly confidential and may withhold it even from sponsors. In addition, there is no universally-accepted method for calculating an error rate by which an organization's performance can be judged both internally and externally. Methodological variations make comparison difficult,14 and what constitutes “acceptable” data quality for a given clinical trial depends on multiple factors, including the variables in which the errors occur, the type and extent of the errors, and the robustness of the statistical analysis with respect to errors.
Despite these difficulties, it is increasingly important that research organizations share data quality information. Trials performed under federal government sponsorship receiving “$500,000 or more in direct costs in any single year” are expected to include a plan for public sharing of data (or a justification for not doing so); such sharing can subject data to many years of use unanticipated by the study's original designers.15 Rising costs are also driving researchers in both academia and industry to seek more cost-effective approaches to collecting and managing data, including strategies for using existing data resources. Different data collection and management methods, such as the presence or absence of on-screen checks in trials that use electronic data capture (EDC), or requirements for medical record abstraction, can profoundly affect both data quality and the capacity to measure it. In addition, ongoing projects by the U.S. Food and Drug Administration (FDA), such as the Electronic ECG warehouse and JANUS, will allow the FDA to analyze data from multiple clinical trials and detect safety signals within drug classes, device types, or within specific population subsets. Such measures may at a minimum require improvements in information about data quality, and there have even been calls for independent auditing of research data.16
In this review, we examine data audit methods and practices from 10 years of clinical trials data collection conducted at the Duke Clinical Research Institute (DCRI), and discuss some of the advantages and disadvantages encountered with two of the primary methods used to audit clinical data.
General audit methodology
At a superficial level, there appears to be a consistent process for conducting a CRF-to-database audit for a study that uses paper CRFs. First, an appropriate sampling frame is determined and a sample is selected, usually by subjects, subject-forms, or subject-visits. Data listings are then retrieved programmatically or obtained as screen prints. CRF data, including any corrections, are compared to data listings, and any discrepancies not explained by data correction forms (DCFs), queries, or study documentation (such as data processing guidelines), are counted as errors. Error rates are then calculated by dividing the number of errors by the number of data fields inspected.12,14
A more detailed examination, however, may reveal significant methodological variations in counting errors and in ascertaining the total number of data fields (used as the error rate denominator).14,17 For example, a word misspelled when typed into a free text field, conversion of abbreviations or symbols, or failure to flag marginal comments may be counted as errors by some but not by others. Further, instances of a page entered under the wrong patient identifier or visit number, or entry of an incorrect visit date that is propagated to every page of the visit by the data collection system may be counted as single or multiple errors. Similar issues arise with the calculation of the denominator. One organization may count the propagated visit date as a single field; another may count it once for every record or table to which it is propagated. These counting differences can cause calculated error rates to vary by a factor of two or more. For this reason, we describe in detail our audit methodology and counting rules. We also present error rates as we calculate them internally, and as prescribed by Good Clinical Data Management Practices (GCDMP).
DCRI audit methodology, 1997–2006
Prior to 1997, data quality control activities at the DCRI were conducted by the study statistician as part of data cleaning; there were no independent or formal data quality control groups or processes in place. The advantage of this method was that, with direct involvement of the statistician, methods for producing high-quality data were customized for individual trials and activities were driven by analysis priorities. Disadvantages included diversion of statisticians from analysis activities and the use of nonsystematic or inconsistent methodologies between trials.
In 1997, the DCRI created a data quality control group. The group was pseudo-independent, in that it reported through management channels separate from those of data managers, but was located in the same department. The advent of this group, combined with the implementation of a commercial clinical data management system (CDMS) that provided process standardization, resulted in more formal and structured data management and auditing processes. From 1997–mid-2001, the quality control group performed pre–database-lock audits on most DCRI trials. These were conducted at analysis points (e.g., interim and final analyses) and comprised both CRF-to-database and process audits of the data entry and cleaning operation. The process audit included a review of study-specific data management documentation to verify compliance with DCRI standard operating procedures (SOPs), as well as interviews with data operators to ascertain their level of understanding of trial-specific procedures and to inquire about process deviations identified in the CRF-to-database audit. The process audit also included a review of training documentation.
During this period, 69 CRF-to-database audits were conducted, of which 33 were pre-lock audits and 36 were interim audits. Audits were powered for decision-making at both the overall and critical variable levels, with an average of 18,011 total fields and 8,295 critical variable fields inspected per audit. These audits were expensive and time-consuming: a pair of auditors typically required a week to complete each audit. Small trials and government-funded studies could not afford such audits; when they were performed, the DCRI often bore the expense. In addition, acquiring audit results a few weeks prior to database lock did little to improve quality or reduce costs.
In 2001, the DCRI implemented a statistical process control (SPC) approach to data quality control, whereby a smaller, 1250-field sample (selected according to an International Organization for Standardization [ISO] 2859-1-1999 sampling system at general inspection level III) is audited throughout the trial, at a frequency commensurate with data volume. (As of the end of 2006, DCRI has employed SPC in 260 audits performed in 89 clinical trials.) As part of this approach, a chart like the one shown in Figure 1 is created for each study. The project team then addresses any points that appear above the upper control limits. Such outliers are most likely not due to random variation but instead arise from an identifiable, correctable cause. In Fig. 1, the root cause of the outliers was determined to be ineffective training regarding a data processing convention, which caused a page of data to be entered under the wrong patient number—a single mistake that led to whole page of errors being counted. Because of this finding, training material was updated and more intensive training was provided. Interestingly, this scenario also illustrates that errors may not be independent, although many methods assume this. Further work is needed to characterize the distribution of data errors.
Figure 1.

Chart created as part of DCRI statistical process control methodology. The DCRI project team typically addresses any outliers that appear above the upper control limit (UCL). In the case illustrated here, the outlier above the UCL was deemed to be due to inadequate training in a data processing convention.
Use of SPC for monitoring data quality has a number of advantages. It provides early and ongoing information about data quality18; moreover, systematic problems are usually identified in the first sample. This in turn helps prevent future errors (thus reducing resources expended in correcting them), which is of particular benefit to small, low-budget research efforts. Trials with limited budgets can elect to undergo a single audit to identify systematic errors; the results can then be compared with the overall departmental rate.
SPC has disadvantages, however. The sample size for each audit is relatively small, meaning that low-incidence but possibly systematic errors are less likely to be detected. Thus, information about error distribution is not obtained until several samples are performed. Also, because audits are performed continuously, data processing discrepancies that might have been corrected by the time of database lock will be counted as errors. Additionally, we have found that most industry sponsors still prefer a single large audit, performed at database lock.
The methods used for CRF-to-database comparisons have not changed substantially over the years at the DCRI. When all fields are audited, we typically use screen prints listing the data in the clinical database for each subject in the audit. When selected fields are audited, as in cases where a sponsor requests a special audit focusing on critical variables, we program and validate a data listing that contains only those fields.
Our error counting rules have also remained constant: any discrepancy not explained by study documentation is counted as an error. Data-entry personnel are instructed to enter data as it appears on the CRF unless otherwise directed by a data processing convention; deviations from this process are counted as errors. Comment fields not processed according to instructions are also counted as errors. Data processing aids such as notes or flags that are part of our internal system and do not affect the data per se are not counted as errors, and data entered into them are not likely to be included in programmed analyses. If a record, page, or visit is entered under the wrong patient identifier or visit number, all fields on that page are counted as errors. Other errors include: duplication of records; items appearing on DCFs or queries but not entered into the database; deviations from spelling as it appears on the CRF; and failure to enter marginal comments when directed to do so by data processing conventions.
Our process for calculating the error rate denominator changed from 1997 to 1998. Prior to 1998, the DCRI used standard GCDMP methodology; after 1998, the DCRI established the error rate denominator as a strict calculation of all non-null fields audited. If a field is blank on the CRF and in the database, it is not counted in the denominator: only fields entered on either the CRF or in the database are counted. This differs from the GCDMP method, which includes both null and non-null CRF fields. For each audit, we calculate a response index (the number of non-null fields divided by the total number of CRF fields).
Derived or calculated fields, such as age calculated from date of birth, are not included in the error rate, nor are fields programmed and populated based on the value of another field, such as header variables and sequence or line numbers. We also do not include system variables in our field count, since including propagated fields and system variables greatly increases the denominator and artificially decreases the error rate.
Results
Figure 2 summarizes average yearly error rates for trials conducted in 1997–2006. Annual error rates range from 0.1%–0.38%. These data show a steady increase in error rates from 1997–2000, an increase that overlaps a period when our processes and systems were becoming more standardized and sophisticated, data managers were being trained much more intensively, and data were being processed more promptly than before. This period was also characterized by an increasing volume and diversity of work, a corresponding growth in data management staff, and the lack of an independent assessment of data quality before a trial's end.
Figure 2.

Database error rates by year, 1997–2006. From 1997–2001, variability and the central tendency of the error rates for all database-lock audits performed prior to start of SPC audits trend upward. After SPC implementation in third quarter 2001, data variability declined and quality increased.
It is also important to examine variability in error rates across studies. Figure 2 shows that variability and the central tendency of the error rates for all database-lock audits performed between 1997 and 2001 prior to start of SPC audits were trending upward. After SPC was implemented in the third quarter of 2001, data variability declined and quality increased. An analysis of cost information indicates that SPC appears to have saved about 1000 hours per year, or half of a full-time equivalent (FTE) effort (Figure 3). In addition, more trials per year were audited. Data displayed in Figure 4, summarizing the annual yearly error rate from SPC trial audits, show a steady decrease in error rate (i.e., an increase in data quality). From Figures 2 and 4, we see that annual error rates steadily decreased each year after the implementation of SPC audits, the opposite of the trend observed with traditional database lock audits.
Figure 3.

Hours spent on auditing per year, 1999–2006. Cost analysis suggests that SPC saved about 1000 hours per year, or half of a full-time equivalent (FTE) effort.
Figure 4.

DCRI overall error rate for SPC audits, 2001–2006. Data show a downward trend in error rates following the initiation of SPC audits (and therefore an increase in data quality).
We also analyzed annual error rates for critical variables. The critical variable error rate is the number of errors in critical fields divided by the number of critical fields inspected (as opposed to divided by the total number of database fields, which indicates the portion of the total error rate due to errors in critical fields). As shown in Figure 5, we observed a decrease in critical variable error rates corresponding to decreases in the annual overall database error rate, although in 2000, the critical variable error rate was higher than the overall error rate. Clearly, with training and data cleaning focused on data critical to the analysis, we would expect critical variable error rates to be lower on each study. However, critical variables did not comprise a consistent percentage of the database fields (Table 1), due to wide variations in trial aims and methodologies.
Figure 5.

Annual critical variable error rates, 1999–2006. Critical variable error rates generally declined in tandem with total database error rates. The exception observed for 2000 (in which critical variable rate exceeded overall error rate) may be attributable to variation in trial methodologies and aims.
Table 1.
Critical variable error rate volatility. Critical variables did not comprise a consistent percentage of the database fields due to wide variations in trial aims and methodologies.
| Year | Critical variables (%) | Critical variable error rate (per 10,000 fields) | Overall error rate (per 10,000 fields) |
|---|---|---|---|
| 1997 | 20.0% | 8.4 | 10.67 |
| 1998 | – | – | 17.1 |
| 1999 | 8.8% | 6.0 | 23.8 |
| 2000 | 44.7% | 42.7 | 38.1 |
| 2001 | 45.3% | 22.9 | 37.3 |
| 2002 | 16.3% | 25.7 | 33.5 |
| 2003 | 15.5% | 24.3 | 30.7 |
| 2004 | 30.8% | 7.6 | 20.4 |
| 2005 | 31.8% | 9.6 | 19.3 |
| 2006 | 20.8% | 10.8 | 17.9 |
We also calculated error rates using GCDMP methodology for comparison with DCRI methodology (Figure 6). As expected, GCDMP methods consistently yield a lower error rate, with differences ranging from a factor of 1.5 to a factor of 9.5; the variance being driven by the degree of sparseness of data on CRFs.
Figure 6.

DCRI error rates compared with GCDMP error rates, 1997–2006. GCDMP methods consistently yield lower error rates. Differences range from a factor of 1.5 to a factor of 9.5; the variance is a function of degree of sparseness of data on CRFs.
Analytic Results
Given the error rates presented here and the lack of an industry-wide standard error rate, how do we answer the key question: “Are the data clean enough?” Although others have used simulation to explore this question,19–21 we instead chose an analytical approach. Errors affect planned analyses in a clinical trial by impacting reliability—the ratio of true variance to observed variance. Reliability increases as variance due to error decreases; further, the sample size needed to maintain statistical validity in the presence of variance due to error is the original sample size divided by the reliability (a number between zero and one). Because errors increase variance, their presence necessitates a corresponding increase in sample size to maintain the desired statistical power. A common model for the primary analysis is shown in Figure 7, where Y is the outcome of interest (e.g., blood pressure), X is the predictor of interest (e.g., drug group in [placebo vs. active agent]), Z is a known covariate of interest (e.g., sex), and W is a variable collected as part of the study, but not considered in the analysis or thought to moderate the impact X and Z on the outcome.
Figure 7.
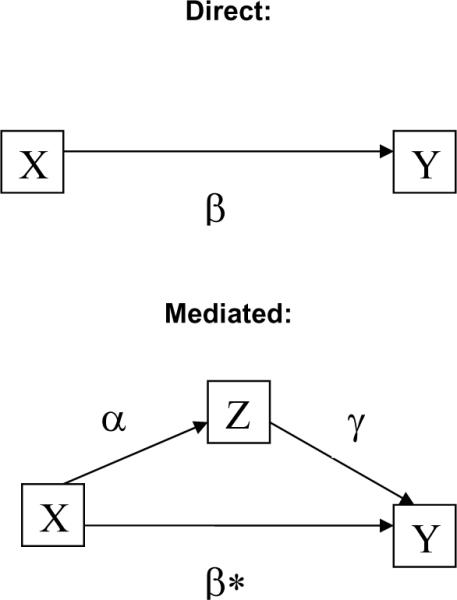
Model of interaction of errors and analyses, direct and mediated. Y is the outcome of interest (e.g., blood pressure), X is the predictor of interest (e.g., drug group in placebo vs. active agent), Z is a known covariate of interest (e.g., gender), and W is a variable collected as part of the study, but not considered in the analysis. Observed correlation between X and Y is defined as: ρXY = ρTU * ρX * ρY, where ρXY is the observed correlation between X and Y, ρTU is the correlation that would have been observed if X and Y had been measured with perfect reliability, and ρX and ρY are the square root of the reliabilities of X and Y, respectively.
Without loss of generality, we consider the bivariate case: the relationship between X and Y. Under classical test theory,22 the observed correlation between X and Y is defined as:
where ρXY is the observed correlation between X and Y, ρTU is the correlation that would have been observed if X and Y had been measured with perfect reliability, and ρX and ρY are the square root of the reliabilities of X and Y, respectively. The reliability of X and Y contain components of error not remediable by auditing, including measurement error, transcription errors from source to CRF, subject variability, rater variation, and pure error.
To assess the effect of the error rate remediable by audit (auditable error), we must examine the impact of auditable error on the reliability. The standard formula for assessing reliability is:
In the presence of an additional source of error (auditable error), the formula expands to
where σ2εA is the variance of the error due to auditable error. To calculate this quantity, we must know both the distribution of the error and the proportion of subjects with the error.
To demonstrate the effect of error on the analysis, we assume that systolic blood pressure is normally distributed with a mean of 130 mm Hg and a standard deviation of 15 mm Hg. To estimate the variance of auditing errors, we assume rates (probability of an error detectable by auditing) of 5/10,000 (0.05%), 10/10,000 (0.1%), 50/10,000 (0.5%), 100/10,000 (1.0%), and 500/10,000 (5%). We assume two distributions of errors: (1) uniform (0,999), assuming no range checks and (2) uniform (0,300), assuming a modest range check. Under these error assumptions, we show the reliabilities (Table 2).
Table 2.
Reliabilities for various distributions and proportions for analytical approach shown in Figure 7.
| Error/10,000 | Error Rate | No Range Check - Uniform (0,999) | Range Check - Uniform (0,300) | ||
|---|---|---|---|---|---|
|
| |||||
| Reliability | % Sample Increase | Reliability | % Sample Increase | ||
|
|
|||||
| 5 | 0.05% | 0.844 | 18% | 0.984 | 2% |
| 10 | 0.10% | 0.730 | 37% | 0.968 | 3% |
| 50 | 0.50% | 0.351 | 185% | 0.857 | 17% |
| 100 | 1.00% | 0.213 | 370% | 0.750 | 33% |
| 500 | 5.00% | 0.051 | 1848% | 0.375 | 167% |
Thus, the effect of auditing on errors depends both on their underlying distribution and their relative frequency. From the analytic solution for continuous data at modest but realistic error rates from 0–100 errors per 10,000 fields in the primary analysis variable, the sample size required to maintain the original power increases in linear fashion from 0%–33%.
From the reliability, we can then estimate the impact on the observed correlation:
Thus, the ratio of observed correlations in the presence of errors detectable by audit will vary between 8.86% and 94.6%, but always biased toward 0. The effect of audit-detectable errors in Z follows similarly.
If Z is thought to mediate relationship of interest (the effect of X on Y), the total effect, β, is β* in the presence of X in the model. It has been shown in several places that β= β* + α*γ.23 Thus, errors (unreliability) will impact both α and γ paths, biasing both paths (correlations) toward 0, and has the effect of positively biasing β*.
Two other types of errors are worth noting. First, errors in W will have no effect on the relationship of interest (effect of X on Y). Second, there may be errors in Y. Errors in Y will affect the relationship of X and Y by arguments similar to those above for X. Finally, the outcome, Y, is often computed from various audited sources, potentially leading to compounding of errors in variables.
The arguments above apply to the general linear model and are commonly discussed in the Classical Test Theory literature.22, 24–26 As might be expected, the impact of measurement error in nonlinear systems (e.g., logistic regression and Proportional Hazards models27) remains important and can lead to biased point estimates as well as confidence intervals,28 but is more complicated to model, and closed-form solutions do not exist.29 There has been intense work in this area for nearly 2 decades, and various solutions have been proposed, including use of latent variables,29,30 regression calibration methods,31 and probit models.32
Discussion
The range of error rates from 1997–2006 is consistent with results from the 2004 Society for Clinical Data Management (SCDM) survey showing that the most popular database acceptance criteria were 0.1% (34% of respondents) and 0.5% (27% of respondents).17 However, the same survey showed variation in methods used to calculate those error rates that would result in variances as great as a factor of seven. The trends observed with the DCRI method and GCDMP method are not always in the same direction, a variance driven by differences in data density on CRFs. For example, if a CRF has large numbers of variables that are completed only for a small subset of subjects, we would expect to see a larger difference between the two calculated error rates. This finding is important for organizations that outsource data management to multiple organizations and need to assure consistent data quality, or that compare error rates across different databases. The current version of the GCDMP recommends methods for managing cross-vendor variation in error rate calculation.
Although the purpose of this analysis was not to compare the “audit at lock” approach to the SPC approach, it is evident that since SPC was implemented, error rates have consistently declined, as has error rate variability. We also note that error rates trended upward over years using the “one audit at lock” approach. Potential confounding factors, however, including differences in data, auditors, work volume, data management staff, and training methods must be borne in mind when interpreting this observation.
The average tenure of data managers remained steady (5.6 years) during the period of our study, while our staff grew from eight data managers in 1997 to 45 in 2006, a degree of growth that might be expected to cause a decrease in data quality. The size of the auditing staff remained relatively constant, varying according to workload from 2–4 auditors, with a tenure similar to that of data managers. Since 1997, nine persons have worked in the quality control group. Also, over the period presented here, over 98% of the trials used the same data management system and processes.
SPC is proven to reduce variation and increase quality in a variety of processes18; we believe this to be the case with regard to data processing. By employing several small audits over the course of the study, SPC detects systematic errors early, allowing the data manager to take corrective action. In addition, early information on aspects of data handling processes that may be more prone to error is available, as are signals when greater than random variation has occurred. In fact, we see a similar trend when examining “one audit at lock” studies that also had interim audits. The second and subsequent audits in most cases had a lower error rate than the initial audit (a pattern also present in SPC audits). We attribute this to the identification and correction of systematic errors and processes, as well as staff receiving feedback. SPC audits, however, have the added advantage of earlier feedback and intervention, higher frequency of feedback, and facilitation of management oversight.
The overall database error rates presented here, taking both calculation methods into account, range from 0.025%–0.375%, or 2.5–37.5 errors per 10,000 fields, averaging 0.25% (25 errors per 10,000 fields). The critical variable error rates range from 0.06%–0.425%, or 6–42.5 errors per 10,000 fields, averaging 0.20% (20 errors per 10,000 fields).
We were initially concerned that the smaller sample size was sufficiently large to detect problems, especially in low-incidence fields (e.g., endpoints that occur only once per study subject, or only in a percentage of patients), and we feared that several audits might be required to detect problems, particularly systematic ones. We were, however, able to compare SPC audit results for several trials with results from a traditional full audit conducted by our internal Quality Assurance group, who conduct database audits on high-risk trials (Table 3). The error rates are comparable, indicating that the SPC approach is likely adequate, and that the combination of sample size and audit frequency is appropriate.
Table 3.
Comparison of SPC error rates vs. traditional audit error rates on trials audited independently by DCRI internal Quality Assurance group. Comparable error rates suggest that the SPC approach is likely adequate, as is the combination of sample size and audit frequency.
| SPC error rate (per 10,000 fields) | Fields audited | QA audit error rate (per 10,000 fields)* | Fields audited | |
|---|---|---|---|---|
| Study 1 | 2.5 | 4048 | 0 | ** |
| Study 2 | 12.2 | 93,677*** | 14.5 | 4398 |
| Study 3 | 46 | 2414 | 24.8 | 4475 |
values have been scaled by the response index for the corresponding CRF;error rates are therefore calculated using the same method.
QA did not count the number fields since they did not find any errors. They audited 4% of the patients in database at the time.
Sponsor requested a larger sample size for each SPC audit.
The difference in critical variable error rates and overall error rates raises an important question: Given limited resources, why collect and audit data that are not critical to the analysis? Additional data are often collected to mitigate risk in areas of scientific uncertainty. For example, if early-phase safety studies are still in progress, or if concerns regarding a similar compound emerge, a sponsor may collect additional safety data, full hematology and clinical chemistry panels, physical assessments, 12-lead ECGs, vital signs, and detailed concomitant medication information. Additional data needed for safety and efficacy endpoints are also collected to increase the scientific value of the research endeavor; for example, genetic, metabolomic, or proteomic substudies or other testing to provide information on the fundamental disease process, creating opportunities for secondary analyses and additional knowledge generation. Further, other data, including quality of life information and economic data are also collected to support marketing after approval. The issue of what constitutes `critical data' may therefore be highly dependent on the individual perspectives of researchers, both present and future, and could plausibly embrace all variables collected. Alternatively, in cases where a high percentage of the variables collected on the form are not used in an analysis, cleaning all data may not be cost effective.
Another reason for cleaning all data equally is described in an Institute of Medicine (IOM) Roundtable report: “…fear that any spurious data point during regulatory review will call into question the credibility of the entire dataset.”4 As the FDA makes electronic data widely available to reviewers with standards and tools to facilitate browsing and re-analysis, this fear may grow. Making research data publicly available means that unanticipated uses of such data are likely, which may create an impetus for cleaning all data equally. This could in turn cause resources to be divided among critical and non-critical data, decreasing emphasis on essential items. The overall cost of data collection and cleaning could also increase.
In 2005, Eisenstein and colleagues modeled clinical trial costs for two large cardiovascular trials.33 The model showed that data management and statistics activities represented 11%–14% of trial costs, while site management, monitoring, and site payments (also partially driven by number of CRF pages collected) represented 25%–30% of the cost. In their sensitivity analyses, the authors concluded that total costs could be reduced by 40% by reducing the number of CRF pages, and by simultaneously reducing monitoring visits and site-payment amounts corresponding to the decrease in data collected, while at the same time maintaining the numbers of patients and sites.
The findings of Eisenstein et al underline the key fact that the volume of data collected and cleaned profoundly impacts the costs of clinical trials. We do not argue for reflexively disregarding any data not deemed critical to the primary analysis of a study: there may be valid reasons for collecting and cleaning additional data. Instead, we present this discussion to elucidate the considerations that must inform cost-benefit decisions when designing clinical trials.
As the IOM report states, “There can be no `perfect' data set; instead, there may be a decreasing marginal benefit from pursuing such a goal.”4 A significant number of respondents in the 2004 SCDM survey, however, indicated that their acceptance criterion for critical variables was zero.17 The final comments in the IOM report state:
“A reasonable number of minor errors is acceptable, as long as the errors do not compromise the reliability of the overall data set or the inferences that are being drawn from the data about the safety and effectiveness of the product. Although an error rate of 1 in 1,000 is considered good, actual error rates are often much higher.”4
Errors rarely occur solely in primary analysis variables, as was assumed by our analytical approach, but there are nonetheless significant reasons to strive for lower error rates. Data discrepancies and outliers increase time needed to prepare the analysis. The effect of errors depends on the variables involved, or whether errors are located in major independent or dependent variables. In addition, the type of errors (e.g., transposition of digits in an insignificant digit versus transposition causing undetected outliers) and the type of analysis planned (and the robustness of the analysis to outliers and data errors) will further determine the effect of errors. Because errors impact variability, they can interact with the very nature of the statistical tests used to analyze the trial data.
Limitations
The data we present are taken from retrospective analysis of observational data and are not the product of a controlled experiment. Data are limited to audits performed at the DCRI in the course of clinical trial operations, and are subject to variations in process and trial design and specifications. The work processes, types of trials, and other methodology reported here may not be applicable to other organizations. In addition, the scope of database audits presented here is limited to CRF-to-database audits, and thus represents data processing error rates and do not provide a measure of the actual accuracy of the database, as CRF-to-database audits cannot account for errors that occur during measurement, initial recording, medical record abstraction, and transcription.
Conclusions
Although there is a general reluctance to engage in public discussion about audit results and methodology, our own experience suggests that such dialogue could provide immense benefit to the entire clinical research enterprise by optimizing data collection and cleaning, ultimately helping patients and furthering essential research. Our observational data suggest that ongoing independent assessment of data quality provides higher quality data, lower variation, better process control, and lower cost. In the larger context of industry practice, we believe that if error rates are to be used as a measure of data quality, consistent, industry-wide definitions and counting methods are needed.
Our results, which are consistent with those of others,34 also suggest that independent and routine data audits are effective in increasing data quality. In this context, we emphasize the importance of identifying, applying, and evaluating cost-effective methods for quantifying data quality. We also believe our experience demonstrates that even well-controlled process cannot be assumed to remain so, and may not even necessarily behave similarly under varying circumstances:
“Ironically, there is a major difference between a process that is presumed through inaction to be error-free and one that monitors mistakes. The so-called error-free process will often fail to note mistakes when they occur.”35
As methodology and technologies continue to change, quantifying and monitoring data quality will remain essential to the clinical research enterprise.
Glossary
- CDMS
Clinical data management system
- CRF
Case report form
- DCF
Data correction (or clarification) form
- DCRI
Duke Clinical Research Institute
- ECG
Electrocardiogram
- EDC
Electronic data capture
- FDA
U.S. Food and Drug Administration
- FTE
Full time equivalent
- GCDMP
Good Clinical Data Management Practices
- IOM
Institute of Medicine
- ISO
International Organization for Standardization
- SCDM
Society for Clinical Data Management
- SOP
Standard operating procedure(s)
- SPC
Statistical process control
References
- 1.Stellman SD. The case of the missing eights. An object lesson in data quality assurance. Am J Epidemiol. 1989;129:857–60. doi: 10.1093/oxfordjournals.aje.a115200. [DOI] [PubMed] [Google Scholar]
- 2.Knatterud GL. Methods of quality control and of continuous audit procedures for controlled clinical trials. Control Clin Trials. 1981;1:327–32. doi: 10.1016/0197-2456(81)90036-2. [DOI] [PubMed] [Google Scholar]
- 3.Knatterud GL, Rockhold FW, George SL, Barton FB, Davis CE, Fairweather WR, Honohan T, Mowery R, O'Neill R. Guidelines for quality assurance in multicenter trials: a position paper. Control Clin Trials. 1998;19:477–93. doi: 10.1016/s0197-2456(98)00033-6. [DOI] [PubMed] [Google Scholar]
- 4.Davis JR, Nolan VP, Woodcock J, Estabrook RW, editors. Workshop Report: Roundtable on research and development of drugs, biologics, and medical devices. Institute of Medicine. National Academy Press; Washington, D.C.: 1999. Assuring data quality in clinical trials for regulatory decision making. [PubMed] [Google Scholar]
- 5.Van der Putten E, Van der Velden JW, Siers A, Hamersma EA. A pilot study on the quality of data management in a cancer clinical trial. Control Clin Trials. 1987;8:96–100. doi: 10.1016/0197-2456(87)90034-1. [DOI] [PubMed] [Google Scholar]
- 6.Freeland B. Moving toward continuous quality improvement. J Intraven Nurs. 1992;15:278–82. [PubMed] [Google Scholar]
- 7.Christian MC, McCabe MS, Korn EL, Abrams JS, Kaplan RS, Friedman MA. The National Cancer Institute audit of the National Surgical Adjuvant Breast and Bowel Project Protocol B-06. N Engl J Med. 1995;333:1469–74. doi: 10.1056/NEJM199511303332206. [DOI] [PubMed] [Google Scholar]
- 8.Blumenstein BA. Verifying keyed medical research data. Stat Med. 1993;12:1535–42. doi: 10.1002/sim.4780121702. [DOI] [PubMed] [Google Scholar]
- 9.Neaton JD, Duchene AG, Svendsen KH, Wentworth D. An examination of the efficiency of some quality assurance methods commonly employed in clinical trials. Stat Med. 1990;9:115–23. doi: 10.1002/sim.4780090118. [DOI] [PubMed] [Google Scholar]
- 10.Day S, Fayers P, Harvey D. Double data entry: what value, what price? Control Clin Trials. 1998;19:15–24. doi: 10.1016/s0197-2456(97)00096-2. [DOI] [PubMed] [Google Scholar]
- 11.Bagniewska A, Black D, Molvig K, et al. Data quality in a distributed data processing system: The SHEP Pilot Study. Control Clin Trials. 1986;7:27–37. doi: 10.1016/0197-2456(86)90005-x. [DOI] [PubMed] [Google Scholar]
- 12.Helms RW. Data quality issues in electronic data capture. Drug Inf J. 2001;35:827–37. [Google Scholar]
- 13.Steward WP, Vantongelen K, Verweij J, Thomas D, Van Oosterom AT. Chemotherapy administration and data collection in an EORTC collaborative group-Can we trust the results? Eur J Cancer. 1993;29A:943–47. doi: 10.1016/s0959-8049(05)80199-6. [DOI] [PubMed] [Google Scholar]
- 14.Society for Clinical Data Management . Good Clinical Data Management Practices Document. version 4.0. [accessed on May 10, 2008]. Available at: www.scdm.org. [Google Scholar]
- 15.National Institutes of Health [accessed March 6, 2007];Final statement on sharing of research data. 2003 Feb 26; Available at: http://grants2.nih.gov/grants/guide/notice-files/NOT-OD-03-032.html.
- 16.Shamoo AE. Principles of research data audit. Gordon and Breach Science Publishers; New York: 1989. [Google Scholar]
- 17.Nahm M, Dziem G, Fendt K, Freeman L, Masi J, Ponce Z. Data quality survey. Society for Clinical Data Management. 2004;10(Summer):2. [Google Scholar]
- 18.Wheeler DJ. Short run SPC. SPC Press; Knoxville, TN: 1991. [Google Scholar]
- 19.Day S, Frayers P, Harvey D. Double data entry: What value, what price? Control Clin Trials. 1998;19:15–24. doi: 10.1016/s0197-2456(97)00096-2. [DOI] [PubMed] [Google Scholar]
- 20.McEntegart D, Jadhav S, Brown T, Channon E. Checks of case record forms versus the database for efficacy variables when validation programs exist. Drug Inform J. 1999;33:101–7. [Google Scholar]
- 21.Mullooly J. The effects of data entry error: An analysis of partial verification. Comp Biomed Res. 1990;23:259–67. doi: 10.1016/0010-4809(90)90020-d. [DOI] [PubMed] [Google Scholar]
- 22.Lord F, Novick M. Statistical theories of mental test scores. Addisons-Wesley; Reading, MA: 1968. [Google Scholar]
- 23.Baron RM, Kenny DA. The moderator-mediator variable distinction in social psychological research: Conceptual, strategic and statistical considerations. J Person Soc Psych. 1986;51:1173–82. doi: 10.1037//0022-3514.51.6.1173. [DOI] [PubMed] [Google Scholar]
- 24.Nunnally JC. Psychometric Theory. McGraw-Hill; NYC: 1978. [Google Scholar]
- 25.Crocker L, Algina J. Introduction to Classical and Modern Test Theory. Holt, Rinehart and Winston; New York: 1986. [Google Scholar]
- 26.Fuller WA. Measurement Error Models. Wiley; New York: 1987. [Google Scholar]
- 27.Hughes MD. Regression dilution in the proportional hazards model. Biometrics. 1983;49:1056–66. [PubMed] [Google Scholar]
- 28.Rosner B, Spiegelman D, Willet W. Correction of logistic regression relative riskestimates and confidence intervals for measurement error: the case of multiple covariates measured with error. Am J Epidemiol. 1990;132:734–45. doi: 10.1093/oxfordjournals.aje.a115715. [DOI] [PubMed] [Google Scholar]
- 29.Carrol RJ, Ruppert D, Sefanski LA, Crainiceanu C. Measurement error in non-linear models. 2nd ed. Chapman-Hall; New York: 2006. [Google Scholar]
- 30.Spiegelman D, Schneeweiss S, McDermott A. Measurement error correction for logistic regression models with an “alloyed gold standard”. Am J Epidemiol. 1997;145:184–96. doi: 10.1093/oxfordjournals.aje.a009089. [DOI] [PubMed] [Google Scholar]
- 31.Thoresen M, Laake P. A simulation study of measurement error correction methods in logistic regression. Biometrics. 2000;56:868–72. doi: 10.1111/j.0006-341x.2000.00868.x. [DOI] [PubMed] [Google Scholar]
- 32.Shafer DW. Likelihood analysis for probit regression with generalized linear models. Biometrika. 1993;80:889–904. [Google Scholar]
- 33.Eisenstein EL, Lemons PW, 2nd, Tardiff BE, Schulman KA, Jolly MK, Califf RM. Reducing the cost of phase III cardiovascular clinical trials. Am Heart J. 2005;149:482–88. doi: 10.1016/j.ahj.2004.04.049. [DOI] [PubMed] [Google Scholar]
- 34.Gassman JJ, Owen W, Kuntz T, Martin J. Data quality assurance: Selection of items for quality control, and monitoring and reporting results of quality control. Control Clin Trials. 1995;16:104–36. doi: 10.1016/0197-2456(94)00095-k. [DOI] [PubMed] [Google Scholar]
- 35.Arndt S, Tyrrell G, Woolson RF, Flaum M, Andreasen NC. Effects of errors in a multicenter medical study: preventing misinterpreted data. J Psychiatr Res. 1994;28:447–59. doi: 10.1016/0022-3956(94)90003-5. [DOI] [PubMed] [Google Scholar]