

Abstract
OBJECTIVE
While several studies have demonstrated a high prevalence of metabolically benign obesity, little is known about the incidence of cardiovascular disease (CVD) in this group.
RESEARCH DESIGN AND METHODS
Using pooled data from the Atherosclerosis Risk in Communities and Cardiovascular Health Studies, we assessed the association of metabolically benign obesity with incident CVD (coronary heart disease and stroke) using three existing definitions of metabolically benign obesity: (1) the ATP-III metabolic syndrome definition (≤2 of the ATP-III components, excluding waist), (2) the expanded ATP-III definition (≤1 of: the ATP-III components, HOMA-IR>75th percentile, systemic inflammation [WBC>75th percentile]), and (3) the insulin resistance (IR) based definition (sex-specific lowest quartile of the HOMA-IR distribution among non-diabetic obese).
RESULTS
The sample included 4,323 normal weight and 6,121 obese individuals. Among obese, 27.0%, 18.1%, and 20.4% were metabolically benign by the three definitions, respectively. CVD incidence among metabolically benign obese defined by the three definitions (mean follow-up 11.8 years) was 8.7%, 7.2%, and 10.3%, respectively, versus 7.9% in low-risk normal weight individuals. Multivariate-adjusted hazard ratios (95% CI) of incident CVD in metabolically benign obese compared to low-risk normal weight individuals were 1.24 (0.99-1.57), 1.16 (0.86-1.56), and 1.28 (1.01-1.62), respectively.
CONCLUSIONS
Regardless of the definition used, we observed a high prevalence of metabolically benign obesity. All three commonly used definitions were similar in terms of both classification and subsequent risk of CVD, with the expanded ATP-III criteria perhaps identifying the obese group at lowest risk of CVD.
Obesity is a strong risk factor for the development of cardiovascular disease (CVD) (1). However, a subset of obese individuals, termed metabolically benign obese, appear to have a lesser burden of adiposity-related cardiometabolic abnormalities despite excess weight (2-7). While metabolically benign obese individuals are hypothesized to be at lower risk of CVD, the limited data in this area have produced contradictory results (8-12).
One major challenge in evaluating CVD risk among metabolically benign obese individuals is the lack of a uniform definition. Several definitions have been utilized, some of which include metabolic syndrome components, while others only utilize levels of insulin resistance (IR). Despite the inconsistent definitions, previous studies demonstrate a high prevalence of metabolically benign obesity: 15-30% of obese depending on the definition used (4; 7).
Whether metabolically benign obese individuals are at increased risk for CVD events compared to healthy normal weight individuals remains uncertain. Also, data comparing the CVD risk information imparted by metabolically benign obesity, using different definitions, are limited. Our objective was to assess the association of metabolically benign obesity with incident CVD using the three most commonly utilized definitions, and compare the ability of these definitions to discriminate future CVD events in a pooled sample from the Atherosclerosis Risk in Communities and the Cardiovascular Heath Studies.
RESEARCH DESIGN AND METHODS
The current analyses pooled data from two large databases from the National Heart, Lung, and Blood Institute (NHLBI)-sponsored prospective CVD cohort studies: the Atherosclerosis Risk in Communities (ARIC) and Cardiovascular Health Studies (CHS). Informed consent and appropriate institutional review board approval was obtained by each center for both studies.
Recruitment and study procedures for each study are described elsewhere (13; 14). Exclusion criteria from the pooled dataset included history of CVD at baseline (n=3,084); BMI values in the underweight range (<18.5 kg/m2; n=144); reported fasting fewer than 8 hours (n=427); and missing data on any other covariates (n=381). After excluding overweight participants (BMI 25.0-29.9 kg/m2, n=7,140), 6,121 normal weight (BMI<25 kg/m2) and 4,323 obese individuals (BMI≥30 kg/m2) were available for the current analyses.
Assessment of anthropometric and lifestyle exposures
For both cohorts, baseline education (<high school, ≥high school) and smoking status (current, former, never) were obtained through interview. Diabetes was defined as a fasting serum or plasma glucose ≥7.0 mmol/L or self-reported anti-diabetic treatment. Blood pressure was measured in the seated position and averaged across two readings. BMI was calculated as the weight in kilograms divided by height in meters squared. Waist circumference was measured at the umbilicus.
Laboratory measurements
Blood samples were obtained after an 8 hour or longer fast. Glucose was measured in serum with a Kodak Ektachem E-700 among CHS participants; and by a hexokinase/glucose-6-phosphate dehydrogenase method among ARIC participants. Serum insulin was measured by radioimmunoassay. IR was estimated using homeostasis model assessment (HOMA-IR) (15). In both studies, triglycerides (TG) and HDL-C were measured enzymatically (HDL-C after dextran–magnesium precipitation of non-HDL lipoproteins). LDL-C was calculated using the Friedewald equation for individuals with TG≤4.51 mmol/L (16). White blood cell (WBC) count was obtained on automated instruments at local laboratories near each study center.
Follow-up and definition of end points
The current analyses are limited to probable and definite fatal and non-fatal coronary heart disease (CHD) and stroke as outcomes; CHD is defined as myocardial infarction (MI), silent MI, or CHD death, and stroke includes both hemorrhagic and ischemic subtypes. Event ascertainment has been previously reported for both studies (17; 18). Follow-up time was calculated as the time between the baseline visit and the first CHD or stroke event. For six participants who had both a stroke and a CHD event, only the first event was included in the analyses. These data were derived from limited public access datasets; at the time of these analyses, the maximum length of follow-up available to us was 15 years for ARIC and 14 years for CHS.
Metabolically benign obesity definitions
Obese participants were classified as either metabolically benign or at-risk obese based on three commonly utilized definitions: the Adult Treatment Panel-III (ATP-III) metabolic syndrome definition, the expanded ATP-III definition, and the IR-based definition. Obese individuals were considered metabolically benign by the ATP-III definition if ≤2 of the following four ATP-III components were present: elevated blood pressure (systolic/diastolic blood pressure ≥130/85 mmHg or antihypertensive treatment), elevated TG (≥150mg/dL), elevated glucose (≥100 mg/dL or anti-diabetic treatment), or low HDL-C (<40mg/dL for men or <50mg/dL for women or lipid-lowering treatment) (19). The expanded ATP-III definition is based on having ≤1 of the following six cardiometabolic abnormalities: any of the four ATP-III components described above, or insulin resistance (HOMA-IR>75th percentile among all participants; cutoff = 4.03), or systemic inflammation (WBC>75th percentile among all participants, cutoff = 7) (7). The IR-based definition is defined as the sex-specific lowest quartile of the HOMA-IR distribution among non-diabetic obese (11). Obese participants who did not meet the criteria for metabolically benign obesity by a given definition were classified as at-risk obese for analysis of that definition.
Additionally, normal weight individuals were categorized as low-risk by each of the three criteria – the ATP-III, the expanded ATP-III, and the IR-based criteria.
Statistical methods
Demographics, health history, and laboratory values were compared between metabolically benign and at-risk obese participants, as categorized by the three definitions, and also compared to normal weight individuals, using a two-sample t-test for continuous data (or non-parametric alternative if assumptions were not met) and the chi-square test for categorical data. The prevalence of metabolically benign obesity was compared between the three definitions, separately, using the chi-square test. CVD incidence rates among metabolically benign obese individuals were compared to the rates in at-risk obese and in low-risk normal weight individuals, using chi-square test. Hazard ratios (HR) and 95% confidence intervals (CI) of incident CVD events in metabolically benign obese compared to at-risk obese, to all normal weight, and to low-risk normal weight individuals were calculated using Cox proportional hazard regression, adjusted for age, gender, race, smoking, and alcohol consumption. The relative integrated discrimination improvement (RIDI) was calculated to estimate the net percentage discrimination of CVD events between the Cox models (20). Confidence intervals and tests were constructed from a 10,000 iteration bootstrap. Classification analyses were performed to estimate the percent of participants with CVD who were in the at-risk obesity group, and also the percent of participants without CVD in the metabolically benign obesity group, as defined by the three definitions. Finally, a Venn diagram was constructed to explore whether the three definitions identified the same subgroups of the obese population.
All statistical analyses (except bootstrap sample calculations, which were done using SAS version 9.2) were performed using STATA (version 10). Two-tailed values of P <0.05 were considered statistically significant.
RESULTS
Baseline
Baseline characteristics of study participants are presented in Table 1. Regardless of the definition, when compared to at-risk obese, metabolically benign obese individuals were younger, more educated, had lower mean BMI and waist circumference values, and were less likely to be smokers or have diabetes.
Table 1.
Characteristics of Study Participants by Obesity Phenotypes
| Normal Weight (n = 6,121) | ATP-III definition
|
ATP-III expanded definition
|
Insulin Resistance definition
|
||||
|---|---|---|---|---|---|---|---|
| Benign Obese (n = 1,167) | At-risk Obese (n = 3,156) | Benign Obese (n = 781) | At-risk Obese (n = 3,542) | Benign Obese (n = 882) | At-risk Obese (n = 3,441) | ||
| Age, yrs | 59.1 ± 10.3 | 55.5 ± 8.6 | 57.8 ± 8.8 | 55.4 ± 8.3 | 57.6 ± 8.9 | 55.3 ± 8.0 | 57.6 ± 9.0 |
| Gender, % male | 36.3 | 32.2 | 37.7 | 30.4 | 37.5 | 36.7 ‡* | 36.1 ‡ |
| Race-Ethnicity, % Caucasian | 85.5 | 59.9 | 66.8 | 59.8 | 66.0 | 67.6 ‡ | 64.2 ‡ |
| Smoking, % | |||||||
| Never Smokers | 42.0 | 53.4 | 48.0 | 55.1 | 48.2 | 51.3 | 49.0 |
| Former Smokers | 27.7 | 15.8 | 17.5 | 13.6 | 17.8 | 20.1 | 16.2 |
| Current Smokers | 30.4 | 30.8 | 34.5 | 31.2 | 34.0 | 28.6 | 34.8 |
| Education, % ≥ High School | 47.9 | 41.7 | 35.7 | 44.3* | 35.8 | 40.5 | 36.5 |
| Systolic Blood Pressure, mmHg | 121.0 ± 20.9 | 122.5 ± 18.2* | 131.5 ± 19.2 | 122.2 ± 18.1* | 130.6 ± 19.2 | 125.3 ± 19.5 | 130.1 ± 19.1 |
| Diastolic Blood Pressure, mmHg | 70.3 ± 10.9 | 74.4 ± 10.6 | 77.2 ± 11.0 | 74.6 ± 10.5 | 76.9 ± 11.1 | 75.3 ± 10.9 | 76.7 ± 11.0 |
| Elevated Blood Pressure, % | 41.1 | 35.2 | 79.4 | 34.7 | 74.7 | 52.4 | 71.4 |
| Total Cholesterol, mg/dL | 210.6 ± 39.3 | 211.3 ± 38.9 | 218.6 ± 43.0 | 212.7 ± 40.4* | 217.5 ± 42.4 | 215.0 ± 41.2 ‡ | 217.0 ± 42.3 ‡ |
| HDL Cholesterol, mg/dL | 59.0 ± 18.0 | 56.8 ± 13.5 | 44.8 ± 12.8 | 58.4 ± 13.9* | 45.7 ± 13.0 | 53.3 ± 15.5 | 46.7 ± 13.3 |
| LDL Cholesterol, mg/dL | 129.7 ± 37.4 | 134.7 ± 36.4 | 141.3 ± 38.8 | 135.1 ± 38.1 | 140.5 ± 38.3 | 139.1 ± 38.2 ‡ | 139.6 ± 38.3 ‡ |
| Low HDL Cholesterol, % | 24.9 | 13.0 | 64.6 | 10.0 | 59.6 | 33.4 | 55.1 |
| Triglycerides, mg/dL † | 95.5 (59) | 96 (44) | 151 (88) | 94 (44) | 141.5 (87) | 103 (59) | 137 (86) |
| Elevated Triglycerides, % | 17.3 | 3.8 | 50.7 | 3.2 | 45.7 | 19.4* | 42.8 |
| Glucose, mg/dL† | 96 (11.6) | 95.3 (8.4) | 108 (22.3) | 94.4 (8.2) | 107 (21) | 95.3 (10.6) | 107 (22.3) |
| Elevated Glucose, % | 34.8 | 22.3 | 80.6 | 14.7 | 75.9 | 30.5 | 73.6 |
| Insulin, uU/mL† | 7 (5) | 11 (8) | 18 (13) | 10 (6) | 18 (12) | 8 (3) | 18 (12) |
| HOMA-IR† | 1.8 (1.3) | 2.7 (2.0) | 5.0 (4.6) | 2.3 (1.4) | 4.9 (4.4) | 1.9 (0.7) | 5.0 (4.2) |
| Diabetes, % | 5.1 | 3.3 | 26.1 | 1.2 | 24.1 | 2.0 | 24.5 |
| BMI, kg/m2 | 22.7 ± 1.6 | 33.7 ± 3.9 | 34.1 ± 3.9 | 33.3 ± 3.5 | 34.2 ± 4.0 | 32.7 ± 2.8 | 34.3 ± 4.1 |
| Waist Circumference, cm | 84.6 ± 7.7 | 109.0 ± 10.6 | 111.7 ± 10.2 | 107.6 ± 10.2 | 111.8 ± 10.2 | 107.2 ± 8.9 | 112.0 ± 10.5 |
| WBC count | 6.0 ± 2.0 | 5.9 ± 1.7* | 6.4 ± 1.9 | 5.3 ± 1.2 | 6.5 ± 1.9 | 5.9 ± 1.8* | 6.4 ± 1.9 |
| Systemic Inflammation (WBC>75th percentile), % | 24.0 | 22.2* | 32.2 | 5.1 | 34.9 | 21.6* | 31.6 |
All comparisons between metabolically benign obese and normal weight individuals were significant, except for those indicated with *
† Values reported as median (IQR)
All comparisons between metabolically benign and at-risk obese groups were statistically significant, except for those indicated with ‡
Prevalence of metabolically benign obesity
Among obese participants, 1,167 (27.0%) were classified as metabolically benign by the ATP-III definition, 781 (18.1%) by the expanded ATP-III definition, and 882 (20.4%) by the IR definition. The prevalence of metabolically benign obesity, using the three definitions and stratified by race, gender, and age group, is presented in Figure 1. For the ATP-III and the expanded ATP-III criteria, the prevalence was significantly higher in women and in African-Americans, while for the IR definition, the prevalence was similar in men and women as well as in both ethnic groups. For all three definitions, the prevalence of this phenotype was lower with increasing age group.
Figure 1.
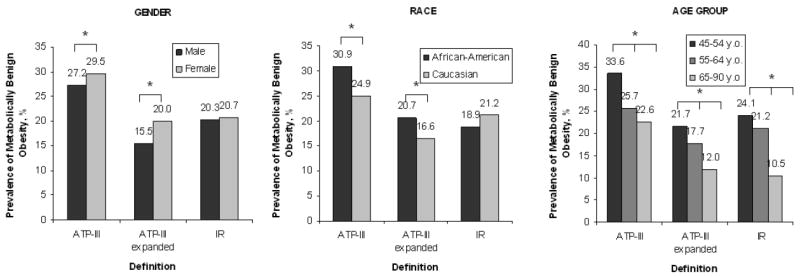
Prevalence of Metabolically Benign Obesity by Race, Gender, and Age Groups among Obese Individuals
* p<0.01.
Association of metabolically benign obesity with incident CVD
Over a mean of 11.8 ± 3.3 years of follow-up, 623 (14.4%) obese participants and 751 (12.3%) normal weight participants had incident CVD events (of those, 243 and 305 were strokes, respectively). Regardless of the definition, metabolically benign obese participants had a significantly lower incidence of CVD events compared to at-risk obese and to all normal-weight individuals (8.7%, 7.2%, and 10.3% CVD incidence in metabolically benign obese, versus 16.5%, 16.0%, and 15.5% in at-risk obese, as defined by the three definitions, respectively). Moreover, metabolically benign obesity defined by any of the three criteria was not associated with significantly increased incidence of CVD when compared to the corresponding low-risk normal weight groups (9.1%, 8.2%, and 9.9%, respectively; p>0.05 for all).
Comparison of metabolically benign obesity definitions
The multivariate-adjusted HRs suggest that risk of incident CVD in metabolically benign obese, regardless of the definition used, was significantly decreased in comparison to at-risk obese individuals, and not significantly increased in comparison to normal weight participants (Table 2). The HRs for incident CVD among metabolically benign obese compared to the corresponding low-risk normal weight groups were similar across all definitions. However, as with comparisons to at-risk obese, when compared to low-risk normal weight individuals, the metabolically benign obese seemed to be at lowest CVD risk when identified by the expanded ATP-III criteria (HR=1.16, 95%CI 0.86-1.56, Table 2). The RIDI for net differences in discrimination of CVD events among metabolically benign obese compared to low-risk normal weight individuals were small, ranging from 0.9% to 4.4% difference in discrimination. The 95% CIs suggested that these estimates were not statistically significant; therefore, there is no significant difference in discrimination of any one definition over another. Classification analyses among obese individuals suggested that the expanded ATP-III definition was the most conservative, with 91% of obese participants with CVD classified as at-risk obese (84% for ATP-III and 85% for IR definitions), and 20% of obese participants without CVD classified as metabolically benign obese (29% for ATP-III and 21% for IR definitions). Finally, the Venn diagram suggested that only 438 (28.7% of obese classified as metabolically benign by at least one definition) obese participants were classified as “metabolically benign” by all three definitions, while 361 (23.6%) obese participants were classified as metabolically benign exclusively by the IR definition, and 303 (19.8%) participants exclusively by the ATP-III definition (Figure 2).
Table 2.
Cox Proportional Hazards Regression Models
| MODEL 1 | MODEL 2 | |||||
|---|---|---|---|---|---|---|
|
| ||||||
| Metabolically Benign Obese compared to: | HR | 95% CI | p-value | HR | 95% CI | p-value |
| at-risk obese | ||||||
| ATP-III | 0.58 | 0.47 – 0.72 | <0.001 | 0.69 | 0.55 – 0.87 | < 0.01 |
| ATP-III expanded | 0.51 | 0.38 – 0.67 | <0.001 | 0.63 | 0.47 – 0.84 | < 0.01 |
| Insulin Resistance | 0.71 | 0.57 – 0.89 | < 0.01 | 0.87 | 0.68 – 1.10 | 0.24 |
| low-risk normal weight | ||||||
| ATP-III | 1.24 | 0.99 – 1.57 | 0.07 | 1.22 | 0.96 – 1.54 | 0.11 |
| ATP-III expanded | 1.16 | 0.86 – 1.56 | 0.34 | 1.17 | 0.87 – 1.58 | 0.30 |
| Insulin Resistance | 1.28 | 1.01 – 1.62 | 0.04 | 1.29 | 1.02 – 1.64 | 0.04 |
| all normal weight | ||||||
| ATP-III | 1.01 | 0.81 – 1.25 | 0.95 | 1.06 | 0.85 – 1.33 | 0.62 |
| ATP-III expanded | 0.87 | 0.66 – 1.16 | 0.35 | 0.96 | 0.72 – 1.27 | 0.76 |
| Insulin Resistance | 1.16 | 0.92 – 1.45 | 0.2 | 1.23 | 0.97 – 1.55 | 1.45 |
Model 1 = Adjusted for age, gender, race, smoking, and alcohol use
Model 2 = Model 1 excluding diabetics
Figure 2.
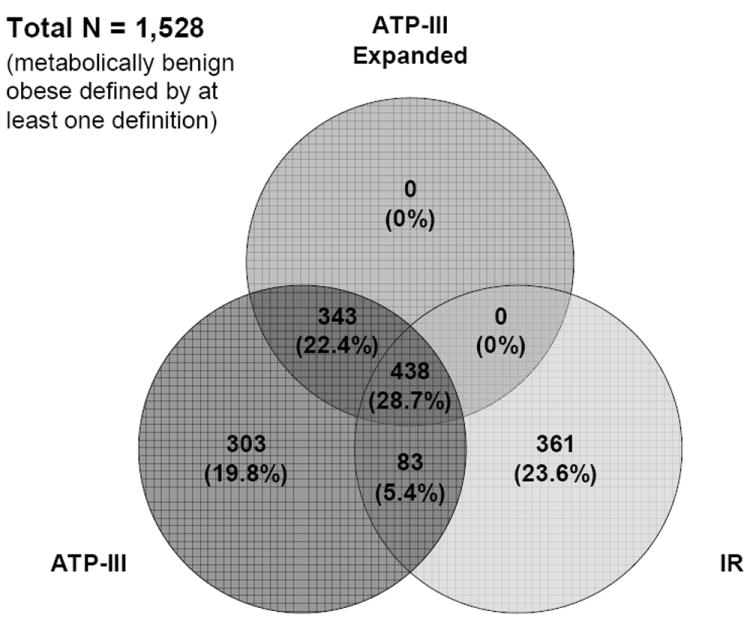
Venn Diagram among Obese Individuals
CONCLUSIONS
While many studies recognize the presence of the metabolically benign obesity phenotype, there is no consensus regarding the criteria to identify this subset of the obese population. To our knowledge, our study is the only published study to date comparing the ability of the three existing definitions of metabolically benign obesity to classify and predict future incident CVD events. We observed a high prevalence (18-27%) of metabolically benign obesity regardless of the definition used, among both Caucasian and African-American groups and both genders. Additionally, although prevalence of the metabolically benign obesity decreased with age, even among those 65-90 years old, 10.5% to 22.6% of obese individuals were classified as metabolically benign. Our analyses suggest that the three definitions are similar in terms of classification and subsequent risk prediction for incident CVD, with the expanded ATP-III criteria appeared to identify benign obese individuals at lowest CVD risk when compared to either the corresponding at-risk obese or low-risk normal weight groups.
Several prospective studies, including our own, suggest that metabolically benign obese individuals are not at increased incident CVD risk compared to normal weight individuals (9-12). In the Women’s Health and the Aerobics Center Longitudinal Studies, metabolically benign obese (free of hypertension, dyslipidemia, or diabetes) middle-aged women and men, respectively, were not at increased risk of incident CVD morbidity and mortality over 10-11 years of follow-up compared to normal weight individuals (9; 12). Similar findings were also reported by other groups among obese participants without the metabolic syndrome (10; 11). Finally, our pooled analysis of three large prospective studies suggest that abdominally obese individuals without metabolic syndrome or diabetes are not at increased risk of incident CHD or stroke over 9 years of follow-up (21). However, these results are in contrast with the data from several studies finding that body size (determined by BMI) was associated with incident CVD, even after adjustment for traditional metabolic factors (8; 22). Although these studies had significant follow-up time (often 20 years or more), they accounted for metabolic factors through multivariable modeling, and did not directly evaluate CVD risk in metabolically benign obese individuals. One recent long-term longitudinal study which evaluated CHD events directly in obese without co-morbidities (hypertension, hypercholesterolemia, or diabetes) found that these individuals were nevertheless twice as likely to experience CHD events over 16 years of follow-up compared to healthy normal weight individuals (HR 1.95, 95% CI 1.57-2.42 for men and 2.14, 1.83-2.50 for women) (8). Studies extending the current comparisons of metabolically benign obesity definitions to 15-20 years of follow-up are warranted.
Although the three definitions appear to be similar in terms of classification, and have similar incidence of cardiovascular events, the Venn diagram suggests that the different definitions identify different subgroups of the obese population. Hypertension has been found to be significantly more prevalent, and lipid abnormalities significantly less prevalent among African Americans as compared to whites (23). Therefore, the different subsets of individuals identified by the ATP-III vs. IR-based definitions may result from the greater likelihood that African Americans will meet the ATP-III criteria for metabolically benign obesity, and the lesser likelihood they will meet the IR-based criteria. Additionally, there are other potential mechanisms such as health behaviors, body composition, and metabolic activity of adipose tissue which may give rise to the constellation of components considered in the ATP-III vs. IR-based definition. Interestingly, there were no obese individuals identified as metabolically benign by the expanded ATP-III definition exclusively, suggesting that the addition of systemic inflammation component made the expanded ATP-III definition the most stringent. In summary, despite the considerate overlap between the three definitions, the etiology of the metabolically benign obesity is likely to be multifactorial, and each definition may be driven by different underlying mechanisms.
Several limitations should be considered. The ARIC database does not have measurements of C-reactive protein, one of the metabolic risk factors assessed in the original expanded ATP-III definition (7). Instead, we used WBC count as a marker of systemic inflammation, since it was measured in both cohorts and several studies show significant correlations between the two biomarkers (24). Overall, the differences between the two cohorts were minor and unlikely to dramatically bias the results. Additional sensitivity analyses stratified by each study did not reveal differences in the results (data not shown).
The strengths of our study include fairly generalizable findings, long length of follow-up, comprehensive surveillance for CVD events, inclusion of men and women, wide age range, and substantial statistical power due to large sample size. In addition, for the first time, we present both classification and risk prediction performance within the same sample.
In summary, in these middle-aged and older adults, there is a high prevalence of metabolically benign obesity regardless of the definition used. Our analyses suggest that although the three definitions are similar in terms of classification and subsequent CVD risk prediction, the different definitions identify different subgroups of the obese population, perhaps suggesting distinct etiologies of this phenotype. Given the high prevalence of metabolically benign obesity and recent evidence suggesting adverse effects of weight loss on CVD risk in this group, (25) the correct identification and classification of metabolically benign obese individuals is critical to investigations of appropriate treatment paradigms in this group. Additionally, clearer specification of the metabolically benign obese phenotype will allow its exploitation for identification of novel interventional targets among at-risk obese individuals who have extensive cardiometabolic complications and are, therefore, at high risk for CVD. Future studies are needed to explore the mechanisms underlying metabolically benign obesity, and their impact on health.
Acknowledgments
The Cardiovascular Health Study (CHS) and Atherosclerosis Risk in Communities Study (ARIC) are conducted and supported by the NHLBI in collaboration with the CHS and ARIC study investigators, respectively. This manuscript was prepared using a limited access dataset obtained from the NHLBI and does not necessarily reflect the opinions or views of the CHS or ARIC studies, or the NHLBI.
A.D.O. developed study concept and design, performed statistical analyses, wrote the manuscript, obtained funding. M.K., A.M., P.M., and U. K. contributed to discussion, reviewed/edited manuscript. R.P.W. developed study concept and design, reviewed/edited manuscript, obtained funding.
SOURCES OF FUNDING
This study was supported by the following grant from the R21-HL089625 (Dr. Wildman) from the National Heart, Lung, and Blood Institute of the NIH; and by 10PRE3410007 grant (Ogorodnikova) from the American Heart Association. The sponsor had no role in the design, conduct or reporting of the study.
Footnotes
Disclosures
None
References
- 1.Visscher TL, Seidell JC. The public health impact of obesity. Annu Rev Public Health. 2001;22:355–375. doi: 10.1146/annurev.publhealth.22.1.355. [DOI] [PubMed] [Google Scholar]
- 2.Bluher M. The distinction of metabolically ‘healthy’ from ‘unhealthy’ obese individuals. Curr Opin Lipidol. 2010;21:38–43. doi: 10.1097/MOL.0b013e3283346ccc. [DOI] [PubMed] [Google Scholar]
- 3.Iacobellis G, Ribaudo MC, Zappaterreno A, Iannucci CV, Leonetti F. Prevalence of uncomplicated obesity in an Italian obese population. Obes Res. 2005;13:1116–1122. doi: 10.1038/oby.2005.130. [DOI] [PubMed] [Google Scholar]
- 4.Karelis AD, Brochu M, Rabasa-Lhoret R. Can we identify metabolically healthy but obese individuals (MHO)? Diabetes Metab. 2004;30:569–572. doi: 10.1016/s1262-3636(07)70156-8. [DOI] [PubMed] [Google Scholar]
- 5.Stefan N, Kantartzis K, Machann J, Schick F, Thamer C, Rittig K, Balletshofer B, Machicao F, Fritsche A, Haring HU. Identification and characterization of metabolically benign obesity in humans. Arch Intern Med. 2008;168:1609–1616. doi: 10.1001/archinte.168.15.1609. [DOI] [PubMed] [Google Scholar]
- 6.Wildman RP. Healthy obesity. Curr Opin Clin Nutr Metab Care. 2009;12:438–443. doi: 10.1097/MCO.0b013e32832c6db7. [DOI] [PubMed] [Google Scholar]
- 7.Wildman RP, Muntner P, Reynolds K, McGinn AP, Rajpathak S, Wylie-Rosett J, Sowers MR. The obese without cardiometabolic risk factor clustering and the normal weight with cardiometabolic risk factor clustering: prevalence and correlates of 2 phenotypes among the US population (NHANES 1999-2004) Arch Intern Med. 2008;168:1617–1624. doi: 10.1001/archinte.168.15.1617. [DOI] [PubMed] [Google Scholar]
- 8.Flint AJ, Hu FB, Glynn RJ, Caspard H, Manson JE, Willett WC, Rimm EB. Excess weight and the risk of incident coronary heart disease among men and women. Obesity (Silver Spring) 2009;18:377–383. doi: 10.1038/oby.2009.223. [DOI] [PMC free article] [PubMed] [Google Scholar]
- 9.Katzmarzyk PT, Janssen I, Ross R, Church TS, Blair SN. The importance of waist circumference in the definition of metabolic syndrome: prospective analyses of mortality in men. Diabetes Care. 2006;29:404–409. doi: 10.2337/diacare.29.02.06.dc05-1636. [DOI] [PubMed] [Google Scholar]
- 10.Kip KE, Marroquin OC, Kelley DE, Johnson BD, Kelsey SF, Shaw LJ, Rogers WJ, Reis SE. Clinical importance of obesity versus the metabolic syndrome in cardiovascular risk in women: a report from the Women’s Ischemia Syndrome Evaluation (WISE) study. Circulation. 2004;109:706–713. doi: 10.1161/01.CIR.0000115514.44135.A8. [DOI] [PubMed] [Google Scholar]
- 11.Meigs JB, Wilson PW, Fox CS, Vasan RS, Nathan DM, Sullivan LM, D’Agostino RB. Body mass index, metabolic syndrome, and risk of type 2 diabetes or cardiovascular disease. J Clin Endocrinol Metab. 2006;91:2906–2912. doi: 10.1210/jc.2006-0594. [DOI] [PubMed] [Google Scholar]
- 12.Song Y, Manson JE, Meigs JB, Ridker PM, Buring JE, Liu S. Comparison of usefulness of body mass index versus metabolic risk factors in predicting 10-year risk of cardiovascular events in women. Am J Cardiol. 2007;100:1654–1658. doi: 10.1016/j.amjcard.2007.06.073. [DOI] [PMC free article] [PubMed] [Google Scholar]
- 13.The Atherosclerosis Risk in Communities (ARIC) Study: design and objectives. The ARIC investigators. Am J Epidemiol. 1989;129:687–702. [PubMed] [Google Scholar]
- 14.Fried LP, Borhani NO, Enright P, Furberg CD, Gardin JM, Kronmal RA, Kuller LH, Manolio TA, Mittelmark MB, Newman A, et al. The Cardiovascular Health Study: design and rationale. Ann Epidemiol. 1991;1:263–276. doi: 10.1016/1047-2797(91)90005-w. [DOI] [PubMed] [Google Scholar]
- 15.Matthews DR, Hosker JP, Rudenski AS, Naylor BA, Treacher DF, Turner RC. Homeostasis model assessment: insulin resistance and beta-cell function from fasting plasma glucose and insulin concentrations in man. Diabetologia. 1985;28:412–419. doi: 10.1007/BF00280883. [DOI] [PubMed] [Google Scholar]
- 16.Friedewald WT, Levy RI, Fredrickson DS. Estimation of the concentration of low-density lipoprotein cholesterol in plasma, without use of the preparative ultracentrifuge. Clin Chem. 1972;18:499–502. [PubMed] [Google Scholar]
- 17.Ives DG, Fitzpatrick AL, Bild DE, Psaty BM, Kuller LH, Crowley PM, Cruise RG, Theroux S. Surveillance and ascertainment of cardiovascular events. The Cardiovascular Health Study Ann Epidemiol. 1995;5:278–285. doi: 10.1016/1047-2797(94)00093-9. [DOI] [PubMed] [Google Scholar]
- 18.White AD, Folsom AR, Chambless LE, Sharret AR, Yang K, Conwill D, Higgins M, Williams OD, Tyroler HA. Community surveillance of coronary heart disease in the Atherosclerosis Risk in Communities (ARIC) Study: methods and initial two years’ experience. J Clin Epidemiol. 1996;49:223–233. doi: 10.1016/0895-4356(95)00041-0. [DOI] [PubMed] [Google Scholar]
- 19.Third Report of the National Cholesterol Education Program (NCEP) Expert Panel on Detection, Evaluation, and Treatment of High Blood Cholesterol in Adults (Adult Treatment Panel III) final report. Circulation. 2002;106:3143–3421. [PubMed] [Google Scholar]
- 20.Pencina MJ, D’Agostino RB, Sr, D’Agostino RB, Jr, Vasan RS. Evaluating the added predictive ability of a new marker: from area under the ROC curve to reclassification and beyond. Stat Med. 2008;27:157–172. doi: 10.1002/sim.2929. discussion 207-112. [DOI] [PubMed] [Google Scholar]
- 21.Wildman RP, McGinn AP, Lin J, Wang D, Muntner P, Cohen HW, Reynolds K, Fonseca V, Sowers MR. Cardiovascular disease risk of abdominal obesity versus metabolic abnormalities. Obesity. 2010 doi: 10.1038/oby.2010.168. in press. [DOI] [PMC free article] [PubMed] [Google Scholar]
- 22.Hubert HB, Feinleib M, McNamara PM, Castelli WP. Obesity as an independent risk factor for cardiovascular disease: a 26-year follow-up of participants in the Framingham Heart Study. Circulation. 1983;67:968–977. doi: 10.1161/01.cir.67.5.968. [DOI] [PubMed] [Google Scholar]
- 23.Lin SX, Pi-Sunyer EX. Prevalence of the metabolic syndrome among US middle-aged and older adults with and without diabetes--a preliminary analysis of the NHANES 1999-2002 data. Ethn Dis. 2007;17:35–39. [PubMed] [Google Scholar]
- 24.Wildman RP, Muntner P, Chen J, Sutton-Tyrrell K, He J. Relation of inflammation to peripheral arterial disease in the national health and nutrition examination survey, 1999-2002. Am J Cardiol. 2005;96:1579–1583. doi: 10.1016/j.amjcard.2005.07.067. [DOI] [PubMed] [Google Scholar]
- 25.Karelis AD, Messier V, Brochu M, Rabasa-Lhoret R. Metabolically healthy but obese women: effect of an energy-restricted diet. Diabetologia. 2008;51:1752–1754. doi: 10.1007/s00125-008-1038-4. [DOI] [PubMed] [Google Scholar]