

Abstract
Objective
To investigate possible age-related changes in associations between polymorphisms in the fat mass and obesity-associated (FTO) gene and higher body mass index (BMI).
Design and Subjects
Multilevel mixed regression models were used to examine associations between four FTO variants and longitudinal BMI profiles in non-Hispanic white and African American children and adolescents 8 - 17 years of age from two different longitudinal cohort studies, the Bogalusa Heart Study (BHS) and Project HeartBeat! (PHB). In the BHS, there were 1551 examinations of 478 African Americans and 3210 examinations of 1081 non-Hispanic whites; in PHB, there were 971 examinations of 131 African Americans and 4458 examinations of 505 non-Hispanic whites.
Results
In African Americans, no significant FTO associations with BMI were found. In non-Hispanic whites, linkage disequilibrium among all four variants made haplotype analysis superfluous, so we focused on the single-nucleotide polymorphism (SNP), rs9939609. In longitudinal multilevel models, the A/A genotype of rs9939609 was associated with higher BMI in non-Hispanic whites in both cohorts at all ages. A significant age-by-genotype interaction found only in the BHS cohort predicted that in those with the A/A genotype, BMI would be approximately 0.7 kg/m2 higher at age 8, and approximately 1.6 kg/m2 higher at age 17 than in those with A/T or T/T genotypes. The design of Project HeartBeat! limited follow-up of any single individual to four years, and may have reduced the ability to detect any age-by-genotype interaction in this cohort.
Conclusions
The A/A genotype of rs9939609 in the FTO gene is associated with higher longitudinal BMI profiles in non-Hispanic whites from two different cohorts. The association may change with age, with the A/A genotype being associated with a larger BMI difference in late adolescence than in childhood, though this was observed only in the Bogalusa Heart Study cohort and requires verification.
Keywords: FTO, body mass index, children, adolescents, longitudinal study
Introduction
Studies in many populations, especially those of European descent, have associated sequence variants in the FTO gene on chromosome 16 with either obesity or body mass index (BMI).1-5 Several studies have reported similar associations in Asian populations6-11, though there have been a few negative reports.12-14 The evidence for an association between FTO variants and BMI or obesity in populations of African descent has also been mixed, with both positive and negative findings.15-18
In addition, evidence from several studies suggests that associations between FTO variants and obesity-related traits may be age-dependent and may differ between males and females. A study in Finnish children found that an association between a single-nucleotide polymorphism (SNP) in intron 1, rs9939609, and BMI did not appear until children reached 7 years of age19, though the same polymorphism has been associated with variation in fat mass in Spanish children at 2 weeks of age20, and with variation in food intake in children 4-5 years of age in a British population.21 In a twin study, no significant association between rs9939609 and BMI was found at at age 4, but significant associations were found at ages 7, 10, and 11, with the effect size increasing between age 7 and age 10.22 In a study of Swedish children and adolescents, rs9939609 was associated with BMI and obesity only in females.23
To further investigate age-, sex-, and population-specific associations between FTO variation and BMI, we studied associations between four FTO variants and longitudinal BMI profiles in African American and non-Hispanic white children and adolescents measured multiple times between 8 and 18 years of age in two studies of cardiovascular disease risk factors in schoolchildren, Project HeartBeat! and the Bogalusa Heart Study.
Methods
Subjects and examinations
Subjects from the Bogalusa Heart Study were examined between 1973 and 1996, when schoolchildren in Bogalusa, LA, and older subjects previously examined as schoolchildren were screened for cardiovascular disease risk factors approximately every 3 years. Participants in the present study had been examined at least 3 times between 1973 and 1996, and at least once between 1991 and 1996, when blood was collected for DNA extraction. Only data from Bogalusa Heart Study subjects between 8 and 18 years of age were included in the analyses described here, to facilitate comparison with the Project HeartBeat! cohort described below. Participants in this age range gave informed assent at each examination, and informed consent of a parent was also obtained. Examinations were conducted by trained examiners following protocols published previously.24 The averages of two measurements of height (to within 0.1 cm) and weight (to within 0.1 kg) were used to calculate BMI. Study protocols were approved by Institutional Review Boards at the Louisiana State University Medical School and Tulane University.
Subjects from Project HeartBeat! were examined from 1991 to 1995, when 678 children were enrolled in a study of the development of cardiovascular disease risk factors in schoolchildren between 8 and 18 years of age from two communities, The Woodlands and Conroe, located just north of Houston, Texas. Three age cohorts were enrolled, with subjects being either 8, 11, or 14 years of age at the first examination. Subjects were then examined at four-month intervals for four years, producing a combined “synthetic cohort” spanning ages between 8 and 18 years, even though no individual was followed for more than 4 years. Complete details of the study design and methods have been published elsewhere.25 For BMI, height was measured to the nearest 0.1 cm with a wall-mounted stadiometer, and weight was measured to the nearest 0.1 kg on a balanced-beam scale, with BMI calculated as kg/m2. The study protocol was approved by Institutional Review Boards at the University of Texas Health Science Center at Houston and at Baylor College of Medicine.
Genotyping
Genotyping employed the TaqMan allele-discrimination assay, using the ABI 7900HT and Sequence Detection System software (Applied Biosystems, Carlsbad, CA, USA). Details on reaction protocols and all primer and probe sequences used are available from the corresponding author by request.
Statistical analyses
Chi-square tests were used to compare genotype frequencies in African Americans and whites between cohorts; the Cochran-Armitage trend test was used to compare allele frequencies. The HelixTree® program (Golden Helix Inc., Bozeman, MT, USA), was used to estimate linkage disequilibrium. Separate multilevel mixed models for each race-by-study group were used to analyze genotype effects while accounting for correlations among siblings and among multiple observations within individuals. We have previously described the use of such models to analyze genotype effects on longitudinal lipid profiles.26, 27 The multilevel models included sex and genotype, plus age, age squared, and age cubed; the higher-order age terms accommodated the sigmoidal shape of longitudinal BMI growth curves. Sigmoidal BMI growth curves have been reported in other longitudinal studies of growth in childhood and adolescence, with BMI rising more rapidly during adolescence than either before or after.28, 29 Within each race-by-study group, all two-way interactions involving the sex, genotype, and age terms appearing as main effects were included in a full model and then tested individually by a process of backward elimination using likelihood ratio tests, to find the best-fitting model; -2 times the difference in model log likelihoods before and after removal of a term asymptotically follows a Π2 distribution with 1 df. All multilevel analyses were conducted using SAS, Version 9 (SAS Institute, Cary, NC, USA).
Results
In Project HeartBeat!, the proportions of males and females were nearly identical (50.2% and 49.8%, respectively), while in the Bogalusa cohort, there were proportionally fewer males than females (42.4% and 57.6%, respectively); the difference between cohorts was significant (p = 0.0009). The proportion of African Americans was higher in the Bogalusa cohort (30.7%) than in the Project HeartBeat! cohort (20.6%; p < 0.0001), but these proportions reflected those in the respective communities from which the cohorts were drawn. Distributions of subjects by cohort and race/sex group are shown in Table 1. Due to differences in the study designs, subjects from Project HeartBeat! were examined more frequently than those from Bogalusa; the mean ∀ SD number of examinations per subject was 8.28 ∀ 2.86 in Project HeartBeat! (ranging from 1 - 12 examinations) and 2.58 ∀ 0.88 in the Bogalusa Heart Study (ranging from 1 - 5). The mean age at the time of examination was slightly higher in the Bogalusa cohort (12.9 ∀ 2.7 vs. 12.1 ∀ 2.6 years; p < 0.0001). Numbers of examinations in each cohort and age group are shown in Table 2.
Table 1.
Numbers of subjects in each cohort, by race/sex group.
| African Americans | Non-Hispanic Whites | ||||
|---|---|---|---|---|---|
| Cohort | Females | Males | Females | Males | Total |
| Bogalusa | 283 (18.2%) | 195 (12.5%) | 615 (39.4%) | 466 (29.9%) | 1559 (100%) |
| HeartBeat | 67 (10.5%) | 64 (10.1%) | 250 (39.3%) | 255 (40.1%) | 636 (100%) |
For test of difference in race/sex distribution between cohorts: Π2=33.05, 3 df; p < 0.0001.
Table 2.
Distribution of observations within two-year age groups, by cohort.
| Age Group | ||||||
|---|---|---|---|---|---|---|
| Cohort | 8 - 9 | 10 - 11 | 12 - 13 | 14 - 15 | 16 - 17 | Total |
| Bogalusa | 642 | 777 | 968 | 856 | 784 | 4027 |
| HeartBeat | 1371 | 1524 | 922 | 957 | 491 | 5265 |
SNP genotype frequencies in each race/cohort group met Hardy-Weinberg expectations (data not shown). Genotype counts and minor allele frequencies for the four FTO intron 1 polymorphisms typed are shown in Table 3 by cohort and race group. Within race/ethnic groups, there were no statistically significant differences between the Bogalusa and Project HeartBeat! cohorts in genotype or allele frequencies for any of the polymorphisms, even though minor allele frequencies appeared slightly higher for three SNPs (rs17817449, rs8050136, and rs9939609) in African Americans from Bogalusa, and slightly lower for all four SNPs in non-Hispanic whites from Bogalusa. In the Bogalusa cohort, genotype frequencies differed significantly between African Americans and non-Hispanic whites for all SNPs except rs17817449; in the smaller Project HeartBeat! cohort, genotype frequencies differed significantly between African Americans and non-Hispanic whites only for rs1421085.
Table 3.
FTO genotypes and minor allele frequencies by race group and cohort.
| African American | Non-Hispanic White | ||||
|---|---|---|---|---|---|
| SNP | Genotype | Bogalusa | HeartBeat | Bogalusa | HeartBeat |
| C/C | 3 | 2 | 158 | 77 | |
| rs1421085 | C/T | 99 | 23 | 510 | 238 |
| T/T | 366 | 100 | 390 | 156 | |
| f(C) | 0.11 | 0.11 | 0.39 | 0.42 | |
| G/G | 81 | 16 | 155 | 72 | |
| rs17817449 | G/T | 235 | 56 | 509 | 237 |
| T/T | 152 | 52 | 399 | 154 | |
| f(G) | 0.42 | 0.35 | 0.39 | 0.41 | |
| A/A | 89 | 21 | 149 | 73 | |
| rs8050136 | A/C | 237 | 57 | 511 | 237 |
| C/C | 138 | 46 | 399 | 158 | |
| f(A) | 0.45 | 0.40 | 0.38 | 0.41 | |
| A/A | 108 | 26 | 151 | 72 | |
| rs9939609 | A/T | 239 | 57 | 512 | 228 |
| T/T | 120 | 40 | 391 | 159 | |
| f(A) | 0.49 | 0.44 | 0.39 | 0.41 | |
There was strong pairwise linkage disequilibrium among all markers in both African Americans and non-Hispanic whites in both cohorts. R2 values exceeded 0.9 for each SNP pair in non-Hispanic whites, and while the R2 values in African Americans ranged only from 0.114 to 0.858 (Supplementary Table 1), D’ values, which are normalized for allele frequencies, exceeded 0.9 for every marker pair in both groups (data not shown). We analyzed associations between BMI and both the individual FTO polymorphisms and four-locus FTO haplotypes, but with the strong linkage disequilibrium among all four polymorphisms, analyzing haplotypes provided no additional information (data not shown). To facilitate comparisons with other studies, we here report results for rs9939609; results for the other three SNPs were essentially identical.
In longitudinal mixed models that included all three genotypes, rs9939609 was associated with variation in BMI profiles in non-Hispanic whites in both cohorts, but there was no evidence of an association in African Americans in either cohort (data not shown). In non-Hispanic whites in both cohorts, the model coefficients for the A/T genotype were non-significant and closer to zero (the coefficient for the reference genotype, T/T) than they were to the coefficients for the A/A genotype, while the A/A genotype was significantly associated with an increase in BMI of approximately one kg/m2. Thus, we combined the T/T and A/T genotypes for the analyses reported here. (Supplementary Figure 1 shows the results of models in each cohort with all three genotypes included.)
When the Bogalusa and Project HeartBeat! cohorts were analyzed separately, the A/A genotype was significantly associated with higher BMI in both cohorts, but an age-by-FTO group interaction was statistically significant only in the Bogalusa cohort (Table 4). The significant age-by-FTO group interaction in the Bogalusa cohort indicates that the difference in BMI between those with the A/A genotype and those with either T/T or A/T genotypes increases with age, with the A/A genotype being associated with a mean BMI approximately 0.7 kg/m2 higher at age 8, and 1.6 kg/m2 higher at age 17. The BMI profiles by genotype group predicted by the models shown in Table 4 for males and females in both cohorts are shown in Figure 1.
Table 4.
Coefficients, standard errors, and p-values from the best models in each cohort for FTO rs9939609 predicting BMI profiles in non-Hispanic whites. There were no statistically significant interaction terms in the best model for the Project HeartBeat! cohort.
| Bogalusa Heart Study | Project HeartBeat! | |||||
|---|---|---|---|---|---|---|
| Effect | Coefficient | S.E. | p-value | Coefficient | S.E. | p-value |
| Intercept | 16.297 | 0.189 | <0.001 | 16.378 | 0.254 | <0.001 |
| Sex (0=F; 1=M) | -0.051 | 0.282 | 0.857 | 0.275 | 0.312 | 0.378 |
| Age (years)1 | 0.349 | 0.117 | 0.003 | 0.449 | 0.076 | <0.001 |
| Age squared | 0.101 | 0.027 | <0.001 | 0.111 | 0.018 | <0.001 |
| Age cubed | -0.008 | 0.002 | <0.001 | -0.010 | 0.001 | <0.001 |
| FTO (0=T/?; 1=A/A) | 0.668 | 0.289 | 0.021 | 1.155 | 0.431 | 0.008 |
| Age × FTO | 0.102 | 0.040 | 0.010 | – – – | – – – | – – – |
| Sex × Age | 0.353 | 0.178 | 0.048 | – – – | – – – | – – – |
| Sex × Age squared | -0.090 | 0.041 | 0.029 | – – – | – – – | – – – |
| Sex × Age cubed | 0.007 | 0.003 | 0.009 | – – – | – – – | – – – |
Age in each cohort was centered by subtracting the youngest age value from the Project HeartBeat! cohort (8.104 years) from each age value prior to squaring or cubing it.
Figure 1.
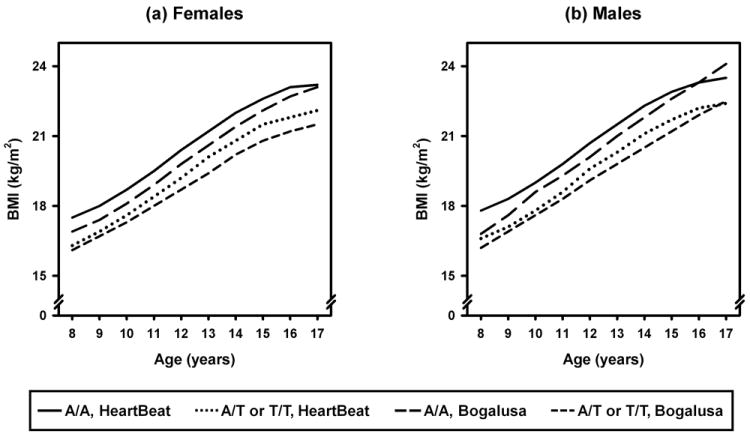
Predicted longitudinal BMI profiles by FTO rs9939609 genotype in non-Hispanic whites in the Bogalusa Heart Study and Project HeartBeat! cohorts. Mean (∀ one SE) profiles are for males and females combined, to smooth out fluctuations in age-, sex-, and genotype-specific mean profiles; predicted profiles from longitudinal modeling are sex-specific.
It is possible that the age-by-genotype interaction observed in the Bogalusa cohort, with the A/A genotype having a greater effect on BMI in late adolescence, might be due to a propensity of those with higher BMI associated with the A/A genotype to gain even more weight over time. If higher BMI fosters subsequent weight gain, however, then higher BMI in early adolescence should be associated with greater BMI increases in late adolescence, regardless of FTO genotype. In Bogalusa Heart Study subjects measured at 12, 13, or 14 years of age, the mean increase in BMI after three years (the most frequent interval between examinations in the Bogalusa cohort) was actually smaller in those from the highest BMI z-score tertile at the earlier measurement (1.5 ∀ 2.6 kg/m2) than in those from the lowest tertile (1.9 ∀ 1.2 kg/m2), though the difference among z-score tertiles was not statistically significant (p = 0.09). In multiple regression models, however, the effect on subsequent BMI increases of having higher BMI when younger differed by FTO genotype. Among groups defined by FTO genotype and BMI z-score tertile at 12 – 14 years of age, the largest mean increase in BMI after three years (3.3 ∀ 2.9 kg/m2) occurred in those from the highest BMI z-score tertile who had the A/A genotype, while the smallest mean increase (1.3 ∀ 2.5 kg/m2) occurred in those from the highest BMI z-score tertile who had T/T or T/A genotypes; the interaction between BMI z-score tertile and FTO genotype was statistically significant (p = 0.01). Comparable results were found when BMI z-score at 12 – 14 years of age was included in models as a continuous variable. By itself, FTO genotype, but not earlier BMI z-score, significantly predicted change in BMI three years later; with both factors in the model, FTO genotype modified the effect of earlier BMI z-score on subsequent change in BMI (data not shown). These findings suggest that the greater effect of the A/A genotype on BMI in older adolescents from the Bogalusa cohort is not due to a tendency for higher BMI at earlier ages to accelerate subsequent weight gain.
These findings could not be replicated in the Project HeartBeat! cohort, in which no associations between BMI z-scores at 12 – 14 years of age or FTO genotype and change in BMI at 15 – 17 years of age were significant (data not shown). Because subjects in Project HeartBeat! were enrolled at 8, 11, or 14 years of age, those examined both in late adolescence and three years earlier were all from the oldest cohort, and only seven pairs of observations three years apart were available for the A/A genotype in this group. This may help account for the failure to find an age-by-FTO interaction in the Project HeartBeat! cohort comparable to that observed in the Bogalusa cohort, in which the interaction only became apparent in late adolescence.
Figure 2 superimposes mean BMI profiles by cohort, sex, and genotype on BMI growth curves predicted by the models in Table 4. The smaller numbers of individuals and observations with the A/A genotype produce greater variability in the mean profiles for that group, as expected, though the overall tendency for higher BMI with this genotype is apparent. The convergence or even crossover of the mean profiles by genotype around 12 - 13 years of age, which is particularly noticeable in males, may in part reflect the greater variation in maturity levels among individuals at these ages. Tanner maturity scores of 2, 3, and 4 occurred in approximately equal proportions in this age range (29%, 27%, and 25%, respectively), while at each age below 12 or above 13, one or, at most, two Tanner stages accounted for more than 80% of the scores for that age. However, adjusting for Tanner scores did not appreciably change the mean or predicted profiles shown in Figure 2 (data not shown).
Figure 2.
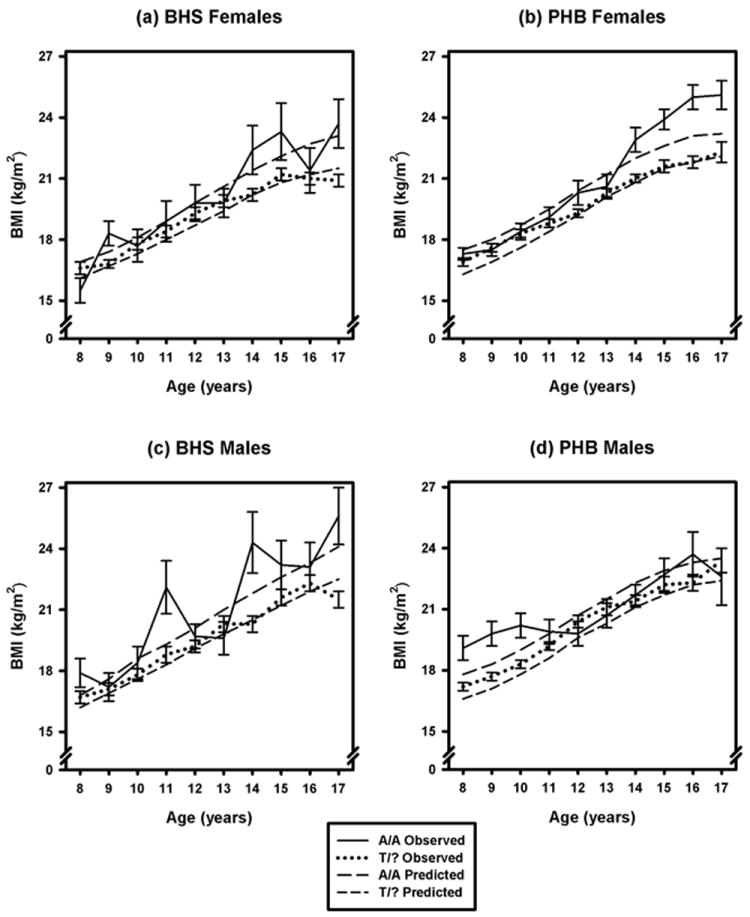
Longitudinal profiles by sex and FTO rs9939609 genotype in non-Hispanic whites from the Bogalusa Heart Study (BHS) and Project HeartBeat! (PHB) cohorts, constructed from mean BMI values (∀ one SE) at each age, superimposed on predicted longitudinal profiles by sex and genotype.
Discussion
All four FTO variants were associated with BMI in non-Hispanic whites, but we found no association between any of the four and BMI in African Americans in either the Bogalusa or Project HeartBeat! cohorts. A similar lack of association between FTO and BMI has been reported in both African American17 and Gambian16 populations. Another study found no association between obesity and one of the SNPs examined here, rs8050136, in an African American sample, but did find an association between obesity and another FTO SNP.15 A recent study in West Africans and African Americans also found no associations between obesity-related traits and any of the SNPs examined here, though associations with some other FTO SNPs were found.18 Differences between populations of European and African descent in linkage disequilibrium patterns in the FTO region may contribute to the differences in phenotype associations. Similar to others17, we found reduced r2 values between FTO markers in African Americans, though D’ values were still close to the maximum values possible given the allele frequencies.
In non-Hispanic whites from both cohorts, however, the A/A genotype was associated with higher BMI. In the Bogalusa Heart Study cohort, our analyses revealed an age-dependent effect of FTO genotype on BMI, with the increment in BMI associated with the A/A genotype being more than twice as high at age 17 (1.6 kg/m2) than at age 8 (0.7 kg/m2). The lack of an age-dependent effect in the Project HeartBeat! cohort seems unlikely to be due simply to differences in statistical power between the cohorts, because when an FTO-by-age interaction was forced into the model for the Project HeartBeat! cohort, its coefficient was close to zero and slightly negative (-0.026 ∀ 0.065) compared to its value in the Bogalusa cohort (0.102 ∀ 0.040). The difference may be related to the fact that in Project HeartBeat!, no individual subject could be followed for more than four years. Enrolling subjects at 8, 11, or 14 years of age and following them over a four-year period enabled the construction of a synthetic cohort covering subjects between 8 and 18 years of age, but no single individual had multiple examinations extending over the full age range of the cohort. In non-Hispanic whites, mean follow-up time for individuals was significantly longer (p < 0.0001) in the Bogalusa cohort (4.96 ∀ 1.95 years, with a maximum length of 9.7 years) than in Project HeartBeat! (2.70 ∀ 0.79 years, with a maximum length of 3.5 years), which may make it more difficult to detect age-by-genotype interactions in the Project HeartBeat! cohort.
It is also possible that there are differences in the cohorts related to secular trends in factors such as diet and exercise that could affect BMI, since many of the observations in the Bogalusa Heart Study were made between 1972 and 1990, while those in Project HeartBeat! were all made between 1991 and 1995. However, mean BMI values at each age in males and females from the two cohorts were similar; the only statistically significant difference between the cohorts in BMI at any age occurred in 9-year-old males, with a mean (SD) of 17.9 kg/m2 (3.1 kg/m2) in the Project HeartBeat! cohort and 17.1 kg/m2 (2.2 kg/m2) in the Bogalusa cohort (Supplementary Table 2). Overall, the pattern of the BMI growth curves in both cohorts accorded well with those in other longitudinal cohorts covering the same age range, in both older and more recent birth cohorts.28-30
Evidence from several other studies suggests that FTO associations with BMI or obesity may vary with age, though the patterns of change have differed among studies. In a sample of Finnish children measured multiple times between birth and 15 years of age, rs9939609 was reported to be associated with BMI in children only after age 7.19 The association of the rs9939609 A/A genotype with higher BMI in our cohorts of European descent resembled that for children between 8 and 15 years of age in the Finnish sample, and in a sample of Filipino women of childbearing age who were followed for up to 22 years; there were significant FTO-by-age interactions in both the Finnish and Filipino samples.9, 19 In the Filipino sample, however, the heterozygous A/T genotype was also associated with higher BMI, which was not the case in the Finnish sample or in our cohorts.9, 19 In a Danish sample, the A/A genotype of rs9939609, was significantly associated with weight gain between birth and 7 years of age, but not with further weight gain in childhood or early adolescence. However, a significant association with weight gain between adolescence and adulthood then reappeared.31 This finding of no association between rs9939609 and weight gain in early adolescence may be congruent with the possible loss of an association between genotype and BMI at ages 12 - 13 suggested by the mean profiles shown in Figure 2. However, physiological differences associated with heterogeneity in maturity levels around this age could possibly attenuate or obscure any association between BMI and FTO genotypes that might exist in this age group. A recent longitudinal study of subjects from the United Kingdom who were born in 1946 and measured multiple times between 2 and 53 years of age found that the association of the A allele of rs9939609 with higher BMI increased with age up to age 20, then weakened over time in adults; this result in children and adolescents is largely congruent with the findings reported here.32
We found no significant difference in FTO associations between males and females, in contrast to findings in a combined Swedish sample of 450 obese adolescents and 512 non-obese controls, in which the A/A genotype of rs9939609 was associated with higher BMI only in females.23 In that study, however, the frequency of the A allele differed noticeably between obese subjects and controls in girls (0.49 and 0.40, respectively) but not in boys (0.45 and 0.44, respectively), and mean BMI was much higher in cases than controls (35.4 ∀ 6.6 and 21.1 ∀ 2.6 kg/m2, respectively).23 It is difficult to compare these findings, in which obese cases and non-obese controls were combined for analysis, with findings in population-based cohorts such as those in our study. In a Korean sample, two of the SNPs we examined, rs1421085 and rs17817449, which were in strong disequilibrium with rs9939609 in our cohorts, were significantly associated with BMI in males, but not females, though most subjects were older (with a mean age of 35.4 years) than those in our cohorts.6 Other studies have found rs9939609 to be associated with BMI in both sexes.1, 33 The study by Frayling and colleagues reported an additive effect of the A allele in multiple populations; in the latter study, the A/T genotype appeared more strongly associated with BMI in women than in men, though tests for departure from an additive model in men were not significant. We found no evidence associating A/T heterozygosity with BMI profiles in either sex, while the A/A genotype was associated with BMI in both sexes and both cohorts.
It is well-established that variation in the FTO gene is associated with variation in BMI and other measures of obesity in many populations, especially those of European descent, but evidence from this study and several others suggests that some of these associations may change with age. Overall, our findings in the Bogalusa cohort suggest that the association of some FTO genotypes with higher BMI may change during the period from 8 - 17 years of age when many physiological and hormonal changes occur, though we could not replicate this finding in a second longitudinal cohort in which individuals were followed for a shorter time. If further studies can confirm the existence of age-related changes in genetic associations with body mass, this might help reveal the mechanisms regulating body mass in humans during a critical period of development. Such knowledge might be useful in the prevention and management of obesity, especially in young people.
Supplementary Material
Acknowledgments
Support: This work was supported by National Heart, Lung, and Blood Institute grants HL070568 and HL089472 and National Institute of Diabetes and Digestive and Kidney Diseases grant DK073618 (to DMH) and by National Institute of Child Health and Human Development grants HD061437 and HD062783, National Institute on Aging grant AG016592, and American Heart Association grant 0855082E (to GSB). We wish to express our gratitude to the subjects and staff members of Project HeartBeat! and the Bogalusa Heart Study.
Footnotes
SUPPLEMENTARY INFORMATION
Supplementary information is available at the International Journal of Obesity’s website (http://www.nature.com/ijo).
DISCLOSURE STATEMENT
None of the authors have any conflicts of interest with regard to this study.
References
- 1.Frayling TM, Timpson NJ, Weedon MN, Zeggini E, Freathy RM, Lindgren CM, et al. A common variant in the FTO gene is associated with body mass index and predisposes to childhood and adult obesity. Science. 2007;316:889–894. doi: 10.1126/science.1141634. [DOI] [PMC free article] [PubMed] [Google Scholar]
- 2.Dina C, Meyre D, Gallina S, Durand E, Körner A, Jacobson P, et al. Variation in FTO contributes to childhood obesity and severe adult obesity. Nat Genet. 2007;39:724–726. doi: 10.1038/ng2048. [DOI] [PubMed] [Google Scholar]
- 3.Cecil JE, Tavendale R, Watt P, Hetherington MM, Palmer CNA. An obesity-associated FTO gene variant and increased energy intake in children. N Engl J Med. 2008;359:2558–2566. doi: 10.1056/NEJMoa0803839. [DOI] [PubMed] [Google Scholar]
- 4.Timpson NJ, Emmett PM, Frayling TM, Rogers I, Hattersley AT, McCarthy MI, et al. The fat mass- and obesity-associated locus and dietary intake in children. Am J Clin Nutr. 2008;88:971–978. doi: 10.1093/ajcn/88.4.971. [DOI] [PMC free article] [PubMed] [Google Scholar]
- 5.Zhao J, Bradfield JP, Li M, Wang K, Zhang H, Kim CE, et al. The role of obesity-associated loci identified in genome-wide association studies in the determination of pediatric BMI. Obesity (Silver Spring) 2009;17:1038. doi: 10.1038/oby.2009.159. [DOI] [PMC free article] [PubMed] [Google Scholar]
- 6.Cha SW, Choi SM, Kim KS, Park BL, Kim JR, Kim JY, et al. Replication of the genetic effects of FTO polymorphisms on BMI in a Korean population. Obesity (Silver Spring) 2008;16:2187–2189. doi: 10.1038/oby.2008.314. [DOI] [PubMed] [Google Scholar]
- 7.Chang Y-C, Liu P-H, Lee W-J, Chang T-J, Jiang Y-D, Li H-Y, et al. Common variation in the Fat Mass and Obesity-associated (FTO) gene confers risk of obesity and modulates BMI in the Chinese population. Diabetes. 2008;57:2245–2252. doi: 10.2337/db08-0377. [DOI] [PMC free article] [PubMed] [Google Scholar]
- 8.Hotta K, Nakata Y, Matsuo T, Kamohara S, Kotani K, Komatsu R, et al. Variations in the FTO gene are associated with severe obesity in the Japanese. J Hum Genet. 2008;53:546–553. doi: 10.1007/s10038-008-0283-1. [DOI] [PMC free article] [PubMed] [Google Scholar]
- 9.Marvelle AF, Lange LA, Qin L, Adair LS, Mohlke KL. Association of FTO with obesity-related traits in the Cebu Longitudinal Health and Nutrition Survey (CLHNS) cohort. Diabetes. 2008;57:1987–1991. doi: 10.2337/db07-1700. [DOI] [PMC free article] [PubMed] [Google Scholar]
- 10.Ng MCY, Park KS, Oh B, Tam CHT, Cho YM, Shin HD, et al. Implication of genetic variants near TCF7L2, SLC30A8, HHEX, CDKAL1, CDKN2A/B, IGF2BP2, and FTO in type 2 diabetes and obesity in 6,719 Asians. Diabetes. 2008;57:2226–2233. doi: 10.2337/db07-1583. [DOI] [PMC free article] [PubMed] [Google Scholar]
- 11.Tan JT, Dorajoo R, Seielstad M, Sim XL, Ong RT, Chia KS, et al. FTO variants are associated with obesity in the Chinese and Malay populations in Singapore. Diabetes. 2008;57:2851–2857. doi: 10.2337/db08-0214. [DOI] [PMC free article] [PubMed] [Google Scholar]
- 12.Ohashi J, Naka I, Kimura R, Natsuhara K, Yamauchi T, Furusawa T, et al. FTO polymorphisms in oceanic populations. J Hum Genet. 2007;52:1031–1035. doi: 10.1007/s10038-007-0198-2. [DOI] [PubMed] [Google Scholar]
- 13.Horikawa Y, Miyake K, Yasuda K, Enya M, Hirota Y, Yamagata K, et al. Replication of genome-wide association studies of type 2 diabetes susceptibility in Japan. J Clin Endocrinol Metab. 2008;93:3136–3141. doi: 10.1210/jc.2008-0452. [DOI] [PubMed] [Google Scholar]
- 14.Li H, Wu Y, Loos RJF, Hu FB, Liu Y, Wang J, et al. Variants in the Fat Mass- and Obesity-associated (FTO) gene are not associated with obesity in a Chinese Han population. Diabetes. 2008;57:264–268. doi: 10.2337/db07-1130. [DOI] [PubMed] [Google Scholar]
- 15.Grant SFA, Li M, Bradfield JP, Kim CE, Annaiah K, Santa E, et al. Association analysis of the FTO gene with obesity in children of Caucasian and African ancestry reveals a common tagging SNP. PLoS ONE. 2008;3:e1746. doi: 10.1371/journal.pone.0001746. [DOI] [PMC free article] [PubMed] [Google Scholar]
- 16.Hennig BJ, Fulford AJ, Sirugo G, Rayco-Solon P, Hattersley AT, Frayling TM, et al. FTO gene variation and measures of body mass in an African population. BMC Med Genet. 2009;10:21. doi: 10.1186/1471-2350-10-21. [DOI] [PMC free article] [PubMed] [Google Scholar]
- 17.Scuteri A, Sanna S, Chen W-M, Uda M, Albai G, Strait J, et al. Genome-wide association scan shows genetic variants in the FTO gene are associated with obesity-related traits. PLoS Genet. 2007;3:e115. doi: 10.1371/journal.pgen.0030115. [DOI] [PMC free article] [PubMed] [Google Scholar]
- 18.Adeyemo A, Chen G, Zhou J, Shriner D, Doumatey A, Huang H, et al. FTO genetic variation and association with obesity in West Africans and African Americans. Diabetes. 2010;59:1549–1554. doi: 10.2337/db09-1252. [DOI] [PMC free article] [PubMed] [Google Scholar]
- 19.Hakanen M, Raitakari OT, Lehtimäki T, Peltonen N, Pahkala K, Sillanmäki L, et al. FTO genotype is associated with body mass index after the age of seven years but not with energy intake or leisure-time physical activity. J Clin Endocrinol Metab. 2009;94:1281–1287. doi: 10.1210/jc.2008-1199. [DOI] [PubMed] [Google Scholar]
- 20.Lépez-Bermejo A, Petry CJ, Diaz M, Sebastiani G, de Zegher F, Dunger DB, et al. The association between the FTO gene and fat mass in humans develops by the postnatal age of two weeks. J Clin Endocrinol Metab. 2008;93:1501–1505. doi: 10.1210/jc.2007-2343. [DOI] [PubMed] [Google Scholar]
- 21.Wardle J, Llewellyn C, Sanderson S, Plomin R. The FTO gene and measured food intake in children. Int J Obesity. 2009;33:42–45. doi: 10.1038/ijo.2008.174. [DOI] [PubMed] [Google Scholar]
- 22.Haworth CMA, Carnell S, Meaburn EL, Davis OSP, Plomin R, Wardle J. Increasing heritability of BMI and stronger associations with the FTO gene over childhood. Obesity (Silver Spring) 2008;16:2663–2668. doi: 10.1038/oby.2008.434. [DOI] [PubMed] [Google Scholar]
- 23.Jacobsson JA, Danielsson P, Svensson V, Klovins J, Gyllenstein U, Marcus C, et al. Major gender differences in association of FTO gene variant among severely obese children with obesity and obesity related phenotypes. Biochem Biophys Res Comm. 2008;368:476–482. doi: 10.1016/j.bbrc.2008.01.087. [DOI] [PubMed] [Google Scholar]
- 24.Berenson GS, McMahan CA, Voors AW, Webber LS, Srinivasan SR, Frank GC, et al. Cardiovascular Risk Factors in Children. The Early Natural History of Atherosclerosis and Essential Hypertension. New York: Oxford University Press; 1980. [Google Scholar]
- 25.Labarthe DR, Nichaman MZ, Harrist RB, Grunbaum JA, Dai S the Project HeartBeat! Investigators. Development of cardiovascular risk factors from ages 8 to 18 in Project HeartBeat! Study design and patterns of change in plasma total cholesterol concentration. Circulation. 1997;95:2636–2642. doi: 10.1161/01.cir.95.12.2636. [DOI] [PubMed] [Google Scholar]
- 26.Hallman DM, Srinivasan SR, Elkasabany A, Boerwinkle E, Berenson GS. The Ser447-Stop polymorphism of lipoprotein lipase is associated with variation in longitudinal serum high-density lipoprotein-cholesterol profiles: The Bogalusa Heart Study. Metabolism. 2001;50:894–904. doi: 10.1053/meta.2001.24918. [DOI] [PubMed] [Google Scholar]
- 27.Hallman DM, Srinivasan SR, Chen W, Boerwinkle E, Berenson GS. The ∃2-adrenergic receptor Arg16-Gly polymorphism and interactions involving ∃2- and ∃3-adrenergic receptor polymorphisms are associated with variations in longitudinal serum lipid profiles: The Bogalusa Heart Study. Metabolism. 2004;53:1184–1191. doi: 10.1016/j.metabol.2004.03.019. [DOI] [PubMed] [Google Scholar]
- 28.Cronk CE, Roche AF, Kent R, Berkey C, Reed RB, Valadian I, et al. Longitudinal trends and continuity in weight/stature2 from 3 months to 18 years. Hum Biol. 1982;54:729–749. [PubMed] [Google Scholar]
- 29.Hlaing WM, Prineas RJ, Zhu Y, Leaverton PE. Body mass index growth in a sample of U.S. children: Repeated measures data analysis of the Minneapolis Children’s Blood Pressure Study. Am J Human Biol. 2001;13:821–831. doi: 10.1002/ajhb.1127. [DOI] [PubMed] [Google Scholar]
- 30.Guo SS, Huang C, Maynard LM, Demerath E, Towne B, Chumlea WC, et al. Body mass index during childhood, adolescence and young adulthood in relation to adult overweight and adiposity: the Fels Longitudinal Study. Int J Obesity. 2000;24:1628–1635. doi: 10.1038/sj.ijo.0801461. [DOI] [PubMed] [Google Scholar]
- 31.Jess T, Zimermann E, Kring SII, Berentzen T, Holst C, Toubro S, et al. Impact on weight dynamics and general growth of the common FTO rs9939609: a longitudinal Danish cohort study. Int J Obesity. 2008;32:1388–1394. doi: 10.1038/ijo.2008.110. [DOI] [PubMed] [Google Scholar]
- 32.Hardy R, Wills AK, Wong A, Elks CE, Wareham NJ, Loos RJF, et al. Life course variations in the associations between FTO and MC4R gene variants and body size. Hum Mol Genet. 2010;19:545–552. doi: 10.1093/hmg/ddp504. [DOI] [PMC free article] [PubMed] [Google Scholar]
- 33.Qi L, Kang K, Zhang C, van Dam RM, Kraft P, Hunter D, et al. Fat mass- and obesity-associated (FTO) gene variant is associated with obesity. Longitudinal analyses in two cohort studies and functional test. Diabetes. 2008;57:3145–3151. doi: 10.2337/db08-0006. [DOI] [PMC free article] [PubMed] [Google Scholar]
Associated Data
This section collects any data citations, data availability statements, or supplementary materials included in this article.