

Abstract
Background
Hepatic steatosis in HCV patients has been postulated as a risk factor associated with a higher frequency of fibrosis and cirrhosis. A single genetic variant, PNPLA3 I148M, has been widely associated with increased hepatic steatosis. Previous studies of the PNPLA3 I148M sequence variant in HCV infected individuals have reported an association between this variant and prevalence of steatosis, fibrosis, and cirrhosis. To evaluate the impact of PNPLA3 I148M variant on metabolic traits and treatment response in HCV genotype 2 and 3 infected patients.
Methods
Three hundred and eighty-two treatment naïve HCV genotype 2 or 3 infected patients were included in a phase III, open label, randomized, multicenter, investigator-initiated trial (the NORDynamIC study), in which pretreatment liver biopsies were mandatory. PNPLA3I148M genotyping was performed in a total of 359 Caucasian patients.
Results
In HCV genotype 2 infected patients carrying the PNPLA3 148M allele, there was significantly increased insulin resistance (P = 0.023) and lower viral load (P = 0.005) at baseline as well as the first seven days of antiviral treatment. These results were not observed in HCV genotype 3 infected patients.
Conclusions
Our results suggest a possible association between the PNPLA3 148M allele and insulin resistance as well as baseline viral load in HCV genotype 2, but not in genotype 3.
Keywords: Hepatitis C, PNPLA 3, Insulin resistance, Viral load
Background
Chronic hepatitis C virus (HCV) infection is a major cause of cirrhosis and liver failure [1]. Hepatic steatosis is twice as common in HCV infected patients as in the normal population [2] and it is associated with fibrosis and cirrhosis development [3,4]. Metabolic host factors, mainly obesity, insulin resistance and type 2 diabetes, are thought to play an important role in the steatosis development in non–genotype 3 infected individuals, whereas HCV genotype 3-associated hepatic steatosis appears to mainly result from a direct viral action [4-6].
A single genetic variant, I148M, entailing a change from isoleucine (I) to methionine (M) at position 148 in the human patatin-like phospholipase domain containing 3 gene (PNPLA3, Adiponutrin) on chromosome 22 has been widely associated with increased hepatic steatosis [7-11]. Recently, in a murine model, PNPLA3 was found to be involved in the hepatic metabolism of triglycerides and in the regulation of systemic glucose homeostasis [12]. Even if previous reports failed to find an association with insulin resistance assessed by euglycemic hyperinsulinemic clamp or surrogates in humans [8,13-15], a recent study reported that PNPLA3 I148M variant is associated with insulin resistance in a normoglycaemic population from Taiwan [16]. Furthermore, the PNPLA3 148M allele genetic variant was found to be associated with lower serum triglyceride and higher fasting glucose levels in individuals with gallstones [17]. In the setting of HCV infection, PNPLA3 I148M sequence variant has been extensively associated with steatosis, fibrosis progression, cirrhosis and hepatocellular carcinoma [18-21]. So far, no association has been reported between the PNPLA3 I148M variant and insulin resistance or triglyceride levels in individuals with HCV infection [18,20].
The aim of the present study was to examine the impact of PNPLA3 I148M variant on metabolic traits and treatment response in a well phenotyped HCV genotype 2 and 3 cohort, within the framework of the NORDynamIC treatment trial [22].
Methods
Patients
Three hundred and eighty-two treatment naïve HCV genotype 2 or 3 infected patients were included in a phase III, open label, randomized, multicenter, investigator-initiated trial (the NORDynamIC study) conducted at 31 centers in Denmark, Finland, Norway, and Sweden. Details regarding demographics and clinical characteristics have been previously reported [22]. Briefly, all patients were adults with compensated liver disease, had detectable HCV RNA, and were seronegative for hepatitis B surface antigen and for antibodies to human immune deficiency virus. A liver biopsy consistent with chronic hepatitis C within 24 months prior to inclusion was also required. At study entry, patients were randomized to either 12 or 24 weeks of treatment with 180 μg of peg-interferon α-2a once weekly and 800 mg/day ribavirin. After excluding all non-Caucasians as well as two patients positive for both HCV genotypes 2 and 3, a total of 359 patients were examined. Alcohol consumption was measured as standard drink units (12 g of pure alcohol) per day [23].
PCR PNPLA3 genotyping, rs738409
The variation at rs738409 was determined by amplification on an ABI7300 (Applied Biosystems) using rs738409_F, GTGCCTGTCGTGTACTGAACCA as forward primer, rs738409_R, AGCGCGGAGTGCAATTCA as reverse primer, and Taqman MGB (minor groove binding) probes (rs738409-pC, FAM-CTGCTTCATCCCCTTC-MGB, rs738409-pG, VIC-GGAAGGAGGGATAAGGCCACT-MGB) for allelic discrimination.
Serum metabolic parameters
Baseline fasting glucose (mmol/L) was measured at individual sites on freshly drawn serum, whereas fasting serum insulin was analyzed on frozen samples at the central laboratory (mU/L, Architect Insulin, Abbott, Abbott Park, IL). Diabetes mellitus was defined as fasting serum glucose ≥ 7.0 mmol/L. Insulin resistance was assessed by using the homeostatic model assessment insulin for resistance (HOMA-IR) index. The gold standard for insulin resistance assessment is the euglycemic hyperinsulinemic clamp technique [24]. However, this method is demanding and time-consuming and therefore is not commonly used in genetic and epidemiologic studies. The HOMA-IR is a well known and widely used surrogate index to quantify insulin resistance that is highly correlated with clamp estimations [25,26]. HOMA-IR was calculated using the formula: (Glucose mmol/L × Insulin mU/L)/22.5 [27].
Histological assessment
Fibrosis and necroinflammatory activity were assessed according to the Ishak protocol by two experienced observers in a dual observer consensus fashion as described [22,28]. Specifically, presence of fibrosis was defined as Ishak stage ≥1, and cirrhosis as Ishak stage 5–6. Steatosis was graded as follows: absent (grade 0), mild (less than 30 % of hepatocytes involved, grade 1), moderate (30-70 % of hepatocytes involved, grade 2) or severe (>70 % of hepatocytes involved, grade 3), although in the present study reported as absent or present (grade 1–3).
HCV RNA quantification
HCV RNA was determined by RT-PCR of plasma using Cobas AmpliPrep/COBAS TaqMan HCV Test (Roche Diagnostics, Branchburg, NJ), which quantifies HCV RNA with a limit of detection of 15 IU/mL. HCV RNA quantification was performed on days 0, 3, 7, 8, 29, and on weeks 8, 12, and 24 (for those receiving 24 weeks of therapy), and 24 weeks after completion of therapy. All samples were frozen (−70 °C), and subsequently analyzed at a central laboratory.
Statistical methods
Continuous variables were presented as median and the range between the 25th and 75th percentile (interquartile range). Categorical variable distributions were compared using either the χ2 test or the Fisher’s exact test. Continuous variables were analyzed with linear regression, when necessary after logarithmic transformation in order to create a normal distribution. Metabolic parameters were adjusted for age, gender and body mass index (BMI). Both additive (add) and recessive (rec) inheritance models were tested. Binary logistic regression analysis was used to calculate allelic odds ratio and 95 % confidence interval. Frequency distribution of genetic variants was evaluated according to the Hardy Weinberg equilibrium. All statistical analyses were performed using the IBM SPSS statistics version 19 (IBM Corporation, Somers, NY) software package. A two-sided P-value of <0.05 was considered statistically significant.
Ethical considerations
The Regional Ethics Review Board in Gothenburg approved the study. All patients signed informed consent. The study is registered at the NIH trial registry (ClinicalTrials.gov Identifier: NCT00143000).
Results
PNPLA3 I148M genotype
A total of 359 individuals were analyzed for the PNPLA3 I148M genotype (II, IM or MM). Among these, 103 were infected with HCV genotype 2 and 256 with genotype 3. The distribution of the PNPLA3 I148M genotype was in Hardy Weinberg equilibrium (P = 0.691 for genotype 2 and P = 0.468 for genotype 3, Additional file 1: Table S1). The PNPLA3 I148M genotype frequency in our study cohort ( Additional file 1: Table S1) was consistent with previously reported frequencies for Northern Europeans [29]. Study group characteristics stratified by HCV genotype 2 or HCV genotype 3 infection are described in Table 1. Individuals with HCV genotype 2 infection were on average nine years older, they had lower alanine transferase (ALT) levels and lower degree of steatosis compared to individuals with HCV genotype 3 infection. They also had higher total cholesterol and HCV RNA at baseline compared to the HCV genotype 3 group (Table 1).
Table 1.
Baseline characteristics stratified by HCV genotype
| HCV genotype 2 n = 103 | HCV genotype 3 n = 256 | P value | |
|---|---|---|---|
|
Male gender, n (%) |
62 (60) |
154 (60) |
0.920 |
|
Age, years |
49 (41–54) |
40 (32–48) |
<0.001 |
|
BMI, kg/m
2
|
25a (23–27) |
25b (23–28) |
0.290 |
|
ALT, U/l |
74a (44–144) |
108a (66–175) |
<0.001 |
|
Total cholesterol, mmol/L |
4.6c (4.1-5.4) |
3.9d (3.3-4.6) |
<0.001 |
|
Triglycerides, mmol/L |
0.9c (0.7-1.3) |
0.9d (0.7-1.4) |
0.748 |
|
Glucose, mmol/L |
4.9d (4.6-5.4) |
4.9e (4.5-5.4) |
0.507 |
|
Insulin, mIU/L |
12f (6–24) |
12e (7–26) |
0.458 |
|
HOMA-IR, U |
2.5g (1.3-6.0) |
2.7h (1.6-5.9) |
0.088 |
|
Baseline HCV RNA, log
10
IU/mL |
6.5 (5.8-6.8) |
6.1 (5.4-6.7) |
0.025 |
|
Steatosis
1
, n (%) |
49c (50) |
171i (73) |
<0.001 |
|
Cirrhosis
2
, n (%) |
14c (14) |
29i (12) |
0.807 |
| Diabetes mellitus, n (%) | 4d (4) | 7e (3) | 0.823 |
Categorical traits, expressed as number (n) and relative proportion (%), have been compared by χ2 test. Continuous traits are expressed as median (interquartile range) and have been analyzed using a linear regression model. For additional information on statistical analyses, see methods.
1Steatosis was defined as histological grade > 0. 2Cirrhosis was defined as Ishak stage 5–6.
Missing data: an = 1, bn = 8, cn = 4, dn = 6, en = 15, fn = 7, gn = 13, hn = 27,in = 23.
Abbreviations: HCV, hepatitis C virus; BMI, body mass index; ALT, alanine transferase; HOMA-IR, homeostasis model assessment for insulin resistance; II, individuals with two 148I alleles; MM, individuals with two 148 M alleles; IM, heterozygotes.
Clinical and biochemical profile
PNPLA3 148M allele carriers were found to have increased insulin resistance in HCV genotype 2 infected patients (Padd = 0.023, Prec = 0.005; Table 2 and Figure 1 A). No association with insulin resistance and the PNPLA3 148M allele was found in individuals with HCV genotype 3 (Table 3 and Figure 1 B). Results were virtually identical after excluding individuals with diabetes mellitus (HCV genotype 2 HOMA-IR (U): II 1.8 [1.1-4.2], IM 3.0 [1.4-6.7], MM 9.0 [4.8-21.7]; Padd = 0.003, Prec = 0.002; HCV genotype 3 HOMA-IR (U): II 2.6 [1.5-5.8], IM 2.6 [1.6-4.8], MM 2.5 [1.5-8.4]; Padd = 0.811, Prec = 0.973). No significant association of triglyceride levels with PNPLA3 I148M genotypes was found in either HCV genotype 2 or 3 patients (Tables 2 and 3). In HCV genotype 2 individuals, the PNPLA3 148M allele was found to be associated with higher ALT levels only if analyzed under a recessive inheritance model (Prec = 0.045, Table 2). Carriage of the PNPLA3 148M allele was not associated with age, gender, BMI or total cholesterol in either HCV genotype group (Tables 2 and 3).
Table 2.
Baseline characteristics according to PNPLA3 I148M sequence variant in HCV genotype 2 patients
|
II |
IM |
MM |
P value |
P value |
|
|---|---|---|---|---|---|
| n = 56 | n = 43 | n = 4 | additive | recessive | |
|
Male gender, n (%) |
33 (59) |
27 (63) |
2 (50) |
0.830 |
0.999 |
|
Age, years |
50 (42–56) |
48 (37–54) |
51 (36–53) |
0.370 |
0.887 |
|
BMI, kg/m
2
|
25 (23–27) |
25a (22–27) |
23 (21–33) |
0.773 |
0.981 |
|
ALT, U/l |
73a (44–150) |
72 (39–137) |
147 (88–455) |
0.406 |
0.045 |
|
Total cholesterol, mmol/L |
4.8b (4.1-5.5) |
4.6a (4.2-5.1) |
4.2 (3.9-5.8) |
0.283 |
0.756 |
|
Triglycerides, mmol/L |
1.0b (0.8-1.3) |
0.9a (0.7-1.3) |
0.7 (0.4-1.3) |
0.094 |
0.065 |
|
Glucose, mmol/L |
4.9d (4.6-5.1) |
5.0e (4.5-5.4) |
4.5 (4.2-5.6) |
0.502 |
0.724 |
|
Insulin, mIU/L |
10d (5–23) |
13c (7–29) |
48 (24–86) |
0.027 |
0.001 |
|
HOMA-IR, U |
1.9e (1.1-4.5) |
2.9f (1.4-6.7) |
9.0 (4.8-21.7) |
0.023 |
0.005 |
|
Baseline HCV RNA, log
10
IU/mL |
6.5 (6.0-6.9) |
6.4 (5.3-6.8) |
5.3 (4.7-6.4) |
0.005 |
0.073 |
|
Steatosis
1
, n (%) |
23b (43) |
23a (55) |
3 (75) |
0.327 |
0.362 |
|
Cirrhosis
2
, n (%) |
7b (13) |
6a (14) |
1 (25) |
0.669 |
0.462 |
| Diabetes mellitus, n (%) | 3d (6) | 1e (3) | 0 (0) | 0.694 | 0.998 |
Categorical traits, expressed as number (n) and relative proportion (%), have been compared by Fisher exact test. Continuous traits are expressed as median (interquartile range) and have been analyzed using a linear regression model. For additional information on statistical analyses, see methods.
1Steatosis was defined as histological grade > 0. 2Cirrhosis was defined as Ishak stage 5–6.
Missing data: an = 1, bn = 3, cn = 5, dn = 2, en = 4, fn = 9.
Abbreviations: PNPLA3, patatin-like phospholipase domain-containing 3; HCV, hepatitis C virus; BMI, body mass index; ALT, alanine transferase; HOMA-IR, homeostasis model assessment for insulin resistance; II, individuals with two 148I alleles; MM, individuals with two 148 M alleles; IM, heterozygotes.
Figure 1 .

Homeostasis model assessment for insulin resistance (HOMA-IR) in HCV genotype 2 (A) and genotype 3 (B) infected patients, stratified by the PNPLA3 I148M genotype. P values were calculated using linear regression after logarithmic transformation of HOMA-IR values and adjusted for age, gender and BMI.
Table 3.
Baseline characteristics according to PNPLA3 I148M sequence variant in HCV genotype 3 patients
|
II |
IM |
MM |
P value |
P value |
|
|---|---|---|---|---|---|
| n = 159 | n = 91 | n = 6 | additive | recessive | |
|
Male gender, n (%) |
97 (61) |
52 (57) |
5 (83) |
0.466 |
0.407 |
|
Age, years |
39 (31–47) |
41 (35–48) |
42 (29–46) |
0.128 |
0.653 |
|
BMI, kg/m
2
|
26a (23–29) |
25a (23–28) |
26 (22–28) |
0.232 |
0.644 |
|
ALT, U/l |
108 (68–175) |
106d (62–181) |
69 (61–109) |
0.398 |
0.248 |
|
Total cholesterol, mmol/L |
4.0e (3.3-4.7) |
3.8a (3.2-4.5) |
3.7 (3.1-5.7) |
0.909 |
0.452 |
|
Triglycerides, mmol/L |
0.9e (0.7-1.3) |
0.9a (0.7-1.4) |
0.8 (0.6-1.1) |
0.336 |
0.256 |
|
Glucose, mmol/L |
4.9c (4.5-5.6) |
4.9f (4.6-5.3) |
4.8 (4.6-5.4) |
0.147 |
0.882 |
|
Insulin, mIU/L |
13g (7–26) |
12h (7–25) |
12 (6–39) |
0.800 |
0.785 |
|
HOMA-IR, U |
2.7i (1.5-6.1) |
2.6j (1.6-4.7) |
2.5 (1.5-8.4) |
0.882 |
0.941 |
|
Baseline HCV RNA, log
10
IU/mL |
6.0 (5.3-6.7) |
6.2 (5.6-6.7) |
6.8 (6.1-7.1) |
0.030 |
0.100 |
|
Steatosis
1
, n (%) |
99k (68) |
68c (82) |
4d (80) |
0.068 |
0.989 |
|
Cirrhosis
3
, n (%) |
17k (12) |
11c (13) |
1d (20) |
0.636 |
0.489 |
| Diabetes mellitus, n (%) | 6c (4) | 1f (1) | 0 (0) | 0.520 | 0.996 |
Categorical traits, expressed as number (n) and relative proportion (%), have been compared by Fisher exact test. Continuous traits are expressed as median (interquartile range) and have been analyzed using a linear regression model. For additional information on statistical analyses, see methods.
1Steatosis was defined as histological grade > 0. 2Cirrhosis was defined as Ishak stage 5–6.
Missing data: an = 4, bn = 18, cn = 8, dn = 1, en = 2, fn = 7, gn = 9, hn = 6, in = 16, jn = 11, kn = 14. Abbreviations: PNPLA3, patatin-like phospholipase domain-containing 3; HCV, hepatitis C virus; BMI, body mass index; ALT, alanine transferase; HOMA-IR, homeostasis model assessment for insulin resistance; II, individuals with two 148I alleles; MM, individuals with two 148 M alleles; IM, heterozygotes.
Viral kinetics
Among the HCV genotype 2 infected individuals, the PNPLA3 148M allele was associated with lower viral load at baseline (Padd = 0.005, Prec = 0.073, Table 2), on day 3 (Padd = 0.014 Prec = 0.130) and on day 7 (Padd = 0.003, Prec = 0.036; Figure 2A). In contrast, HCV genotype 3 patients with the PNPLA3 148M allele genotype had higher baseline viral load (Padd = 0.030, Prec = 0.100, Table 3). No further associations between the PNPLA3 genotype and viral load during treatment (Figure 2B), first or second phase decline in HCV RNA, or final treatment outcome (sustained viral response rate in the HCV genotype 2 group was 66, 70 and 100 % and in the HCV genotype 3 group 67, 74 and 67 %, respectively in the II, IM and MM groups respectively), were observed.
Figure 2 .
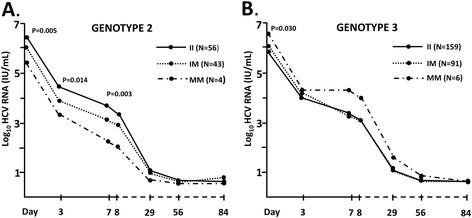
HCV viral load according to the PNPLA3 I148M genotype in HCV genotype 2 (A) and genotype 3 (B) infected patients from start of treatment (day 0) through treatment week 12 (day 84). Viral load is expressed as mean log10 value at each time point. P values were calculated for the difference in viral load across PNPLA3 I148M genotypes at each time point using linear regression.
Liver histology
A trend, although non-significant, towards a higher prevalence of steatosis was observed in PNPLA3 148M allele carriers in both HCV genotype 2 and 3 subjects (Tables 2 and 3). PNPLA3 148M allele was found associated with hepatic steatosis increased risk, although non-significant, in HCV genotype 2 (allelic Odds Ratio, O.R. = 2.3, 95 % Confidence Interval C.I. = 0.9-5.5, Padd = 0.053, Prec = 0.154, after adjustment for age, gender and BMI) and 3 (allelic O.R. = 1.7, 95 % C.I. = 0.9-3.4, Padd = 0.096, Prec = 0.991, after adjustment for age, gender and BMI) subjects. No association between the prevalence of cirrhosis and the PNPLA3 148M allele was observed in either HCV genotype 2 or 3 infected subjects (Tables 2 and 3).
Discussion
The main finding of the present study is the association between the PNPLA3 148M allele and increased insulin resistance and lower baseline viral load among HCV genotype 2 infected patients. PNPLA3 I148M is the most widely replicated genetic variant associated with increased hepatic steatosis [7-11,30]. Moreover, PNPLA3 148M allele carriers with HCV infection have been reported to have increased prevalence of steatosis, fibrosis, cirrhosis and hepatocellular carcinoma [18-21]. Recent studies on the PNPLA3 148M allele and glucose metabolism suggest a possible involvement of this allele as a genetic determinant [16,17].
In this study an association between increased insulin resistance and the PNPLA3 148M allele was observed. This association was specifically present in HCV genotype 2 and it was not observed among HCV genotype 3 infected patients. Steatosis is tightly associated with insulin resistance [31,32]; however, the causal nature of this association remains to be fully elucidated. Insulin resistance has been commonly thought to be a risk factor for liver fat accumulation [33,34]. Nevertheless, new evidence suggests that hepatic steatosis might be pathogenically responsible for the development of insulin resistance [16,32,35]. The association of PNPLA3 148M allele with HOMA-IR in HCV infected subjects supports the hypothesis that insulin resistance may be interpreted as a consequence rather than a cause of hepatic steatosis. To date the role of the PNPLA3 I148M variant on insulin resistance has been controversial, having some previous studies failed to find this association [8,13-15]; however our result is consistent with a recent study performed in normoglycaemic subjects from Taiwan [16] that reports 148M allele carriers having higher HOMA-IR levels. Further studies in larger cohorts are warranted to confirm this result.
Interestingly, we found that lower baseline viral load was associated with the PNPLA3 148M allele in HCV genotype 2 but not in HCV genotype 3 infected patients. This finding is novel [20], although difficult to interpret. HCV has been shown to exploit lipoprotein assembly and export pathways for the release of virions from infected hepatocytes [36-38]. Since PNPLA3 148M allele has been reported to influence lipid accumulation in the liver [39], it is possible to hypothesize that PNPLA3 148M allele may impair both viral and lipoprotein release from infected hepatocytes resulting in lower baseline plasma viral load in HCV genotype 2 infection. In the presence of HCV genotype 3 infection, however, the intrahepatic impact of PNPLA3 148M allele on lipid particle production appears to be overridden by viral factors.
An important limitation of the present study is the relative small sample size of the HCV genotype 2 infected patients, as well as relative lower rate of PNPLA3 148M allele carriage in Northern Europeans as compared to previous reports from Southern Europe. In fact, even though steatosis has been widely reported to be associated with PNPLA3 148M allele [7,18-20], only a non-significant trend towards higher prevalence of steatosis was observed among PNPLA3 148M allele carriers in both HCV genotypes in the present study. However, in the analysis adjusted for confounders, the increased risk of steatosis reached marginal significance in genotype 2 but not 3 infected individuals, despite the threefold larger sample size of the latter group. This is in line with previous data showing an association between the PNPLA3 I148M genotype and steatosis in the HCV genotype 2 but not in the HCV genotype 3 infected subjects [18,19]. Similarly, the relative small sample size of HCV genotype 2 infected patients in the present study may have contributed to the lack of association of the PNPLA3 148M allele with therapeutic outcome despite its effect on baseline viral load and insulin resistance. It is important to bear in mind that given the small sample size our results should be carefully interpreted due to the possibility of both false positive and negative associations. Therefore, this should be considered as a preliminary report and the results need to be confirmed in larger patient cohorts.
Conclusions
Our results suggest an association between the PNPLA3 148M allele and insulin resistance as well as viral load in HCV genotype 2, but not genotype 3 infected individuals. Additional further genetic studies are required to elucidate the relationship between HCV infection, metabolic traits and PNPLA3 I148M genetic variant.
Competing interests
None of the authors have an association that might pose a conflict of interest.
Authors’ contributions
KR, CM: equal contributions; responsible for data compilation, statistical modeling and writing of the manuscript. JW, SR: equal contributions; planning and performing of the study, data compilation, statistical modeling, corresponding authors, writing of the manuscript. MLa, CP, MAB, KH : planning and performing of the study, data compilation, statistical modeling, writing of the manuscript. MLi: responsible for genetic analyses. PBC, MF, NL, MRB, CP, KM, GN: clinical management of patients, planning and performing the treatment trial. All authors read and approved the final manuscript.
Pre-publication history
The pre-publication history for this paper can be accessed here:
Supplementary Material
Table S1. Genotype and allele frequencies of the PNPLA3 I148M sequence variant in HCV genotype 2 and 3 individuals.
Contributor Information
Karolina Rembeck, Email: karolinarembeck@gmail.com.
Cristina Maglio, Email: cristina.maglio@wlab.gu.se.
Martin Lagging, Email: martin.lagging@medfak.gu.se.
Peer Brehm Christensen, Email: peer.christensen@dadlnet.dk.
Martti Färkkilä, Email: martti.farkkila@hus.fi.
Nina Langeland, Email: nina.langeland@mofa.uib.no.
Mads Rauning Buhl, Email: madsbuhl@rm.dk.
Court Pedersen, Email: Court.Pedersen@ouh.regionsyddanmark.dk.
Kristine Mørch, Email: kristine.morch@helse-bergen.no.
Gunnar Norkrans, Email: gunnar.norkrans@vgregion.se.
Kristoffer Hellstrand, Email: kristoffer.hellstrand@microbio.gu.se.
Magnus Lindh, Email: magnus.lindh@microbio.gu.se.
Carlo Pirazzi, Email: carlo.pirazzi@wlab.gu.se.
Maria Antonella Burza, Email: Maria-Antonella.Burza@wlab.gu.se.
Stefano Romeo, Email: stefano.romeo@wlab.gu.se.
Johan Westin, Email: johan.westin@gu.se.
Acknowledgements
The authors would like to thank Ann-Sofie Tylö for expert technical assistance. This study was funded by The Swedish Research Counsil (grant no: 523-2011-3821) and ALF Funds at the Sahlgrenska University Hospital (grant no: ALFGBG-143271). Roche affiliates in the Nordic region supported this study.
References
- Lauer GM, Walker BD. Hepatitis C virus infection. N Engl J Med. 2001;345(1):41–52. doi: 10.1056/NEJM200107053450107. [DOI] [PubMed] [Google Scholar]
- Lonardo A, Adinolfi LE, Loria P, Carulli N, Ruggiero G, Day CP. Steatosis and hepatitis C virus: mechanisms and significance for hepatic and extrahepatic disease. Gastroenterology. 2004;126(2):586–597. doi: 10.1053/j.gastro.2003.11.020. [DOI] [PubMed] [Google Scholar]
- Westin J, Lagging M, Dhillon AP, Norkrans G, Romero AI, Pawlotsky JM, Zeuzem S, Schalm SW, Verheij-Hart E, Negro F. et al. Impact of hepatic steatosis on viral kinetics and treatment outcome during antiviral treatment of chronic HCV infection. J Viral Hepat. 2007;14(1):29–35. doi: 10.1111/j.1365-2893.2006.00777.x. [DOI] [PubMed] [Google Scholar]
- Adinolfi LE, Gambardella M, Andreana A, Tripodi MF, Utili R, Ruggiero G. Steatosis accelerates the progression of liver damage of chronic hepatitis C patients and correlates with specific HCV genotype and visceral obesity. Hepatology. 2001;33(6):1358–1364. doi: 10.1053/jhep.2001.24432. [DOI] [PubMed] [Google Scholar]
- Rubbia-Brandt L, Fabris P, Paganin S, Leandro G, Male PJ, Giostra E, Carlotto A, Bozzola L, Smedile A, Negro F. Steatosis affects chronic hepatitis C progression in a genotype specific way. Gut. 2004;53(3):406–412. doi: 10.1136/gut.2003.018770. [DOI] [PMC free article] [PubMed] [Google Scholar]
- Leandro G, Mangia A, Hui J, Fabris P, Rubbia-Brandt L, Colloredo G, Adinolfi LE, Asselah T, Jonsson JR, Smedile A. et al. Relationship between steatosis, inflammation, and fibrosis in chronic hepatitis C: a meta-analysis of individual patient data. Gastroenterology. 2006;130(6):1636–1642. doi: 10.1053/j.gastro.2006.03.014. [DOI] [PubMed] [Google Scholar]
- Romeo S, Kozlitina J, Xing C, Pertsemlidis A, Cox D, Pennacchio LA, Boerwinkle E, Cohen JC, Hobbs HH. Genetic variation in PNPLA3 confers susceptibility to nonalcoholic fatty liver disease. Nat Genet. 2008;40(12):1461–1465. doi: 10.1038/ng.257. [DOI] [PMC free article] [PubMed] [Google Scholar]
- Kotronen A, Johansson LE, Johansson LM, Roos C, Westerbacka J, Hamsten A, Bergholm R, Arkkila P, Arola J, Kiviluoto T. et al. A common variant in PNPLA3, which encodes adiponutrin, is associated with liver fat content in humans. Diabetologia. 2009;52(6):1056–1060. doi: 10.1007/s00125-009-1285-z. [DOI] [PubMed] [Google Scholar]
- Romeo S, Sentinelli F, Dash S, Yeo GS, Savage DB, Leonetti F, Capoccia D, Incani M, Maglio C, Iacovino M. et al. Morbid obesity exposes the association between PNPLA3 I148M (rs738409) and indices of hepatic injury in individuals of European descent. Int J Obes (Lond) 2010;34(1):190–194. doi: 10.1038/ijo.2009.216. [DOI] [PubMed] [Google Scholar]
- Speliotes EK, Butler JL, Palmer CD, Voight BF, Hirschhorn JN, Consortium G, Consortium M. CRN N: PNPLA3 variants specifically confer increased risk for histologic nonalcoholic fatty liver disease but not metabolic disease. Hepatology. 2010;52(3):904–912. doi: 10.1002/hep.23768. [DOI] [PMC free article] [PubMed] [Google Scholar]
- Valenti L, Alisi A, Galmozzi E, Bartuli A, Del Menico B, Alterio A, Dongiovanni P, Fargion S, Nobili V. I148M patatin-like phospholipase domain-containing 3 gene variant and severity of pediatric nonalcoholic fatty liver disease. Hepatology. 2010;52(4):1274–1280. doi: 10.1002/hep.23823. [DOI] [PubMed] [Google Scholar]
- Qiao A, Liang J, Ke Y, Li C, Cui Y, Shen L, Zhang H, Cui A, Liu X, Liu C. et al. Mouse patatin-like phospholipase domain-containing 3 influences systemic lipid and glucose homeostasis. Hepatology. 2011;54(2):509–521. doi: 10.1002/hep.24402. [DOI] [PubMed] [Google Scholar]
- Santoro N, Kursawe R, D'Adamo E, Dykas DJ, Zhang CK, Bale AE, Calí AM, Narayan D, Shaw MM, Pierpont B. et al. A common variant in the patatin-like phospholipase 3 gene (PNPLA3) is associated with fatty liver disease in obese children and adolescents. Hepatology. 2010;52(4):1281–1290. doi: 10.1002/hep.23832. [DOI] [PMC free article] [PubMed] [Google Scholar]
- Sevastianova K, Kotronen A, Gastaldelli A, Perttilä J, Hakkarainen A, Lundbom J, Suojanen L, Orho-Melander M, Lundbom N, Ferrannini E. et al. Genetic variation in PNPLA3 (adiponutrin) confers sensitivity to weight loss-induced decrease in liver fat in humans. Am J Clin Nutr. 2011;94(1):104–111. doi: 10.3945/ajcn.111.012369. [DOI] [PubMed] [Google Scholar]
- Kantartzis K, Peter A, Machicao F, Machann J, Wagner S, Königsrainer I, Königsrainer A, Schick F, Fritsche A, Häring HU. et al. Dissociation between fatty liver and insulin resistance in humans carrying a variant of the patatin-like phospholipase 3 gene. Diabetes. 2009;58(11):2616–2623. doi: 10.2337/db09-0279. [DOI] [PMC free article] [PubMed] [Google Scholar]
- Wang CW, Lin HY, Shin SJ, Yu ML, Lin ZY, Dai CY, Huang JF, Chen SC, Li SS, Chuang WL. The PNPLA3 I148M polymorphism is associated with insulin resistance and nonalcoholic fatty liver disease in a normoglycaemic population. Liver Int. 2011;31(9):1326–1331. doi: 10.1111/j.1478-3231.2011.02526.x. [DOI] [PubMed] [Google Scholar]
- Krawczyk M, Gruenhage F, Mahler M, Tirziu S, Acalovschi M, Lammert F. The common adiponutrin variant p.I148M does not confer gallstone risk but affects fasting glucose and triglyceride levels. J Physiol Pharmacol. 2011;62(3):369–375. [PubMed] [Google Scholar]
- Valenti L, Rumi M, Galmozzi E, Aghemo A, Del Menico B, De Nicola S, Dongiovanni P, Maggioni M, Fracanzani AL, Rametta R. et al. Patatin-like phospholipase domain-containing 3 I148M polymorphism, steatosis, and liver damage in chronic hepatitis C. Hepatology. 2011;53(3):791–799. doi: 10.1002/hep.24123. [DOI] [PubMed] [Google Scholar]
- Cai T, Dufour JF, Muellhaupt B, Gerlach T, Heim M, Moradpour D, Cerny A, Malinverni R, Kaddai V, Bochud M. et al. Viral genotype-specific role of PNPLA3, PPARG, MTTP, and IL28B in hepatitis C virus-associated steatosis. J Hepatol. 2011;55(3):529–535. doi: 10.1016/j.jhep.2010.12.020. [DOI] [PubMed] [Google Scholar]
- Trépo E, Pradat P, Potthoff A, Momozawa Y, Quertinmont E, Gustot T, Lemmers A, Berthillon P, Amininejad L, Chevallier M. et al. Impact of patatin-like phospholipase-3 (rs738409 C > G) polymorphism on fibrosis progression and steatosis in chronic hepatitis C. Hepatology. 2011;54(1):60–69. doi: 10.1002/hep.24350. [DOI] [PubMed] [Google Scholar]
- Corradini SG, Burza MA, Molinaro A, Romeo S. Patatin-like phospholipase domain containing 3 sequence variant and hepatocellular carcinoma. Hepatology. 2011;53(5):1776–1777. doi: 10.1002/hep.24244. author reply 1777. [DOI] [PubMed] [Google Scholar]
- Lagging M, Langeland N, Pedersen C, Farkkila M, Buhl MR, Morch K, Dhillon AP, Alsio A, Hellstrand K, Westin J. et al. Randomized comparison of 12 or 24 weeks of peginterferon alpha-2a and ribavirin in chronic hepatitis C virus genotype 2/3 infection. Hepatology. 2008;47(6):1837–1845. doi: 10.1002/hep.22253. [DOI] [PubMed] [Google Scholar]
- Bendtsen P, Karlsson N, Dalal K, Nilsen P. Hazardous Drinking Concepts, Limits and Methods: Low Levels of Awareness, Knowledge and Use in the Swedish Population. Alcohol Alcohol. 2011;46(5):638–645. doi: 10.1093/alcalc/agr065. [DOI] [PubMed] [Google Scholar]
- DeFronzo RA, Tobin JD, Andres R. Glucose clamp technique: a method for quantifying insulin secretion and resistance. Am J Physiol. 1979;237(3):E214–E223. doi: 10.1152/ajpendo.1979.237.3.E214. [DOI] [PubMed] [Google Scholar]
- Bonora E, Targher G, Alberiche M, Bonadonna RC, Saggiani F, Zenere MB, Monauni T, Muggeo M. Homeostasis model assessment closely mirrors the glucose clamp technique in the assessment of insulin sensitivity: studies in subjects with various degrees of glucose tolerance and insulin sensitivity. Diabetes Care. 2000;23(1):57–63. doi: 10.2337/diacare.23.1.57. [DOI] [PubMed] [Google Scholar]
- Eslam M, Kawaguchi T, Del Campo JA, Sata M, Khattab MA, Romero-Gomez M. Use of HOMA-IR in hepatitis C. J Viral Hepat. 2011;18(10):675–684. doi: 10.1111/j.1365-2893.2011.01474.x. [DOI] [PubMed] [Google Scholar]
- Matthews DR, Hosker JP, Rudenski AS, Naylor BA, Treacher DF, Turner RC. Homeostasis model assessment: insulin resistance and beta-cell function from fasting plasma glucose and insulin concentrations in man. Diabetologia. 1985;28(7):412–419. doi: 10.1007/BF00280883. [DOI] [PubMed] [Google Scholar]
- Ishak K, Baptista A, Bianchi L, Callea F, De Groote J, Gudat F, Denk H, Desmet V, Korb G, MacSween RN. Histological grading and staging of chronic hepatitis. J Hepatol. 1995;22(6):696–699. doi: 10.1016/0168-8278(95)80226-6. [DOI] [PubMed] [Google Scholar]
- Kollerits B, Coassin S, Beckmann ND, Teumer A, Kiechl S, Döring A, Kavousi M, Hunt SC, Lamina C, Paulweber B. et al. Genetic evidence for a role of adiponutrin in the metabolism of apolipoprotein B-containing lipoproteins. Hum Mol Genet. 2009;18(23):4669–4676. doi: 10.1093/hmg/ddp424. [DOI] [PMC free article] [PubMed] [Google Scholar]
- Romeo S, Sentinelli F, Cambuli VM, Incani M, Congiu T, Matta V, Pilia S, Huang-Doran I, Cossu E, Loche S. et al. The 148 M allele of the PNPLA3 gene is associated with indices of liver damage early in life. J Hepatol. 2010;53(2):335–338. doi: 10.1016/j.jhep.2010.02.034. [DOI] [PubMed] [Google Scholar]
- Marchesini G, Brizi M, Bianchi G, Tomassetti S, Bugianesi E, Lenzi M, McCullough AJ, Natale S, Forlani G, Melchionda N. Nonalcoholic fatty liver disease: a feature of the metabolic syndrome. Diabetes. 2001;50(8):1844–1850. doi: 10.2337/diabetes.50.8.1844. [DOI] [PubMed] [Google Scholar]
- Kotronen A, Yki-Järvinen H. Fatty liver: a novel component of the metabolic syndrome. Arterioscler Thromb Vasc Biol. 2008;28(1):27–38. doi: 10.1161/ATVBAHA.107.147538. [DOI] [PubMed] [Google Scholar]
- Chitturi S, Abeygunasekera S, Farrell GC, Holmes-Walker J, Hui JM, Fung C, Karim R, Lin R, Samarasinghe D, Liddle C. et al. NASH and insulin resistance: Insulin hypersecretion and specific association with the insulin resistance syndrome. Hepatology. 2002;35(2):373–379. doi: 10.1053/jhep.2002.30692. [DOI] [PubMed] [Google Scholar]
- Marchesini G, Bugianesi E, Forlani G, Cerrelli F, Lenzi M, Manini R, Natale S, Vanni E, Villanova N, Melchionda N. et al. Nonalcoholic fatty liver, steatohepatitis, and the metabolic syndrome. Hepatology. 2003;37(4):917–923. doi: 10.1053/jhep.2003.50161. [DOI] [PubMed] [Google Scholar]
- Seppälä-Lindroos A, Vehkavaara S, Häkkinen AM, Goto T, Westerbacka J, Sovijärvi A, Halavaara J, Yki-Järvinen H. Fat accumulation in the liver is associated with defects in insulin suppression of glucose production and serum free fatty acids independent of obesity in normal men. J Clin Endocrinol Metab. 2002;87(7):3023–3028. doi: 10.1210/jc.87.7.3023. [DOI] [PubMed] [Google Scholar]
- Thomssen R, Bonk S, Propfe C, Heermann KH, Köchel HG, Uy A. Association of hepatitis C virus in human sera with beta-lipoprotein. Med Microbiol Immunol. 1992;181(5):293–300. doi: 10.1007/BF00198849. [DOI] [PubMed] [Google Scholar]
- André P, Komurian-Pradel F, Deforges S, Perret M, Berland JL, Sodoyer M, Pol S, Bréchot C, Paranhos-Baccalà G, Lotteau V. Characterization of low- and very-low-density hepatitis C virus RNA-containing particles. J Virol. 2002;76(14):6919–6928. doi: 10.1128/JVI.76.14.6919-6928.2002. [DOI] [PMC free article] [PubMed] [Google Scholar]
- Huang H, Sun F, Owen DM, Li W, Chen Y, Gale M, Ye J. Hepatitis C virus production by human hepatocytes dependent on assembly and secretion of very low-density lipoproteins. Proc Natl Acad Sci USA. 2007;104(14):5848–5853. doi: 10.1073/pnas.0700760104. [DOI] [PMC free article] [PubMed] [Google Scholar]
- He S, McPhaul C, Li JZ, Garuti R, Kinch L, Grishin NV, Cohen JC, Hobbs HH. A sequence variation (I148M) in PNPLA3 associated with nonalcoholic fatty liver disease disrupts triglyceride hydrolysis. J Biol Chem. 2010;285(9):6706–6715. doi: 10.1074/jbc.M109.064501. [DOI] [PMC free article] [PubMed] [Google Scholar]
Associated Data
This section collects any data citations, data availability statements, or supplementary materials included in this article.
Supplementary Materials
Table S1. Genotype and allele frequencies of the PNPLA3 I148M sequence variant in HCV genotype 2 and 3 individuals.