

Abstract
In this study we propose a new feature extraction algorithm, dNMF (discriminant non-negative matrix factorization), to learn subtle class-related differences while maintaining an accurate generative capability. In addition to the minimum representation error for the standard NMF (non-negative matrix factorization) algorithm, the dNMF algorithm also results in higher between-class variance for discriminant power. The multiplicative NMF learning algorithm has been modified to cope with this additional constraint. The cost function was carefully designed so that the extraction of feature coefficients from a single testing pattern with pre-trained feature vectors resulted in a quadratic convex optimization problem in non-negative space for uniqueness. It also resolves issues related to the previous discriminant NMF algorithms. The developed dNMF algorithm has been applied to the emotion recognition task for speech, where it needs to emphasize the emotional differences while de-emphasizing the dominant phonetic components. The dNMF algorithm successfully extracted subtle emotional differences, demonstrated much better recognition performance and showed a smaller representation error from an emotional speech database.
Keywords: Discriminant feature, Feature extraction, NMF, LDA, Emotional speech
Introduction
Human perception of audio and visual sensory signals incorporates feature extraction at an early stage and classification at a later stage. The extraction of meaningful and robust features makes the classification task much easier. Therefore, almost all man-made pattern recognition systems also have two stages: feature extraction and classification. The feature extraction stage involves either analysis or learning. Gabor filters and MFCC (mel-frequency cepstral coefficient) belong to the former, while the latter includes PCA (principal component analysis), ICA (independent component analysis), and NMF (non-negative matrix factorization). It is interesting to note that ICA results in similar features to those extracted from our brain, i.e. edge filters for vision (Bell and Sejnowski 1997), spectral filters for the cochlea (Lee et al. 2002; Lewicki 2002), and spectro-temporal patterns in the inferior colliculus and auditory cortex (Kim and Lee 2005). For non-negative data, NMF extracts efficient part-based features for easy interpretation (Lee and Seung 1999). PCA is also used in combination with other information-theoretic measures (Wang et al. 2010). However, these unsupervised learning algorithms do not utilize class labels and are not optimized for the classification task at the latter stage.
The optimum features depend upon the classification task (Long et al. 2011). For example, speech recognition relies on the classification of phonemes while neglecting speaker-dependent and emotion-dependent components. On the other hand, emotion recognition in speech needs to amplify the subtle differences between emotional speeches while neglecting the phonemes and speaker-dependent components (Ververidisa and Kotropoulos 2006). In this context LDA (linear discriminant analysis) and CSP (common spatial patterns) have found that discriminant features are better for classification performance, but the effective number of extracted features is smaller than the number of classes and subject to overfitting to training data (Martinez and Kak 2001; Zhao et al. 2010).
Recently, by adding discriminant terms to the cost function, semi-supervised learning algorithms have been developed to improve the discriminant power of ICA (Dhir and Lee 2011) and NMF features (Wang et al. 2005; Zafeiriou et al. 2006; Kotsia et al. 2007). If the number of features is less than the number of data dimensions, ICA-based algorithms have difficulty accurately regenerating the original data from the extracted feature coefficients. Also, NMF is more suitable than ICA for non-negative data, but the reported discriminant non-negative matrix factorization (DNMF) algorithms do not directly utilize the extracted feature coefficients for classification. In this paper we present a new dNMF algorithm which simultaneously maximizes the Fisher linear discriminant and minimizes the NMF cost function. The developed dNMF algorithm is free from many of the problems shown by previous DNMF algorithms, and is a natural extension of the standard NMF algorithm with both generative and discriminant power.
The developed dNMF algorithm was first tested on a simple toy problem with known discriminant features, and was then applied to emotion recognition in human speech. The recognition of human emotion is an important component for efficient human–computer interactions. However, the primary information in human speech is phonetic, and the speaker-dependent and emotion-dependent information is minor. The unsupervised learning algorithms have a tendency to extract features with a larger magnitude, and are not suitable for the extraction of subtle differences such as the emotional content in speech. Therefore, the features for language-independent emotion recognition are difficult to extract and are still under intensive study.
The popular speech features for emotional recognition include fundamental frequency (pitch), formants, MFCC, and energy (Slaney and McRoberts 2003; Lin and Wei 2005). Features based on manifold learning (You et al. 2006) and the Teager energy operator (Zhou et al. 2001) are also used. However, a large number of features are required for good recognition performance. For example, the AIBO team came out with a large set of 200 features from an intensity and pitch time series (Oudeyer 2003). However, these have many redundant features and therefore are not ideal for this problem (Kim et al. 2009). The developed dNMF algorithm successfully demonstrated the extraction of subtle emotional differences and resulted in a better recognition performance.
Issues with using the NMF algorithm for classification
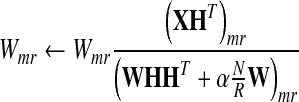
Non-negative matrix factorization (NMF) algorithm learns a factorization represenation of a non-negative matrix X into two non-negative matrices as X = WH. Here, X and H are an M × N matrix of the training data and an R × N matrix of feature coefficients, respectively, and each column denotes one sample. W is an M × R matrix, of which each column denotes one feature basis vector. Also, M, N, and R denote the number of data dimensions, the number of data samples, and the number of feature vectors, respectively. All elements of W, H, and W must be equal to or >0. With the linear summation of non-negative values the NMF algorithm usually learns a part-based additive representation of non-negative sensory data such as images and time–frequency spectrogram (Lee and Seung 1999).
The standard NMF algorithm learns generative features by unsupervised learning without the class label information. However, there are two problems to overcome in order to achieve high classification accuracy with these features. Firstly, like other unsupervised learning algorithms, NMF does not utilize class label information from the training data and therefore does not have high discriminant power. Secondly, the learned feature vectors (columns of W) are not orthogonal to each other and it is not straightforward to extract feature coefficients H for test data even with given feature vectors.
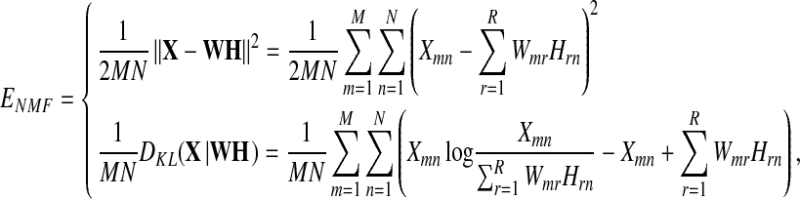
To overcome the first problem, DNMF algorithms have recently been reported that combine NMF and LDA (Wang et al. 2005; Zafeiriou et al. 2006; Kotsia et al. 2007). The new cost function to minimize for the feature learning consists of two parts: the representation error of the standard NMF and the discriminant power terms of LDA. As usual, other terms may be added for sparsity. The resulting cost function E is written as
 |
1 |
where ENMF, ED, EHS, and EWS denote the terms for NMF representation error, discriminant power, H-, and W-sparsity, respectively. Here, H and W are matrices consisting of the feature vectors and their coefficients, respectively. Also, λ, α, and β denote relative weighting factors. One of two forms is usually used for the representation error as (Lee and Seung 1999)
 |
2a, b |
where the first and second forms are based on Euclidean distance and Kullback–Leibler divergence between the training data X and represented data WH, respectively. Recently, nonlinear extensions of (1) have been proposed (Yang and Oja 2010; Zafeiriou and Petrou 2010).
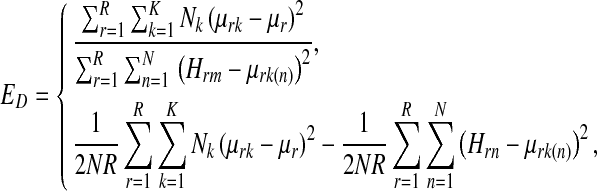
Two forms have also been used for the discriminant term as (Wang et al. 2005; Zafeiriou et al. 2006; Kotsia et al. 2007; Kim et al. 2009)
 |
3a, b |
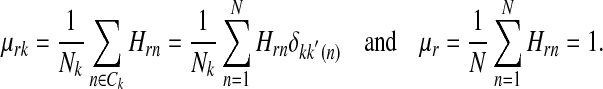
where the first form is a Fisher discriminant of the ratio of between-class variance to within-class variance, and the second form is its simpler variant. The mean coefficients of the kth class and of all samples for the rth feature are defined as
 |
4 |
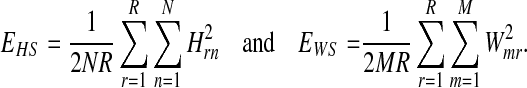
Here, Ck is a set of sample indices for the kth class, k(n) is the class index of the nth sample, and δ is Kronecker delta. Also, K and Nk denote the number of classes and the number of samples in the kth class, respectively. The sparsity terms are written as (Hoyer 2004)
 |
5 |
The second problem comes from the non-orthogonality of the feature vectors. At the feature extraction phase, one needs to calculate a feature coefficient vector h for a single test vector x with a given feature matrix W obtained during the feature learning phase. If the Euclidean distance is used for the representation error and the error becomes sufficiently small during the training phase, one may obtain h by solving a matrix equation, i.e.,
 |
6 |
In the literature (Wang et al. 2005; Zafeiriou et al. 2006) the following two methods have been used:
 |
7a |
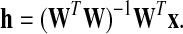 |
7b |
The matrix transpose method (7a) is exact only for orthogonal basis vectors. Although the sparsity constraint on W may result in near-orthogonal basis vectors, it usually causes big errors on the calculated h. The matrix pseudo-inverse method (7b) results in a minimum error solution. However, the non-negativity of h is not guaranteed. The standard NMF updating rule for H with a fixed W had not been used for the solution. It is well known that the NMF algorithm may not converge to a unique solution (Laurberg et al. 2008), and this can cause a serious problem for classification tasks.
Unfortunately the addition of extra terms in (1) for discriminant features makes the second problem more serious. Equation (6) is no longer an appropriate solution to minimize (1), and (7a, b) may cause bigger errors even for training data. To resolve this problem the discriminant term in (3a, b) was also defined for WTX, not for the H (Kotsia et al. 2007). However, it is natural to utilize the feature coefficients H of part-based representation for the classification. In the following section we present a new method that resolves this problem.
A new discriminant NMF (dNMF) algorithm
In this section we describe a new dNMF algorithm which maximizes discriminant performance while maintaining the representation capability. It shares the same philosophy with the recent DNMF (Zafeiriou et al. 2006; Kotsia et al. 2007) or Fisher NMF (FNMF) (Wang et al. 2005) algorithms that combine NMF and LDA. However, the proposed dNMF algorithm resolves several important problems shown by DNMF and FNMF. Unlike the previous algorithms, we maintain the part-based representation of the NMF algorithm and only make slight modifications for the discriminant performance, and use a lower character ‘d’ in the name.
For the proposed dNMF algorithm the cost function is still written as (1). However, to compare with previous algorithms, two distinct points need be mentioned. First, we prefer to use Euclidean distance (3a, b) instead of Kullback–Leibler divergence for the representation error. Secondly, only the between-class variance, i.e., the first term in (3a, b), is used instead of the Fisher discriminant or the difference between the two variances. The cost function has fourth-order polynomials of unknown W and H, and the uniqueness of the solution is not guaranteed at the training phase. However, it is still important to have unique solution at the test phase. With a given W, unless λ becomes too large, the resulting cost function becomes a quadratic convex function of H. The cost function may become concave for very large λ values. Even with the non-negative constraint it still has only one minimum, therefore it has a unique solution of feature coefficients for a test vector. Of course the updating rule needs be designed carefully for the unique convergence in the non-negative subspace. Although uniqueness is not guaranteed at the feature learning phase, uniqueness of the extracted features at the latter extraction phase is much more important for classification tasks. Also, the calculation of within-class variance requires the class label which is not provided for the test data. Therefore, by removing the within-class variance term, one can reduce the mismatch between the cost functions at the feature learning and feature extraction phases. The effect of the still-remaining between-class variance term for the test data will be discussed latter.
Unlike the standard NMF (Lee and Seung 1999) and recent discriminant versions (Wang et al. 2005; Zafeiriou et al. 2006; Kotsia et al. 2007), we normalize H instead of W. Since the discriminant function is defined in terms of the feature coefficients H, it is important to scale H properly. Also, with the proper scaling of H, the maximization of the between-class variance may naturally minimize the within-class variance.
Now the steepest-descent learning algorithm becomes
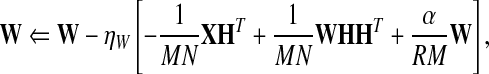 |
8a |
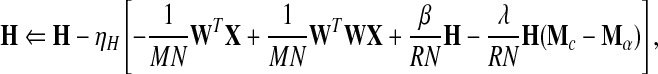 |
8b |
where the averaging matrices Ma over all samples and Mc for each class are defined as
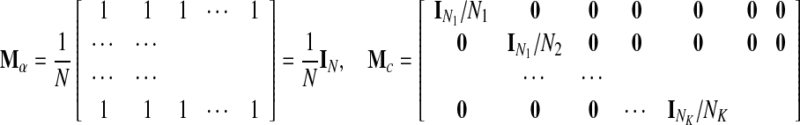 |
9 |
Here IN is an N × N matrix for which all elements are 1, and 0 is a matrix with all 0 elements of appropriate size. Ni denotes the number of learning samples in the ith class. By properly choosing learning rates ηW and ηH, one obtains multiplicative update rules as
 |
10a |
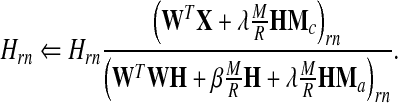 |
10b |
Here (·)mr denotes the rth element of mth column of a matrix. Then, the normalization of H, i.e.,
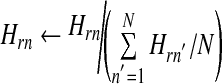 |
11 |
also results in HMa = IN. These include slight changes from the original multiplicative learning rule for the sparsity and discriminant power.
During the feature extraction phase we used a fixed feature matrix W obtained during the feature learning phase, and calculated h for each test vector x separately. Therefore, the between-class variance term could not be used. However, with a small λ value, one may neglect the second term in (1). The resulting update rule for each test vector h is now given as
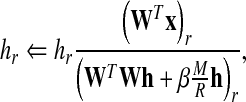 |
12 |
which is basically the same as that of standard NMF with a sparsity constraint.
The mismatch between the cost functions of the feature learning and feature extraction phases naturally results in differences between h values even for the same training vectors. One may turn this difficulty into an advantage. For the same training data X, due to the discriminant term, the learning rule (10a, b) results in a higher Fisher discriminant value than that of (12). During the learning one may check Fisher discriminant values of the learned data by (12) and stop the learning process at the highest value. To avoid overfitting, it is common practice to check the performance on a separate validation database and stop learning process. In the proposed scheme we used the same database, but a different performance measure could be used for the validation. To reduce mismatches between the training and test data classifiers should be trained with the feature coefficients obtained by (12), not by (10a, b).
The utilization of (12) for the feature extraction requires uniqueness of the converged feature coefficients h’s. The cost function (1) with a small or zero λ and a fixed W is a convex quadratic function, which has a unique minimum point. As shown in Fig. 1, only one minimum point (‘●’) exists even in non-negative subspace. Therefore, a gradient-based minimization algorithm is most likely to find the minimum point. However, there is one possible problem. If one of the non-zero coefficients accidently becomes zero, the multiplicative rule (12) has difficulty in recovering. The cross (‘x’) points in Fig. 1a, b show this cases. As shown by the dotted line in Fig. 1b, we try to avoid this issue by initializing far from zero and allowing only small changes for each update. At each update we calculate the difference between the previous and new costs. If the cost decreases faster than a certain threshold, we move the new position to the middle of the previous position and new-position-to-be as
 |
13 |
Fig. 1.

Equal-contour lines and gradient-descent searches for quadratic convex minimization problems. a The original minimum is located in the non-negative space; b the original minimum has one negative value; c the original minimum has two negative values. The circle represents the minimum position in non-negative space, while the cross symbol represents possible false convergence points
It is equivalent to reduce the learning rate by a half. Another popular method for NMF is to use the pseudo-inverse (7b) and project into non-negative subspace by setting all negative values to 0. Although this projection method is computationally efficient, especially for a small number of features, it may fail to converge to the minimum point (‘●’) and result in too many zeros (‘x’) as shown in Fig. 1c. Therefore, we cannot use the projection method for classification tasks.
Table 1 summarizes the new dNMF algorithm in regard to classification tasks, and Table 2 compares it with previous DNMF algorithms. The proposed dNMF has minimal mismatch between h-update rules for both feature learning and feature extraction phases. Also, the feature extraction rule guarantees a unique solution from a fixed feature vectors W for a quadratic convex optimization problem. On the other hand, the DNMF and CSDNMF result in different feature coefficient vector h’s from feature learning and feature extraction rules even for the same data. Therefore, the maximization of discriminant power at the DNMF learning phase does not correspond to the maximization at the feature extraction phase. The PGDNMF solves this problem by introducing another vector h′ = WTx for the discriminant measure (Kotsia et al. 2007). However, the new vector h′ is no longer interpretable as feature coefficients of the part-based representation. The other main difference comes from the normalization in the feature learning phase. Since the discriminant term for the cost function is represented by the feature coefficient H, it is natural to normalize H instead of W. With the H-normalization all features have an equal contribution to the overall discriminant measure through the between-class variance (and also within-class variance), while W-normalization will assign higher weights to the features with larger H values. Therefore, the maximization of discriminant power will be dominated by stronger features and the subtle difference may not be learned.
Table 1.
Pseudo-code for the developed dNMF feature learning and classifier training
| Feature learning phase |
| Obtain training data X and their class labels, and randomly initialize W and H |
| Do until convergence |
| Update W and H by (10a, b) and normalize H by (11) for a certain number of epochs |
| Update h’s for each column of X with a fixed W by (12) until convergence |
| Calculate Fisher discriminant value from h’s for the validation |
| End loop |
| Classifier training phase |
| Train a classifier with h’s obtained during the feature learning phase |
| Classifier testing phase |
| Obtain test data X′, and randomly initialize h’s |
| Update h’s for each column of X′ with the obtained W by (12) until convergence |
| Test the classifier |
Table 2.
Comparison of proposed dNMF with previous discriminant NMF algorithms
| Algorithm | Feature learning phase | Feature extraction phase | |||
|---|---|---|---|---|---|
| Representation error | Discriminant power | W and H update rules | Normalization | h Update rule | |
| LNMF (Wang et al. 2005) | KL-divergence | (Sb − Sw) of H | Multiplicative | Column of W | Not explained |
| DNMF/CSDNMF (Zafeiriou et al. 2006) | KL-divergence | (Sb − Sw) of H | Fixed point | Column of W | WTx or W+x |
| PGDNMF (Kotsia et al. 2007) | KL-divergence | (Sb − Sw) of WTx | Projected gradient | Column of W | WTx |
| Previous dNMF (Kim et al. 2009) | Euclidean distance | Sb/Sw of H | Gradient | Column of W | Gradient update of h |
| dNMF (proposed) | Euclidean distance | Sb of H | Multiplicative | Row of H | Multiplicative update of h |
Discriminant features for simulated music classification
The developed dNMF algorithm was first tested for simulated music classification problems, for which the discriminant features are known. A total of 16 basic music samples were generated with four types of temporal amplitude modulation, two types of harmonic structure (all harmonics and odd harmonics only), and two types of fine spectro-temporal structure (with and without pitch modulation). Figure 2a shows four temporal amplitude modulated signals in time, and Fig. 2b shows 16 basic spectrograms. Then, random noises were added generating a total of 1,200 samples.
Fig. 2.

Basic simulated music data. a Time-dependent waveforms of four temporal modulation classes; b spectrograms of 16 simulated music datasets with four amplitude modulation types, two harmonic structures, and two fine spectro-temporal patterns (with and without pitch modulation)
Figure 3a–c show extracted features for three different classification tasks from the same data, i.e. classifications by temporal amplitude modulation, with/without pitch modulation, and with/without even harmonics, respectively. All three cases demonstrated the extraction of discriminant features for the specific classification tasks, i.e., temporal amplitude components in (a), pitch vibration in (b), and even and odd harmonics in (c). Even when the number of features was set incorrectly, as shown in Fig. 3d, the dNMF algorithm successfully extracted the discriminant features. It is interesting to note that even though the dNMF algorithm tried to increase discriminant power, some features were not particularly discriminant. This is due to the fact that all features need to form a complete set for data representation, which may require some common features.
Fig. 3.

Feature patterns extracted by dNMF. a Four features for temporal amplitude modulation classification; b two features for simple versus vibrato classification; c two features for all harmonics versus odd harmonics only; d three features for all harmonics versus odd harmonics only
Mismatch between the feature learning and feature extraction phases
We also extracted discriminant features from ORL face image database (http://www.cam-orl.co.uk) and showed the mismatch between the feature coefficients obtained during the feature learning phase and feature extraction phase. The ORL database has 40 classes (persons) and 10 facial images were taken at different times for each person. Each image has 28 × 23 pixels and was transformed into 1-D vector.
In Fig. 4 the Fisher discriminant values are plotted as functions of learning epoch during the learning phase of 10 features. Here parameters in (1) are set as λ = 0.0004, α = 0 and β = 0. However, data with other parameter values show similar tendency. The blue triangles (Δ) show the Fisher linear discriminant values during the learning by (10a, b) and (11). At every 500 learning epochs we fixed the feature vectors W and updated only the feature coefficients H until convergence by (12). The resulting H may be used for the classifiers in the dNMF algorithm and shown as red circles (o). Also, equation (7b) may be used in DNMF algorithm for the feature coefficients H and shown as green stars (*). Even with the same data X, there exist differences between the extracted feature coefficients. Although the supervised extraction of H with the class label information is possible for the classifier training stage, the class label information is not available during the test stage. Therefore, it is better to use the same formula, i.e., (12) or (7b), for both the classifier training and testing. Although both extracted feature coefficients with (12) and (7b) show smaller Fisher discriminant values than those at the feature learning phase (10a, b), the proposed dNMF update rule (12) results in higher Fisher discriminant values and smaller distortion from the learned features during the feature learning phase than the DNMF rule (7b).
Fig. 4.

Fisher discriminant values for ORL face image database
Emotion recognition from speech
To test the performance of the proposed dNMF algorithm for classification tasks we chose a speech emotion recognition task. Since the dominant information in speech is phonetic, feature extraction algorithms usually extract phonetic features. The emotion-dependent signal is much weaker than the phonetic signal, and it is very important to extract these weaker emotional features for the emotion classification task. Therefore, it is an excellent test problem for discriminant feature extraction algorithms.
We used the Berlin emotional speech database developed by the Technical University of Berlin (Burkhardt et al. 2005). Ten actors (five females and five males) spoke ten German utterances (five short and five longer sentences) with seven different emotions. The emotional states were defined as neutral, happy, angry, sad, boredom, fear, and disgust. In total, 535 utterances were recorded with a 48 kHz sampling frequency that was later downsampled to 16 kHz. We randomly divided the database into a test set of 424 utterances for the training and 111 utterances for the testing.
As the baseline, we used 200 raw prosodic features implemented by the AIBO team with an excellent emotion recognition performance (Oudeyer 2003). This is a bottom-up approach using an extensive feature set of low level statistics of prosodic parameters. The features were based on five time series, i.e. intensity, lowpassed intensity, highpassed intensity, pitch, and MFCCs. Next, four series were derived from each time series, i.e. minima, maxima, duration between local extremes, and the series itself. Finally ten statistical measures, i.e., mean, variance, maximum, minimum, median, first quartile, range, third quartile, between quartile range, and mean absolute local derivatives, were estimated from each of the twenty derived series. Therefore, 200 (5 × 4 × 10) raw features were extracted from each speech utterance. Many of the raw features are highly correlated each other, and therefore an efficient dimension reduction may be advantageous.
In Figs. 5 and 6 we show the results of ten features with λ = 0.002 as a typical example. Also, for a fair comparison, α and β are set to zero for both the standard NMF and the proposed dNMF. The results of the other cases show a similar trend. In Fig. 5 both the Fisher discriminant values and the representation error are plotted during the feature learning phase. Figure 5a shows basically the same information with Fig. 4 on different data. However, the horizontal axis is not the learning epoch. To understand the effects of mismatch between the feature learning and feature extraction rules, in Fig. 5a we show the Fisher discriminant values from re-calculated feature coefficients H as functions of the Fisher discriminant value during the feature learning. We paused the dNMF learning at certain Fisher values (from 1 to 5 with 0.5 intervals) and validated the features W by re-calculating the feature coefficients H without the label information. The re-calculation was made by four methods, i.e., 3 variants of dNMF updates (the matrix transpose method in (7a), the matrix pseudo-inverse method in (7b) with and without non-negative projection) and the proposed dNMF updates in (12). Figure 5a shows the re-calculated Fisher discriminant values, which are much smaller than those obtained during dNMF feature learning with class label information. It clearly shows the effect of a mismatch between the feature learning and feature extraction rules. With higher Fisher discriminant values during the dNMF training, the contribution of the discriminant term λED on the total cost E in (1) becomes higher, which causes greater differences between the two features. Actually, the re-calculation of H without the class labels resulted in smaller between-class variance of feature coefficients and smaller Fisher discriminant values. This trend becomes stronger with higher Fisher discriminant values. However, the proposed dNMF updates still resulted in higher discriminant values than the other methods. As the dNMF-updated Fisher value increases, the re-calculated Fisher values increase and then decrease. This may be understood as overfitting, and one may stop the dNMF learning at this peak.
Fig. 5.

a Re-calculated Fisher discriminant values and b representation errors at different stages of dNMF learning. The feature learning phase is discredited by the Fisher discriminant value during the dNMF learning. The re-calculated Fisher discriminant values and representation errors were obtained using the same training data X and feature vectors W, but different calculation algorithms were used for the feature coefficients H
Fig. 6.

Separate evaluation of Fisher discriminant values for each feature. a PCA feature coefficients; b LDA feature coefficients; c NMF feature coefficients; d dNMF feature coefficients with (10a, b) and (12) at the feature learning phase; e dNMF feature coefficients with (12) at the feature extraction phase
As shown in Fig. 5b, the transposed matrix method resulted in unacceptably high representation error and a small Fisher discriminant value. Even at a very small Fisher discriminant value of 0.5, the representation errors of the other methods had already converged to a small enough value and did not change much during the latter fine-tuning stage for the other methods. However, the non-negative projected pseudo-inverse method resulted in a relatively higher representation error, especially with high Fisher discriminant values. The pseudo-inverse matrix was calculated for the minimum representation error and naturally the DNMF resulted in the smallest error. However, the extracted features showed lower discriminant power. The proposed dNMF algorithm provided excellent results with both small representation error and high discriminant values.
In Fig. 6a–e the Fisher discriminant values of each feature are shown separately. Here the discriminant values of dNMF features are compared with those of other popular feature extraction algorithms, i.e., PCA, LDA, and NMF, for the training data. Since the raw features are non-negative, the standard ICA algorithm is not straightforward to apply. First of all the discriminant values are quite different from feature to feature. Also, the discriminant values are highest with LDA, and those of PCA and NMF are lowest. The proposed dNMF algorithm results in slightly different feature coefficients during the feature learning by (10a, b) and feature extraction by (12) even with the same training data. The statistics for the test data are even more different. It is also worth noting that the feature coefficients for LDA are meaningful for the first six features only in the seven-class classification task.
For the recognition a support vector machine (SVM) was used as the classifier, with a one-versus-the-other tactic. The class with the maximum output value among the seven SVMs was regarded as the final decision. As shown in Fig. 7, PCA and NMF do not show high recognition rates up to 40 features. LDA results in good recognition rates even with 5–10 features only, but does not improve with more features. Also DNMF algorithm shows good performance with smaller number of features, but results in early saturation. The proposed dNMF algorithm improves recognition performance with more features. With only 40 dNMF features the recognition rate becomes similar or better than the black horizontal line that represents the recognition rate with all 200 AIBO features. These results agree with the theory presented in this paper, and also demonstrate the usefulness of the developed dNMF algorithm for discriminant features.
Fig. 7.

Recognition rates versus the number of features for the test data. With only 40 dNMF features the recognition rate becomes similar or better than the red horizontal line which represents all 200 AIBO features. (Color figure online)
Recently it had been reported that the combined prosodic and modulation frequency features resulted in about 87 % recognition rate for the Berlin database (Wu et al. 2011). More training samples and the speaker normalization had been incorporated for the high recognition rate. In this paper we use prosodic features only, and focus on the reduction of the number of features.
Conclusion and future research
In this paper we present a new dNMF algorithm, which maximizes both representation and discriminant power during the feature learning phase. The cost function and updating rules for both the feature learning and feature extraction phases have been carefully designed to overcome the problems shown by previous dNMF algorithms. Although slight differences still exist between feature coefficient update rules for the feature learning and the feature extraction, we found that the discriminant power of extracted features can be made higher by increasing the Fisher discriminant value during the dNMF learning. This learning process may incorporate the early stopping tactic by checking a discriminant value of the extracted feature coefficients. The dNMF algorithm also results in excellent recognition rates with a considerably smaller number of features, i.e., 40 compared to 200 used in the AIBO baseline. The dNMF algorithm is useful for classifying patterns based on subtle differences, not the primary information.
In future, we will work on algorithms that self-adjust the weighting parameters (λ, α, and β) in the cost function (1). The dNMF cost function consists of the representation error ENMF and the discriminant power ED. The optimum features may be extracted based on the tradeoff between the two cost terms by adjusting the weighting factor λ. The optimum weights for sparsity will also be investigated. Also, nonlinear and multilayer extension of the dNMF will be studied.
Acknowledgments
The main portion of this research was conducted while S. Y. Lee had visited RIKEN Brain Science Institute, Japan. This research was supported by the Korea Research Foundation Grant funded by the Korean Government (MOEHRD) (KRF-2008-013-D00091), and latter by Basic Science Research Program through the National Research Foundation of Korea (NRF) funded by the Ministry of Education, Science and Technology (2009-0092812 and 2010-0028722).
References
- Bell A, Sejnowski TJ. The “independent components” of natural scenes are edge filters. Vis Res. 1997;37(23):3327–3338. doi: 10.1016/S0042-6989(97)00121-1. [DOI] [PMC free article] [PubMed] [Google Scholar]
- Burkhardt F, Paeschke A, Rolfes M, Sendlmeier W, Weiss B. A database of German emotional speech. Proc Interspeech. 2005;2005:1517–1520. [Google Scholar]
- Dhir CS, Lee SY. Discriminant independent component analysis. IEEE Trans Neural Netw. 2011;22(6):827–845. doi: 10.1109/TNN.2011.2122266. [DOI] [PubMed] [Google Scholar]
- Hoyer PO. Non-negative matrix factorization with sparseness constraints. J Mach Learn Res. 2004;5:1457–1469. [Google Scholar]
- Kim T, Lee SY. Learning self-organized topology-preserving complex speech features at primary auditory cortex. Neurocomputing. 2005;65–66:793–800. doi: 10.1016/j.neucom.2004.10.076. [DOI] [Google Scholar]
- Kim D, Lee SY, Amari S. Representative and discriminant feature extraction based on NMF for emotion recognition in speech. Neural Inf Process LNCS. 2009;5863:649–656. doi: 10.1007/978-3-642-10677-4_74. [DOI] [Google Scholar]
- Kotsia I, Zafeiriou S, Pitas I. A novel discriminant non-negative matrix factorization algorithm with applications to facial image characterization problems. IEEE Trans Inf Forensics Secur. 2007;2(3):588–595. doi: 10.1109/TIFS.2007.902017. [DOI] [Google Scholar]
- Laurberg H, Christensen MG, Plumbley MD, Hansen LK, Jensen SH. Theorem of positive data: on the uniqueness of NMF. Comput Intell Neurosci. 2008;2008:704206. doi: 10.1155/2008/764206. [DOI] [PMC free article] [PubMed] [Google Scholar]
- Lee DD, Seung HS. Learning the parts of objects by non-negative matrix factorization. Nature. 1999;401:788–791. doi: 10.1038/44565. [DOI] [PubMed] [Google Scholar]
- Lee JH, Lee TW, Jung HY, Lee SY. On the efficient speech feature extraction based on independent component analysis. Neural Process Lett. 2002;15(3):235–245. doi: 10.1023/A:1015777200976. [DOI] [Google Scholar]
- Lewicki MS. Efficient coding of natural sounds. Nat Neurosci. 2002;5(4):356–363. doi: 10.1038/nn831. [DOI] [PubMed] [Google Scholar]
- Lin Y, Wei G. Speech emotion recognition based on HMM and SVM. Proc Fourth Int Conf Mach Learn Cybern. 2005;8:4898–4901. doi: 10.1109/ICMLC.2005.1527805. [DOI] [Google Scholar]
- Long J, Gu Z, Li Y, Yu T, Li F, Fu M. Semi-supervised joint spatio-temporal feature selection for P300-based BCI speller. Cogn Neurodyn. 2011;5:387–398. doi: 10.1007/s11571-011-9167-8. [DOI] [PMC free article] [PubMed] [Google Scholar]
- Martinez AM, Kak AC. PCA versus LDA. IEEE Trans Pattern Anal Mach Intell. 2001;23(2):228–233. doi: 10.1109/34.908974. [DOI] [Google Scholar]
- Oudeyer PY. The production and recognition of emotions in speech: features and algorithms. Int J Hum Comput Stud. 2003;59(1):157–183. doi: 10.1016/S1071-5819(02)00141-6. [DOI] [Google Scholar]
- Slaney M, McRoberts G. Baby ears: a recognition system for affective vocalizations. Speech Commun. 2003;39:367–384. doi: 10.1016/S0167-6393(02)00049-3. [DOI] [Google Scholar]
- Ververidisa D, Kotropoulos C. Emotional speech recognition: resources, features, and methods. Communications. 2006;48(9):1162–1181. [Google Scholar]
- Wang Y, Jia Y, Hu C, Turk M. Non-negative matrix factorization framework for face recognition. Int J Pattern Recogn Artif Intell. 2005;19(4):495–511. doi: 10.1142/S0218001405004198. [DOI] [Google Scholar]
- Wang C, Zou J, Zhang J, Wang M, Wang R. Feature extraction and recognition of epileptiform activity in EEG by combining PCA with ApEn. Cogn Neurodyn. 2010;4:233–240. doi: 10.1007/s11571-010-9120-2. [DOI] [PMC free article] [PubMed] [Google Scholar]
- Wu S, Falk T, Chan W. Automatic speech emotion recognition using modulation spectral features. Speech Commun. 2011;53(5):768–785. doi: 10.1016/j.specom.2010.08.013. [DOI] [Google Scholar]
- Yang Z, Oja E. Linear and nonlinear projective nonnegative matrix factorization. IEEE Trans Neural Netw. 2010;21(5):734–749. doi: 10.1109/TNN.2010.2041361. [DOI] [PubMed] [Google Scholar]
- You M, Chen C, Bu J, Liu J, Tao J (2006) Emotional speech analysis on nonlinear manifold. In: Proceedings of the 18th international conference on pattern recognition, vol 3, pp 91–94
- Zafeiriou S, Petrou M. Nonlinear non-negative component analysis algorithms. IEEE Trans Image Process. 2010;19(4):1050–1066. doi: 10.1109/TIP.2009.2038816. [DOI] [PubMed] [Google Scholar]
- Zafeiriou S, Tefas A, Buciu I, Pitas I. Exploiting discriminant information in nonnegative matrix factorization with application to frontal face verification. IEEE Trans Neural Netw. 2006;17(3):683–695. doi: 10.1109/TNN.2006.873291. [DOI] [PubMed] [Google Scholar]
- Zhao Q, Rutkowski M, Zhang L, Cichocki A. Generalized optimal spatial filtering using a kernel approach with application to EEG classification. Cogn Neurodyn. 2010;4:355–358. doi: 10.1007/s11571-010-9125-x. [DOI] [PMC free article] [PubMed] [Google Scholar]
- Zhou G, Hansen JHL, Kaiser JF. Nonlinear feature based classification of speech under stress. IEEE Trans Speech Audio Process. 2001;9:201–216. doi: 10.1109/89.905995. [DOI] [Google Scholar]