

Abstract
AIM
Vismodegib has demonstrated clinical activity in patients with advanced basal cell carcinoma. The pharmacokinetics (PK) of vismodegib are non-linear. The objective of this study was to determine whether vismodegib PK change following repeated dosing by administering a tracer intravenous (i.v.) dose of 14C-vismodegib with single and multiple oral doses.
METHODS
Healthy post menopausal female subjects (n= 6/group) received either a single or daily 150 mg vismodegib oral dose with a 14C-labelled 10 µg i.v. bolus dose administered 2 h after the single or last oral dose (day 7). Plasma samples were assayed for vismodegib by LC-MS/MS and for 14C-vismodegib by accelerator mass spectrometry.
RESULTS
Following a single i.v. dose, mean clearance, volume of distribution and absolute bioavailability were 43.4 ml h−1, 16.4 l and 31.8%, respectively. Parallel concentration–time profiles following single oral and i.v. administration of vismodegib indicated elimination rate limited PK. Following i.v. administration at steady-state, mean clearance and volume of distribution were 78.5 ml h−1 and 26.8 l, respectively. Comparison of i.v. PK parameters after single and multiple oral dosing showed similar half-life, increased clearance and volume of distribution (81% and 63% higher, respectively) and decreased bioavailability (77% lower) after repeated dosing. Relative to single dose, the unbound fraction of vismodegib increased 2.4-fold with continuous daily dosing.
CONCLUSION
Vismodegib exhibited a long terminal half-life after oral and i.v. administration, moderate absolute bioavailability and non-linear PK after repeated dosing. Results from this study suggest that the non-linear PK of vismodegib result from two separate, non-linear processes, namely solubility limited absorption and high affinity, saturable plasma protein binding.
Keywords: absolute bioavailability, clearance, GDC-0449, of distribution, vismodegib, volume
WHAT IS ALREADY KNOWN ABOUT THIS SUBJECT
While recent publications have suggested the pharmacokinetics (PK) of vismodegib appear to be non-linear, there has not been a report describing the mechanisms of non-linearity.
WHAT THIS STUDY ADDS
This study provides evidence that two separate processes, namely, solubility-limited absorption and concentration–dependent plasma protein binding, can explain the non-linear PK of vismodegib. This study provides quantitative results which can account for the lower than expected accumulation of vismodegib with continuous daily dosing.
Introduction
Vismodegib (Erivedge™, GDC-0449; Genentech, South San Francisco, CA, USA) is a first-in-class small molecule hedgehog pathway inhibitor that was recently approved in the United States for the treatment of advanced basal cell carcinoma (BCC). In a phase I study in patients with advanced or metastatic solid malignancies, vismodegib was well tolerated and anti-tumour activity was observed in patients with advanced BCC and medulloblastoma [1–3]. Vismodegib treatment provided significant clinical benefit in both locally advanced and metastatic BCC in a Pivotal Phase II study [4].
After a single oral dose, vismodegib demonstrates a unique pharmacokinetic (PK) profile, with sustained plasma concentrations and an estimated terminal half-life of approximately 12 days [5]. Following continuous once daily dosing, vismodegib PK appear to be non-linear, with steady-state plasma concentrations achieved much faster than expected (typically within 7 days of continuous daily dosing) and lower than expected accumulation (Figure 1) [6]. Non-linearity is also observed with respect to dose; increasing the daily dose from 150 mg to 270 or 540 mg does not result in higher steady-state plasma concentrations of vismodegib [1]. Furthermore, plasma concentrations of vismodegib are strongly correlated with α1-acid glycoprotein (AAG) concentrations, showing parallel fluctuations of AAG and total drug concentrations over time with consistently low unbound drug concentrations [6]. These unusual PK properties result from two separate, non-linear processes: solubility limited absorption and high affinity, saturable plasma protein binding. Non-linear absorption is related to the poor solubility of vismodegib at physiologic pH, resulting in less than dose proportional increases in exposure for doses greater than 150 mg. Another process contributing to the non-linearity observed for vismodegib after multiple dosing is saturable binding to AAG. Vismodegib binds to both AAG and human serum albumin (HSA), but with higher affinity to AAG [7]. Due to its high concentration in plasma, HSA serves as a low affinity, high capacity drug binding protein relative to AAG. Therefore, the fraction unbound for vismodegib is believed to be dependent on AAG saturation which occurs as the concentration of vismodegib increases with repeated daily dosing and this affects the equilibrium with HSA [7]. The non-linearity in vismodegib PK after multiple dosing can be explained by the three-fold increase in vismodegib fraction unbound at steady-state compared with a single dose [8].
Figure 1.
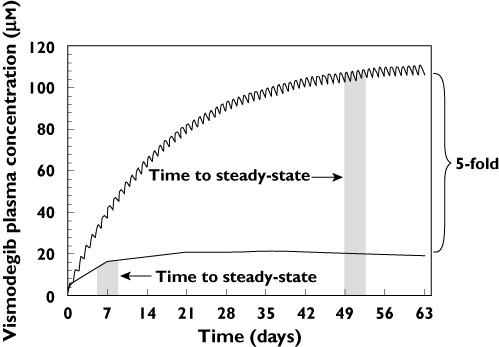
Actual and predicted vismodegib plasma concentration–time profiles. The simulated line shows expected levels of vismodegib accumulation based upon single dose PK parameters using the principle of superposition. The average steady-state concentration reported from a phase 1 study in cancer patients was markedly lower (5-fold) than the simulated concentrations [6]. The lower than expected accumulation could result from a concentration-dependent change in clearance, bioavailability or both, as demonstrated by equation 1
The PK data after oral administration of vismodegib do not allow determination of the relative contribution of drug absorption and systemic clearance to the non-linear PK of vismodegib. As shown in equation 1, lower than expected drug accumulation (i.e. steady-state concentration =Css) may be due to a decrease in absolute bioavailability (F), an increase in clearance (CL) or both. Dose (D) and dosing interval (τ) are fixed for vismodegib; therefore, neither of these two parameters are responsible.
| (1) |
The present study was designed to assess the systemic clearance and absolute bioavailability of vismodegib utilizing a tracer radiocarbon labelling approach in which radiolabelled intravenous (i.v.) vismodegib was given simultaneously with unlabelled oral drug under single dose and steady-state conditions. Plasma samples following administration of 14C-labeled drug were analyzed with the ultrasensitive analytical technology of accelerator mass spectrometry (AMS), allowing quantification of low concentrations following administration of tracer doses of drug [9, 10]. The tracer approach was taken to reduce the exposure of healthy volunteers to radioactivity given the long half-life of vismodegib. The objective of this study was to determine if the PK of vismodegib after i.v. administration and/or the absolute bioavailability of vismodegib differ between a single dose and multiple dosing (steady-state) to elucidate further the basis of the non-linear PK.
Methods
This was an open label, phase 1, single centre study in healthy female subjects of non-childbearing potential. The study was conducted in accordance with the principles of the Declaration of Helsinki (and its amendments) and in compliance with the International Conference on Harmonization E6 Guideline for Good Clinical Practice (CPMP/ICH/135/95) and the European Union Clinical Trial Directive (Directive 2001/20/EC).
Subjects
Healthy female subjects of non-childbearing potential between 18 and 65 years of age and with body mass index between 18 and 32 kg m−2 were eligible for enrolment. Participants were excluded if any of the following criteria were applicable: serum AAG concentration below 0.79 g l−1 (single dose group), serum AAG concentration below 0.79 g l−1 or above 1.3 g l−1 (multiple dose group), history or clinical manifestations of clinically significant disease or severe physical injury, history of alcoholism, drug abuse, or drug addiction.
While on-study, patients could not take prescription medications/products, over the counter medication, any known enzyme-inducing/inhibiting agents (e.g. rifampicin, St John's wort or other Hypericum perforatum containing substances, ketoconazole, etc.), investigational drugs or other non-prescription preparations, with the exception of hormone replacement therapy. Patients could not receive vaccinations or blood products. Patients could not take nicotine-containing or nicotine-replacement products, alcohol or methylxanthine-containing beverages or food until day 14. After day 14, these substances were not permitted within 24 h before a study visit, unless deemed acceptable by the medical investigator. In addition, subjects were advised to not engage in strenuous activity until completion of the study.
Because of the strong correlation between AAG and vismodegib concentration [6, 7], study entry criteria were originally established to exclude subjects with AAG concentrations <0.79 g l−1 so that AAG would not be saturated by the oral dose and vismodegib exposure would not exceed safety margins based on exposure in the toxicology studies. For the multiple dose treatment group, the exclusion criteria were further restricted to assure similar AAG concentrations between the single dose and multiple dose groups, thereby minimizing the potential influence of AAG concentrations on systemic clearance and exposure when comparing the two treatment groups.
The clinical study protocol and its amendment, the informed consent forms and any information given to the subject and relevant supporting information were submitted for review and approval by the Independent Ethics Committee (IEC) of the Stichting Beoordeling Ethiek Bio Medisch Onderzoek (Assen, the Netherlands) before eligibility screening. In addition, any subject recruitment materials were submitted for review and approval by the IEC. All subjects signed the IEC-approved study consent form during the prestudy screening visit and before any study procedures were initiated.
Study procedures
All subjects arrived for admission to the clinical research facility in the afternoon preceding the first day of drug administration (day 1). Upon admission to the clinical research facility, the inclusion and exclusion criteria were re-checked and a drug screen (including alcohol) was repeated. Occurrence of baseline complaints or adverse events and use of concomitant medication were checked and recorded.
Vismodegib was dosed in the morning after a ≥4 h fast. Fasting (no food or water) continued for 4 h after the oral dose in the single dose group and for 2 h after the oral dose on days 1−6 and 4 h after the oral dose on day 7 in the multiple dose group. Subjects were not allowed to lie down during the post dose fasting period to facilitate drug absorption.
In the single dose group, subjects received a single oral dose of 150 mg unlabelled vismodegib administered in hard gelatin capsule form (Patheon, Inc., Research Triangle Park, NC) with approximately 240 ml water. Starting approximately 2 h after oral administration (at approximately tmax for oral vismodegib), a tracer dose of 10 µg (2 ml) 14C-vismodegib containing approximately 18.5 kBq (500 nCi) of radiocarbon (Selcia Ltd, Ongar, UK) was administered as an i.v. injection (PRA Pharmacy, Raleigh, NC) over 1 min and flushed with 5 ml of 5% dextrose immediately after the injection. Subjects were confined to the clinical research facility for up to 144 h (day 7). Subjects left the clinic on day 7 following completion of all assessments provided they were fit to do so, in the opinion of the medical investigator. Subjects returned to the clinic for ambulatory visits on days 10, 14, 21, 28, 35, 42, 49 and 56 (±1 day).
In the multiple-dose group, subjects received a single oral dose of unlabelled vismodegib administered in hard gelatin capsule form on days 1–7. On day 7, starting approximately 2 h after oral administration, a tracer dose of 10 µg (2 ml) 14C-vismodegib containing approximately 18.5 kBq (500 nCi) radiocarbon, was administered as an i.v. injection over 1 min and flushed with 5 ml of 5% dextrose immediately after the injection. Subjects were confined to the clinical research facility from days 1 through 13 (up to 144 h after dosing on day 7). Subjects left the clinic on day 13 following completion of all assessments, provided they were fit to do so, in the opinion of the medical investigator. Subjects returned to the clinic for ambulatory visits on days 21, 28, 35, 42, 49 and 56 (±1 day).
Safety assessments
Safety and tolerability of vismodegib were assessed through collection of adverse events (incidence, nature and severity), and change in clinical laboratory results, vital signs, electrocardiogram and physical examination findings.
PK assessments
Serial PK blood samples for analysis of vismodegib and 14C-vismodegib in plasma were collected in both treatment groups. In the single dose group, PK blood samples were obtained at the following times: 15 min pre-oral dose, at 15, 30, 60, 90, 120 (just before i.v. administration), 125 (at end of i.v. administration), 135 and 150 min and 3, 4, 8, 10, 12, 14, 24, 30, 35, 40, 48, 72, 96, 120 and 144 h after the oral dose, day 10, day 14 and weekly thereafter through day 56.
In the multiple dose group, PK blood samples were collected at 15 min pre-oral dose on days 1–7, at 15, 30, 60, 90, 120 (just before i.v. administration), 125 (at end of i.v. administration), 135 and 150 min and 3, 4, 8, 10, 12, 14, 24, 30, 35, 40, 48, 72, 96, 120 and 144 h after the last oral dose on day 7, day 21 and weekly thereafter through day 56.
Bioanalytical methods
14C-vismodegib concentration in plasma was determined by AMS and high performance liquid chromatography (Xceleron Ltd, Heslington and Sand Hutton, York, UK). Total vismodegib concentration was determined in plasma using a validated solid phase extraction liquid chromatography-tandem mass spectrometry (LC-MS/MS) method using reverse-phase chromatography coupled with a TurboIonSpray® interface (Tandem Labs, Salt Lake City, UT, USA). The method was validated over a calibration curve range of 5 to 5000 ng ml−1 (0.012–11.9 µm) [5]. Selected plasma samples from subjects in the multiple dose group were assayed for unbound vismodegib which was measured in dialysate from plasma samples that underwent equilibrium dialysis (QPS, Newark, DE) [11]. Unbound plasma concentrations were determined using a LC-MS/MS method validated over a calibration curve range of 0.100 to 100 ng ml−1 (0.00024–0.24 µm) (Tandem Labs, Salt Lake City, UT [11]. AAG concentrations in serum were determined by immunonephelometry using a standard clinical laboratory procedure.
Pharmacokinetic analysis
Plasma concentration values in ng or ng equivalents ml−1 were converted to µm using the molecular weight of vismodegib (421.3 g mol−1). Individual and mean (SD) plasma concentration-time data were tabulated and plotted. Median and range were reported for tmax. The following PK parameters were calculated via a non-compartmental model with WinNonlin® (version 5.2.1, Pharsight Corporation, Mountain View, CA): maximum observed plasma concentration (Cmax), time to Cmax (tmax), area under the plasma concentration–time curve (AUC), total plasma clearance (CL), volume of distribution (Vss) and terminal phase half-life (t1/2). AUC values were calculated using the linear trapezoidal method when the concentrations were rising and the logarithmic trapezoidal method when the concentrations were declining (linear up/log down rule in WinNonlin®). Below the limit of quantitation values at pre-dose were considered as zero for PK analysis. Actual blood collection time was used to calculate PK parameters. PK parameters were summarized as their means and standard deviations (SDs).
Absolute bioavailability (%F) was calculated by dividing the dose-corrected AUC from unlabelled vismodegib administered orally by the AUC (0,∞) for 14C-vismodegib administered i.v. according to the equations 2 and 3:
| (2) |
| (3) |
For the multiple-dose group, AUC for unlabelled vismodegib at steady-state was reported as AUC (0,τ) which was estimated over a 24 h interval. Specific activity of the administered dose (determined from the specific activity of 14C-vismodegib reference standard and the amount of unlabelled vismodegib added to make up the dose solution) was used to calculate the plasma drug concentration. Use of equations 2 and 3 to estimate %F for vismodegib assumes dose proportional PK between i.v. and oral administration, which is a reasonable assumption considering i.v. and oral administration were simultaneous and the body could not distinguish 14C-vismodegib from unlabelled vismodegib.
Results
Subject disposition and demographics
Twelve qualified female subjects of non-childbearing potential (six per treatment arm) were enrolled and completed the study. Administration of vismodegib was well tolerated by the healthy subjects with reported adverse events of only mild severity in all but one subject in the multiple dose group who experienced a vomiting episode of moderate severity after the first vismodegib oral dose. The majority of adverse events were of mild severity and considered by the investigator as unrelated to study drug. No findings of clinical relevance with respect to clinical laboratory, vital signs, ECG or physical examination were observed.
Subject demographics and baseline AAG concentrations are summarized in Table 1. Because of the strong correlation between AAG and vismodegib concentrations, exclusion criteria were specified for AAG concentrations in the multiple dose group based on observed AAG concentrations in the single dose group. This was done to assure a similar distribution of baseline AAG concentrations in both groups, thereby eliminating AAG as a potential confounding factor when comparing vismodegib PK after a single i.v. dose with those after multiple oral dosing. All subjects participating in the study were white females of non-childbearing potential. The age of the study subjects was in the upper end of the allowable range (18–65 years, inclusive). Demographics were similar between treatment groups, as were baseline AAG concentrations.
Table 1.
Summary of demographic characteristics and AAG concentrations
| Vismodegib treatment | Statistic | Age (years) | Height (cm) | Weight (kg) | BMI (kg m−2) | AAG (g l−1) |
|---|---|---|---|---|---|---|
| 150 mg single dose oral +14C i.v. | Mean (SD) | 62 (3) | 164 (7) | 75.5 (5.1) | 28.3 (2.4) | 0.990 (0.159) |
| (n= 6) | Range | 57–64 | 154–173 | 70.0–84.6 | 24.5–30.4 | 0.76–1.25 |
| 150 mg multiple dose oral +14C i.v. | Mean (SD) | 57 (4) | 168 (9) | 77.3 (12.4) | 27.4 (2.4) | 0.814 (0.038) |
| (n= 6) | Range | 51–61 | 157–182 | 56.7–94.9 | 23.0–29.7 | 0.76–0.86 |
Multiple dose – once daily for 7 days.
Single dose pharmacokinetic results
Following the single 150 mg oral dose, vismodegib absorption appeared to be prolonged with two absorption peaks, leading to a wide range of reported tmax values (median 24 h, range 1.0–48 h) (Figure 2A and Table 2). Following the 10 µg (500 nCi) i.v. bolus dose, 14C-vismodegib plasma concentrations decreased markedly over the first 30 min (Figure 2A). This short distribution phase was followed by a slower elimination phase from 10 h through the remainder of the sample collection period which paralleled the single dose oral concentration–time profile. The terminal elimination half-life (t1/2) was similar following oral (unlabelled) and i.v. (14C-vismodegib) administration (mean 11.3 and 13.0 days, respectively). This result provides justification for the use of equations 2 and 3 to estimate %F. The parallel profiles observed after i.v. and oral administration indicated elimination rate-limited PK (Figure 2B). The volume of distribution (Vss) following the i.v. dose was moderate (mean 16.4 l), suggesting vismodegib is distributed out of the plasma space and clearance (CL) was very slow (mean 43.4 ml h−1). The absolute bioavailability was moderate (mean 31.8%) with little inter-individual variability (coefficient of variation (CV) 14.5%) (Table 3).
Figure 2.
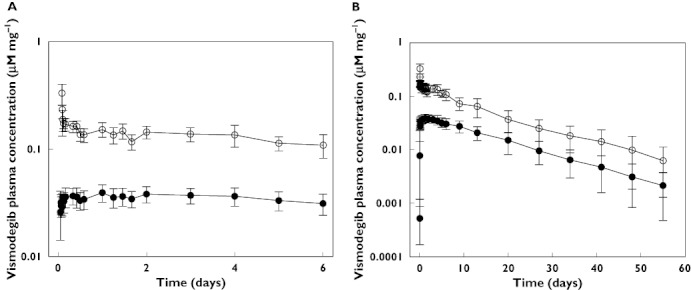
Dose-corrected comparison of unlabelled vismodegib and 14C-vismodegib plasma concentrations (mean ± SD) after a single 150 mg vismodegib oral dose and 10 µg 14C-vismodegib i.v. administration (2 h after oral dose) for (A) day 1 through day 7 and (B) day 1 through day 56. Unlabeled vismodegib (oral), ( ); 14C-vismodegib (i.v.), (
 )
)
Table 2.
Vismodegib pharmacokinetic parameters following oral administration of 150 mg vismodegib
| Subject | t1/2 (days) | tmax* (h) | Cmax (µm) | AUC† (µm h) |
|---|---|---|---|---|
| Single dose | ||||
| 1 | 12.0 | 24.0 | 6.91 | 3130 |
| 2 | 13.3 | 48.0 | 6.76 | 4060 |
| 3 | 10.3 | 1.00 | 4.75 | 1980 |
| 4 | 8.83 | 1.00 | 5.98 | 2470 |
| 5 | 8.83 | 24.1 | 4.72 | 1590 |
| 6 | 14.3 | 24.0 | 6.57 | 3850 |
| Mean | 11.3 | 24.0 | 5.95 | 2850 |
| %CV | 20.4 | 1.00–48.0 | 16.7 | 35.1 |
| Multiple dose | ||||
| 13 | 8.88 | 4.00 | 19.2 | 396 |
| 14 | 13.6 | 4.00 | 14.9 | 332 |
| 15 | 11.2 | 10.0 | 19.3 | 441 |
| 16 | 6.46 | 2.00 | 17.7 | 399 |
| 17 | 8.92 | 1.00 | 17.3 | 344 |
| 18 | 10.4 | 4.00 | 10.3 | 225 |
| Mean | 9.92 | 4.00 | 16.4 | 356 |
| %CV | 24.5 | 1.00–10.0 | 20.7 | 21.3 |
tmax summary statistics reported as median and range.
AUC is defined as the AUC (0,∞) for single dose group and AUC (0,24) on day 7 for multiple dose group. t1/2, terminal phase half-life; tmax, time to maximum observed plasma concentration; Cmax, maximum observed plasma concentration; AUC, area under the plasma concentration–time curve.
Table 3.
14C-vismodegib pharmacokinetic parameters following i.v. bolus administration of 10 µg 14C-vismodegib with 150 mg oral vismodegib
| Subject | t1/2 (days) | CL (ml h−1) | Vss (l) | AUC (0,∞) (µm h) | Absolute bioavailability (%) |
|---|---|---|---|---|---|
| Single dose | |||||
| 1 | 12.4 | 36.6 | 14.7 | 0.648 | 32.2 |
| 2 | 17.3 | 26.8 | 14.4 | 0.883 | 30.6 |
| 3 | 9.88 | 59.5 | 19.6 | 0.399 | 33.2 |
| 4 | 10.3 | 53.3 | 16.7 | 0.446 | 36.9 |
| 5 | 8.79 | 52.4 | 16.6 | 0.453 | 23.4 |
| 6 | 19.7 | 31.8 | 16.6 | 0.748 | 34.3 |
| Mean | 13.0 | 43.4 | 16.4 | 0.596 | 31.8 |
| CV% | 34.0 | 30.9 | 11.3 | 32.7 | 14.5 |
| Multiple dose | |||||
| 13 | 7.42 | 106 | 32.6 | 0.223 | 10.90 |
| 14 | 15.30 | 61.0 | 29.9 | 0.389 | 5.28 |
| 15 | 10.80 | 78.2 | 29.6 | 0.304 | 8.89 |
| 16 | 5.67 | 71.8 | 17.4 | 0.330 | 7.40 |
| 17 | 9.38 | 89.1 | 29.4 | 0.266 | 7.85 |
| 18 | 13.50 | 64.6 | 22.0 | 0.368 | 3.82 |
| Mean | 10.30 | 78.5 | 26.8 | 0.313 | 7.36 |
| CV% | 35.1 | 21.4 | 21.7 | 20.0 | 34.4 |
t1/2, terminal phase half-life; CL, total plasma clearance; Vss, volume of distribution; AUC (0,∞), area under the plasma concentration–time curve from time 0 to infinity.
Multiple dose pharmacokinetic results
As shown in Figure 3, steady-state plasma concentrations were achieved within 7 days of daily oral administration of 150 mg vismodegib. There was a sharp decline in the concentration of vismodegib within the first hour of administering the i.v. dose on day 7 followed by a slow terminal elimination phase over the remainder of the PK sampling period. The mean terminal elimination half-life after the last 150 mg oral dose of vismodegib on day 7 was similar to that following the 14C-labelled i.v. bolus dose on day 7 (9.92 and 10.3 days, respectively) (Table 2 and Table 3).
Figure 3.
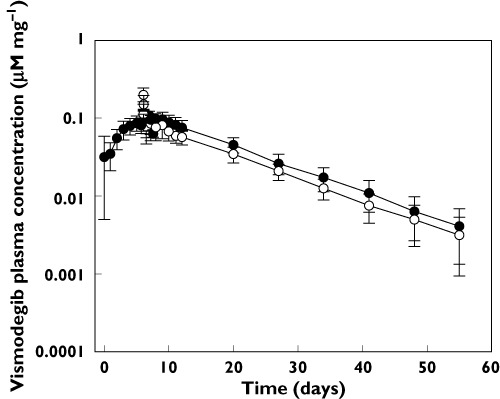
Dose-corrected comparison of unlabelled vismodegib and 14C-vismodegib plasma concentrations (mean ± SD) after a 150 mg vismodegib oral daily dose for 7 days and 10 µg 14C-vismodegib i.v. administration (2 h after oral dose on day 7). Unlabeled vismodegib (oral), ( ); 14C-vismodegib (i.v.), (
 )
)
Mean terminal elimination half-life of 14C-vismodegib was similar after i.v. dosing with a single oral dose and at steady-state after multiple oral doses (Table 3). The mean i.v. CL and Vss were 81% and 63% higher, respectively, for the 14C-labelled i.v. bolus dose administered at oral steady-state than after administration with a single oral dose. Absolute bioavailability decreased by 77% compared with the single dose result (Table 3).
Vismodegib fraction unbound results
Unbound concentrations of vismodegib were measured in the multiple dose group. The vismodegib fraction unbound increased in all six subjects after repeated daily dosing relative to the dose given on day 1 (Figure 4). On average, the fraction unbound was 2.4-fold higher after 7 days of daily dosing as compared with a single dose (mean ± SD 0.0079 ± 0.0023 vs. 0.0033 ± 0.0012). Upon discontinuation of dosing, the fraction unbound returned to the single dose level by day 35 (mean ± SD 0.0024 ± 0.0003).
Figure 4.
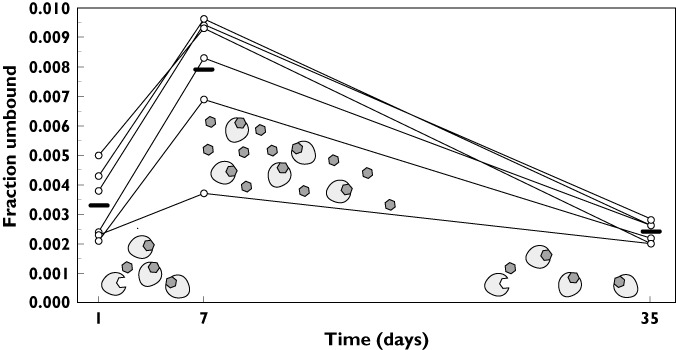
Vismodegib fraction unbound vs. time after a 150 mg vismodegib oral daily dose for 7 days. The solid bar represents the mean value at each time point. The schematic shows that AAG is not saturated after a single dose; AAG saturation occurs after continuous daily dosing with a return to the unsaturated state approximately 4 weeks after discontinuation of dosing (day 35). AAG, ( )
)
Discussion
The systemic CL, volume of distribution and absolute bioavailability of vismodegib after single and multiple oral dosing in healthy, post menopausal female subjects is described here for the first time, using a radiolabelled tracer i.v. dose and the findings provide important insight regarding the complex, multifactorial mechanisms for the compound's dose- and concentration-dependent pharmacokinetics. Intravenous administration of vismodegib following oral dosing to steady-state showed that vismodegib CL and Vss increased by 81% and 63%, respectively, relative to a single dose, which can be explained by the 2.4-fold increase in fraction unbound of vismodegib after repeated dosing.
Notably, the unbound clearance (CL/fu) and unbound volume of distribution (Vss/fu) were similar after single and multiple dosing. Unbound CL after single and multiple dosing was 13 152 ml h−1 and 9937 ml h−1, respectively and the unbound Vss after single and multiple dosing was 4970 l and 3392 l, respectively. The mean fu values from six subjects on day 1 and day 7 (see results section) were used to estimate CL/fu and Vss/fu after single and multiple dosing, respectively. While calculation of unbound CL and Vss from a single timepoint (i.e. fu was measured on day 1 and day 7 whereas CL and Vss were estimated over the entire time course) has limitations, this estimation nonetheless indicates that the intrinsic clearance and tissue distribution properties of vismodegib do not change with multiple dosing. In the single dose group, an association between CL and AAG was observed, with slower CL observed at higher baseline AAG concentrations. In the multiple dose group, AAG concentrations remained constant during the study (data not shown), which means that the observed change in CL was not due to variability in AAG concentrations. The observed increase in vismodegib fraction unbound after repeated daily dosing compared with a single dose was previously reported and is believed to be dependent on AAG saturation which occurs as the drug concentrations increase over time, and this affects the equilibrium with HSA [8].
An increase in CL following repeated dosing is often due to autoinduction of hepatic metabolism, such as that described for rifampicin and rifabutin [12, 13]. Tenidap, a non-steroidal anti-inflammatory drug, demonstrates time-dependent increases in systemic and intrinsic CL that are similar in magnitude with no concurrent change in plasma protein binding after multiple dosing. This finding suggests that the change in intrinsic CL with tenidap is due to enhanced metabolism leading to altered systemic CL [14]. However, this is not the case for vismodegib, as evidenced by similar increases in CL and fraction unbound, which are suggestive of unchanged intrinsic CL of vismodegib after multiple daily dosing.
The absolute bioavailability of vismodegib decreased considerably (77%) after repeated dosing. Such changes in bioavailability have been reported for nelfinavir and rifampicin due to metabolic enzyme induction [12, 15]. In contrast, the decrease in bioavailability with vismodegib is likely due to poor intestinal solubility and slow drug absorption. This hypothesis is supported by the limited in vitro solubility of vismodegib at physiologic pH (0.0001 mg ml−1 at pH 6.5–7.4) and the observation that vismodegib absorption appears to extend beyond 24 h as demonstrated by slow fecal recovery of total radioactivity following a single radiolabelled oral dose [6, 16]. The observed decrease in bioavailability after daily dosing is consistent with previous observations of a non-dose proportional increase of vismodegib exposure with increasing dose [1, 6] and it is also consistent with observations in the dog and corresponding PBPK modelling [17].
The duration of daily dosing in the multiple dose group was limited to 7 days based on safety margins that were deemed acceptable for healthy volunteer subjects. These safety margins were derived from vismodegib plasma exposure in animal toxicology and clinical studies. Accurate estimation of steady-state PK parameters for an i.v. tracer dose generally requires continuous extravascular dosing [18, 19] which would have required daily dosing of 150 mg vismodegib for 56 days in the current study. Consequently, the magnitude of change in the reported vismodegib PK parameters may have been underestimated in the present study. Therefore a thorough assessment of the change in PK parameters was undertaken. Substitution of the measured single dose F and CL into equation 1 (with dose and dosing interval set to 150 mg and 24 h, respectively) gives a calculated steady-state concentration of approximately 100 µm which is similar to the simulated steady-state concentration shown in Figure 1, assuming linear PK. On the other hand, the steady-state concentration is estimated to be much lower (approximately 15 µm) upon substitution of the measured multiple dose F and CL into equation 1 and is similar to the observed steady-state concentration of approximately 20 µm in cancer patients with multiple daily dosing (Figure 1) [6]. Thus, the increase in CL and decrease in F observed in this study explains the 5-fold lower than expected accumulation of vismodegib with continuous daily dosing. Taken together, these findings suggest that limiting oral dosing to 7 days in this study had little to no impact on the estimation of i.v. PK parameters for vismodegib.
In summary, the results of this study demonstrate that vismodegib exhibits non-linear PK as evidenced by concentration dependent changes in PK parameters. Simultaneous administration of a radiolabelled i.v. tracer dose and unlabelled oral drug allowed for estimation of vismodegib PK parameters after single and multiple oral doses. Vismodegib CL and Vss increased after repeated daily oral dosing due to changes in fraction unbound which is dependent on the degree of AAG saturation. With repeated daily oral dosing, the absolute bioavailability decreased substantially relative to a single dose. As a result of these PK properties, daily dosing of vismodegib does not result in the excessive drug accumulation that is predicted for a drug with a long single dose half-life of 12 days.
Acknowledgments
We thank the healthy volunteers who enrolled in this study and took valuable time away from their personal lives to advance science; Ruud Lutgerink and Dr Berend Oosterhuis and the research staff at PRA International for conducting the clinical study, Marie Simpson and Dr. Mark Seymour at Xceleron; our colleagues at Genentech, Inc., Drs. Harvey Wong, Alan Deng, Cyrus Khojasteh, and Yong Cui and members of the clinical operations team, Glenn Morrison and Karin Jorga (Roche), Priscilla Horn and Lisa Nelson Beckel – all their support is gratefully acknowledged.
Vismodegib was discovered by Genentech and was jointly validated through a series of preclinical studies performed under a collaborative agreement between Genentech, Inc. (South San Francisco, CA) and Curis, Inc. (Lexington, MA).
Competing Interest
M. Borin has been a paid consultant of Genentech for this project. R.A. Graham, C.E.C.A. Hop, B.L. Lum, D. Colburn, I. Chang, Y.G. Shin, V. Malhi, J.A. Low and M. Dresser are employees of Genentech, a member of the Roche Group, and shareholders of Roche.
REFERENCES
- 1.LoRusso PM, Rudin CM, Reddy JC, Tibes R, Weiss GJ, Borad MJ, Hann CL, Brahmer JR, Chang I, Darbonne WC, Graham RA, Zerivitz KL, Low JA, Von Hoff DD. Phase I trial of hedgehog pathway inhibitor vismodegib (GDC-0449) in patients with refractory, locally advanced or metastatic solid tumors. Clin Cancer Res. 2011;17:2502–11. doi: 10.1158/1078-0432.CCR-10-2745. [DOI] [PMC free article] [PubMed] [Google Scholar]
- 2.Rudin CM, Hann CL, Laterra J, Yauch RL, Callahan CA, Fu L, Holcomb T, Stinson J, Gould SE, Coleman B, LoRusso PM, Von Hoff DD, de Sauvage FJ, Low JA. Treatment of medulloblastoma with hedgehog pathway inhibitor GDC-0449. N Engl J Med. 2009;361:1173–8. doi: 10.1056/NEJMoa0902903. [DOI] [PMC free article] [PubMed] [Google Scholar]
- 3.Von Hoff DD, LoRusso PM, Rudin CM, Reddy JC, Yauch RL, Tibes R, Weiss GJ, Borad MJ, Hann CL, Brahmer JR, Mackey HM, Lum BL, Darbonne WC, Marsters JC, Jr, de Sauvage FJ, Low JA. Inhibition of the hedgehog pathway in advanced basal-cell carcinoma. N Engl J Med. 2009;361:1164–72. doi: 10.1056/NEJMoa0905360. [DOI] [PubMed] [Google Scholar]
- 4.Sekulic AA, Migden MRB, Oro AEC, Dirix LM, Lewis KD, Hainsworth JDQ, Solomon JAH, Yoo SI, Arron STE, Friedlander PAJK, Marmur EK, Rudin CML, Chang ALSC, Low JAF, Mueller ABF, Yauch RLF, Reddy JCF, Hauschild AN. A pivotal study evaluating efficacy and safety of the hedgehog pathway inhibitor (HPI) vismodegib (GDC-0449) in patients with locally advanced (la) or metastatic (m) basal cell carcinoma (BCC) Melanoma Res. 2011;21:e9. doi: 10.1097/01.cmr.0000399448.65869.b7. [Google Scholar]
- 5.Ding X, Chou B, Graham RA, Cheeti S, Percey S, Matassa LC, Reuschel SA, Meng M, Liu S, Voelker T, Lum BL, Rudewicz PJ, Hop CE. Determination of GDC-0449, a small-molecule inhibitor of the hedgehog signaling pathway, in human plasma by solid phase extraction-liquid chromatographic-tandem mass spectrometry. J Chromatogr B Analyt Technol Biomed Life Sci. 2010;878:785–90. doi: 10.1016/j.jchromb.2010.01.039. [DOI] [PubMed] [Google Scholar]
- 6.Graham RA, Lum BL, Cheeti S, Jin JY, Jorga K, Von Hoff DD, Rudin CM, Reddy JC, Low JA, Lorusso PM. Pharmacokinetics of hedgehog pathway inhibitor vismodegib (GDC-0449) in patients with locally advanced or metastatic solid tumors: the role of alpha-1-acid glycoprotein binding. Clin Cancer Res. 2011;17:2512–20. doi: 10.1158/1078-0432.CCR-10-2736. [DOI] [PMC free article] [PubMed] [Google Scholar]
- 7.Giannetti AM, Wong H, Dijkgraaf GJ, Dueber EC, Ortwine DF, Bravo BJ, Gould SE, Plise EG, Lum BL, Malhi V, Graham RA. Identification, characterization, and implications of species-dependent plasma protein binding for the oral hedgehog pathway inhibitor vismodegib (GDC-0449) J Med Chem. 2011;54:2592–601. doi: 10.1021/jm1008924. [DOI] [PubMed] [Google Scholar]
- 8.LoRusso PM, Jimeno A, Dy G, Adjei A, Berlin J, Leichman L, Low JA, Colburn D, Chang I, Cheeti S, Jin JY, Graham RA. Pharmacokinetic dose-scheduling study of hedgehog pathway inhibitor vismodegib (GDC-0449) in patients with locally advanced or metastatic solid tumors. Clin Cancer Res. 2011;17:5774–82. doi: 10.1158/1078-0432.CCR-11-0972. [DOI] [PubMed] [Google Scholar]
- 9.Garner RC. Accelerator mass spectrometry in pharmaceutical research and development–a new ultrasensitive analytical method for isotope measurement. Curr Drug Metab. 2000;1:205–13. doi: 10.2174/1389200003339054. [DOI] [PubMed] [Google Scholar]
- 10.Lappin G, Garner RC. Big physics, small doses: the use of AMS and PET in human microdosing of development drugs. Nat Rev Drug Discov. 2003;2:233–40. doi: 10.1038/nrd1037. [DOI] [PubMed] [Google Scholar]
- 11.Deng Y, Wong H, Graham RA, Liu W, Shen HS, Shi Y, Wang L, Meng M, Malhi V, Ding X, Dean B. Determination of unbound vismodegib (GDC-0449) concentration in human plasma using rapid equilibrium dialysis followed by solid phase extraction and high-performance liquid chromatography coupled to mass spectrometry. J Chromatogr B Analyt Technol Biomed Life Sci. 2011;879:2119–26. doi: 10.1016/j.jchromb.2011.05.048. [DOI] [PubMed] [Google Scholar]
- 12.Loos U, Musch E, Jensen JC, Mikus G, Schwabe HK, Eichelbaum M. Pharmacokinetics of oral and intravenous rifampicin during chronic administration. Klin Wochenschr. 1985;63:1205–11. doi: 10.1007/BF01733779. [DOI] [PubMed] [Google Scholar]
- 13.Benedetti MS, Dostert P. Induction and autoinduction properties of rifamycin derivatives: a review of animal and human studies. Environ Health Perspect. 1994;102(Suppl. 9):101–06. doi: 10.1289/ehp.94102s9101. [DOI] [PMC free article] [PubMed] [Google Scholar]
- 14.Gardner MJ, Wilner KD, Hansen RA, Fouda HG, McMahon GF. Single and multiple dose pharmacokinetics of tenidap sodium in healthy subjects. Br J Clin Pharmacol. 1995;39(Suppl. 1):11S–5S. doi: 10.1111/j.1365-2125.1995.tb04495.x. [DOI] [PMC free article] [PubMed] [Google Scholar]
- 15.Sarapa N, Hsyu PH, Lappin G, Garner RC. The application of accelerator mass spectrometry to absolute bioavailability studies in humans: simultaneous administration of an intravenous microdose of 14C-nelfinavir mesylate solution and oral nelfinavir to healthy volunteers. J Clin Pharmacol. 2005;45:1198–205. doi: 10.1177/0091270005280051. [DOI] [PubMed] [Google Scholar]
- 16.Graham RA, Lum BL, Morrison G, Chang I, Jorga K, Dean BJ, Shin Y, Yue Q, Mulder T, Malhi V, Xie M, Low J, Hop CE. A single dose mass balance study of the hedgehog pathway inhibitor vismodegib (GDC-0449) in humans using accelerator mass spectrometry. Drug Metab Dispos. 2011;39:1460–7. doi: 10.1124/dmd.111.039339. [DOI] [PubMed] [Google Scholar]
- 17.Wong H, Theil FP, Cui Y, Marsters JC, Jr, Khojasteh SC, Vernillet L, La H, Song X, Wang H, Morinello EJ, Deng Y, Hop CE. Interplay of dissolution, solubility, and nonsink permeation determines the oral absorption of the hedgehog pathway inhibitor GDC-0449 in dogs: an investigation using preclinical studies and physiologically based pharmacokinetic modeling. Drug Metab Dispos. 2010;38:1029–38. doi: 10.1124/dmd.110.032680. [DOI] [PubMed] [Google Scholar]
- 18.Boddy AV, Sludden J, Griffin MJ, Garner C, Kendrick J, Mistry P, Dutreix C, Newell DR, O'Brien SG. Pharmacokinetic investigation of imatinib using accelerator mass spectrometry in patients with chronic myeloid leukemia. Clin Cancer Res. 2007;13:4164–9. doi: 10.1158/1078-0432.CCR-06-2179. [DOI] [PubMed] [Google Scholar]
- 19.Lappin G, Stevens L. Biomedical accelerator mass spectrometry: recent applications in metabolism and pharmacokinetics. Expert Opin Drug Metab Toxicol. 2008;4:1021–33. doi: 10.1517/17425255.4.8.1021. [DOI] [PubMed] [Google Scholar]