

Abstract
Aims
Pregnant women are usually not part of the traditional drug development programme. Pregnancy is associated with major biological and physiological changes that alter the pharmacokinetics (PK) of drugs. Prediction of the changes to drug exposure in this group of patients may help to prevent under- or overtreatment. We have used a pregnancy physiologically based pharmacokinetic (p-PBPK) model to assess the likely impact of pregnancy on three model compounds, namely caffeine, metoprolol and midazolam, based on the knowledge of their disposition in nonpregnant women and information from in vitro studies.
Methods
A perfusion-limited form of a 13-compartment full-PBPK model (Simcyp® Simulator) was used for the nonpregnant women, and this was extended to the pregnant state by applying known changes to all model components (including the gestational related activity of specific cytochrome P450 enzymes) and through the addition of an extra compartment to represent the fetoplacental unit. The uterus and the mammary glands were grouped into the muscle compartment. The model was implemented in Matlab Simulink and validated using clinical observations.
Results
The p-PBPK model predicted the PK changes of three model compounds (namely caffeine, metoprolol and midazolam) for CYP1A2, CYP2D6 and CYP3A4 during pregnancy within twofold of observed values. The changes during the third trimester were predicted to be a 100% increase, a 30% decrease and a 35% decrease in the exposure of caffeine, metoprolol and midazolam, respectively, compared with the nonpregnant women.
Conclusions
In the absence of clinical data, the in silico prediction of PK behaviour during pregnancy can provide a valuable aid to dose adjustment in pregnant women. The performance of the model for drugs metabolized by a single enzyme to different degrees (high and low extraction) and for drugs that are eliminated by several different routes warrants further study.
Keywords: caffeine, metoprolol, midazolam, physiologically based pharmacokinetic model, pregnancy
WHAT IS ALREADY KNOWN ABOUT THIS SUBJECT
Changes in physiology and biology during pregnancy lead to variation of the kinetics of drugs; therefore, a similar dose of a drug may not be associated with similar drug exposure to that found in nonpregnant women.
WHAT THIS STUDY ADDS
This study introduces a novel physiologically based model, which integrates the knowledge of changes in various elements related to kinetics, particularly those of enzyme activity for three different cytochrome P450 enzymes, and shows the validity of assumptions on three cases related to caffeine, metoprolol and midazolam.
Introduction
Pregnancy is associated with an array of ‘normal’ profound physiological, anatomical and biochemical changes in the maternal body to accommodate the formed fetoplacental unit. These changes affect almost all maternal organs and are likely to alter the pharmacokinetics (PK) and pharmacodynamics of drugs administered during pregnancy significantly [1, 2]. A comprehensive meta-analysis of major changes that are known for their effects on drug kinetics has been carried out recently by our group [3]. Physiologically, all the temporal adaptations that affect the maternal body start simultaneously with conception, albeit with different magnitudes and trends [3]. Such a complex dynamic system challenges practical PK predictions during pregnancy (because all PK variables change with time) unless the study is carried out in a relatively short time span compared with the duration of pregnancy.
For clinical and ethical reasons, pregnant women are actively excluded from drug studies [4–6]. Frequently, if pregnancy occurs during a clinical study, the subject is dropped from the study. The majority of antenatally prescribed drugs are ‘off-label’ or unlicensed for pregnant women [7, 8], owing to a scarcity of studies in this group of patients. Drug dosing during pregnancy is usually scaled up from men or nonpregnant women, ignoring the impact of physiological and biochemical changes that occur during pregnancy. Such simple scaling may lead to over- or underdosing [9, 10]. For drugs with narrow safety windows, dose adjustment at various stages of pregnancy is necessary to avoid adverse drug effects [10–12]. Although overdosing has been a bigger concern, the failure to achieve the desired therapeutic effectiveness by underdosing can also put the pregnant mother and/or her fetus at risk.
The US Food and Drug Administration (FDA) [13, 14] and European Medicines Agency (EMA) [15] established a framework for the evaluation of the study designs, PK and monitoring of exposures to medicinal products during pregnancy. They have required that application holders make postmarketing commitments to conduct studies of the effects of products when used during pregnancy, especially for biopharmaceutical preparations that have a high likelihood of use in women of child-bearing potential. The EMA guidance reviews various study design options that may be used to monitor the safety of product exposures in pregnancy, while the FDA guidance document focuses on establishing prospective pregnancy exposure registries.
Currently, there is no widely accepted approach for appropriate optimization of the dose in pregnant women. The pregnancy physiologically based pharmacokinetic (p-PBPK) model that incorporates the pregnancy-induced changes in various anatomical, physiological and biological parameters is a feasible alternative to empirical dosage selection when there are no clinical studies to guide the requirements. Theoretically, a p-PBPK model will be useful not only in dosage adjustment for the pregnant population, but also in developing drugs that are aimed only at pregnant women (e.g. tocolytic agents or drugs for pre-eclampsia). Nonetheless, these models require comprehensive information on the magnitude of anatomical, physiological and biochemical changes from nonpregnant status through to term and a reasonable knowledge of the drug disposition using in vitro information from a nonpregnant population.
A number of p-PBPK models have been reported for xenobiotic disposition in pregnant women. Recently, these models have been reviewed by our group [16]. Many of these were applications related to toxicokinetic and risk assessments in the mother and fetus [17–19]. Only two publications could be identified that focused on PK. One of these described the effect of pregnancy on the PK of midazolam disposition [20] and the other was related to gestagenic drugs [21]. This gap in the arena of PBPK modeling during pregnancy seems to be related to limitations of the data and the complexity of the required model. Recently, our group collected data for most of the ‘drug-independent’ (system) parameters required for p-PBPK models. These were subsequently analysed to investigate trends during pregnancy [3]. We have now incorporated these trends within the Simcyp® Simulator to create a p-PBPK model that is capable of modeling altered maternal PK for the whole duration of the pregnancy. Three model compounds that undergo hepatic metabolism by different cytochrome P450 enzymes, namely caffeine (a CYP1A2 substrate), metoprolol (a CYP 2D6 substrate) and midazolam (a CYP3A4 substrate), were used as case examples, and simulations were compared against clinical observations.
Methods
Model development
Physiological parameters required for p-PBPK model specifications and their changes during pregnancy were taken from a recently published meta-analysis of physiological, biological and anatomical measurements [3]. Formulas describing parameter values with gestational status were incorporated into the p-PBPK model. The p-PBPK model was implemented in Matlab using Simulink R2010a (The Mathworks, Inc., Natick, MA, USA). Unlike the Simcyp® Simulator, no variability terms were added to the model. Thus, the simulations represented only the average plasma drug levels.
Model structure
A basic perfusion-limited version of a PBPK model consisting of 13 compartments representing various tissues was adopted from the Simcyp full-PBPK model [22]. The PBPK model was extended by the addition of an extra mechanistic compartment for intrauterine contents, renamed the fetoplacental unit, which is another perfusion-limited compartment running in parallel with the other maternal compartments that exist between the arterial and venous blood compartments (Figure 1). For model simplicity, the fetoplacental unit compartment combined all the following components: the fetus, placenta, amniotic fluid, membranes and umbilical cord. Additionally, the uterus and the mammary glands were grouped into the maternal muscle compartment. This was justified, because the focus of study was to evaluate the PK in the mother rather than assessing the exposure of the fetus to the drug.
Figure 1.
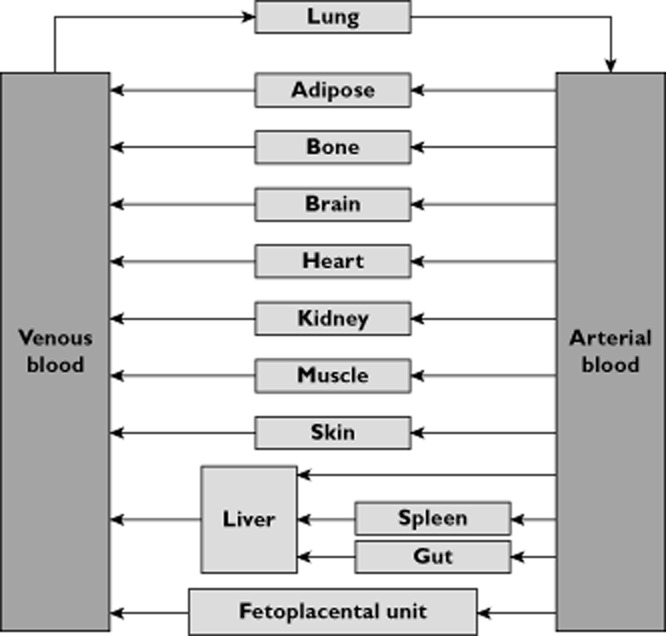
Schematic description of pregnancy physiologically based pharmacokinetic (p-PBPK) model
Basal values for physiological parameters
Mean values of all PBPK parameters that are implemented in Simcyp® Simulator version 11 for nonpregnant healthy Caucasian women aged between 20 and 40 years (i.e. child-bearing age) were used as basal values for the prepregnancy status (Table 1).
Table 1.
Basal value allocated for prepregnancy status tissue volumes and blood flow rates in the pregnancy physiologically based pharmacokinetic (p-PBPK) model
| Tissue compartment | Volume, V (% of total body volume) | Blood flow rate,  (% of cardiac output) (% of cardiac output) |
|---|---|---|
| Adipose | 0.385 | 0.085 |
| Bone | 0.025 | 0.05 |
| Brain | 0.016 | 0.12 |
| Gut | 0.015 | 0.17 |
| Heart | 0.003 | 0.05 |
| Kidney | 0.0037 | 0.17 |
| Liver | 0.02 | 0.28 |
| Lung | 0.004 | 1 |
| Muscle | 0.278 | 0.12 |
| Skin | 0.0298 | 0.03 |
| Spleen | 0.0018 | 0.05 |
| Fetoplacental unit | 0 | 0 |
| Arterial blood | 0.0205 | 1 |
| Venous blood | 0.0411 | 1 |
The basal values for the volume of the fetoplacental unit compartment and its blood flow rate were set to zero. As the uterus and mammary glands were grouped into the maternal muscle compartment, the tissue volume and blood flow rate of the muscle compartment were used to balance the allocation of total bodyweight and cardiac output in the model during pregnancy.
Time dependence of various parameters
The longitudinal change in the fetoplacental unit volume during pregnancy was described according to the Gompertz equation as follows:
where GA denotes the gestational age in weeks and a, b and c are constants equal to 0.01, 0.37 and 0.052, respectively [3]. The polynomial equation was not superior to the Gompertz equation because it predicts a negative volume at an early time point in pregnancy (data not shown). The use of the Gompertz equation to describe fetal growth has been reported elsewhere [23].
Various other systemic parameters were described using polynomial formulae that implement gestational age-dependent changes [3]. On account of the basal values used in this study, these polynomial formulae are generalized as follows:
where X denotes the physiological parameter as a function of the gestational age (GA, in weeks; GA ≥ 0), X0 is the basal value in the the prepregnant or nonpregnant state, and a0, a1 a2 and a3 are coefficients identified from meta-analysis of clinical and literature data.
This polynomial formula (Equation 2) was applied in the p-PBPK model to describe many parameters; a list of these parameters and their coefficients is given in Table 2. Furthermore, the total blood volume, which was calculated as plasma volume plus red blood cell volume, was further divided into the arterial and venous parts in the proportion of 1:2. Based on haematocrit and serum albumin, the fraction of drug unbound in plasma (fu) and blood : plasma concentration ratio (B : P) were determined.
Table 2.
Gestational age-dependent parameters used in the developed pregnancy model
| Parameter, symbol (unit) | X0 | a0 | a1 | a2 | a3 |
|---|---|---|---|---|---|
Cardiac output,
 (l h–1)
|
300 | 1 | 0.01965 | −0.000292 | 0 |
| Total bodyweight, BW (kg) | 60 | 1 | 0.00560 | 0.000054 | 0 |
| Total fat mass, Vadip (kg) | 25.89 | 1 | 0.00035 | 0.000152 | 0 |
| Plasma volume, Vplas (l) | 2.71 | 1 | −0.00892 | 0.00168 | −0.000028 |
| Red blood cell volume, Vrbc (l) | 1.45 | 1 | 0.00658 | 0 | 0 |
| Hematocrit, Hct (%) | 38.3 | 1 | −0.0014 | −0.000054 | 0 |
| Serum albumin, (g l–1) | 44.9 | 1 | −0.00358 | −0.000085 | 0 |
Skin blood flow rate,
 (l h–1)
|
14.975 | 1 | 0.02882 | 0 | 0 |
Adipose blood flow rate,
 (l h–1)
|
25.458 | 1 | 0.01542 | −0.000220 | 0 |
Renal blood flow rate,
 (l h–1)
|
50.915 | 1 | 0.05022 | −0.00125 | 0 |
Fetoplacental unit blood flow rate,
 (l h–1)
|
1 | 0 | −0.4051 | 0.1188 | −0.0019 |
| CYP1A2 activity, α1A2 | 1 | 1 | −0.03581 | 0.00050 | 0 |
| CYP2D6 activity, α2D6 | 1 | 1 | 0.02270 | −0.00035 | 0 |
| CYP3A4 activity, α3A4 | 1 | 1 | 0.02983 | −0.00074 | 0 |
Gestational time scale
In order to consider the time-varying coefficients included in the model, the PK time t (in hours) was defined as a secondary time scale, which lay within the longer gestational time scale, at the point of administration of the drug GA0 (in weeks). Therefore, gestational age GA at time t is given as follows:
where t denotes the PK simulation time, which is equal to the elapsed time (in hours) after the xenobiotic exposure, GA0 is the gestational age in weeks when the pregnant woman is exposed to the xenobiotics, and 24 and 7 are constants used for conversion. At the time of conception GA = 0, whereas for nonpregnancy status GA < 0.
Governing equations
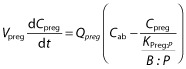
As is common with all PBPK models, the governing equations in the p-PBPK model describing the concentration dynamics of xenobiotics were based on mass conservation law. The concentration dynamics in the fetoplacental unit compartment are described as follows:
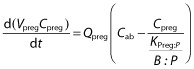 |
where Vpreg is the volume of the fetoplacental unit, Cpreg denotes the xenobiotic concentration in the fetoplacental unit,  is the blood flow rate into the fetoplacental unit, Cab is the xenobiotic concentration in the arterial blood, KPreg:P is the fetoplacental unit:plasma partition coefficient, and B : P is the blood:plasma concentration ratio. All of the parameters Vpreg,
  , KPreg:P and B : P are dependent on gestational time. Given that the pharmacokinetic time scale (in hours) is shorter than the gestational length (in weeks), the left-hand side of the previous equation can be approximated as
  , thus:
 |
Similar differential equations are available in the other 13 maternal compartments as shown in Figure 1. Therefore, the model consists of 14 nonlinear differential equations, which are characteristic of time-varying coefficients.
Model validation
Validation set
The p-PBPK model predictions were compared with different sets of clinical observations available in the literature for caffeine, metoprolol and midazolam. Selection of data for these probes was based on the availability of the relevant data, i.e. PK results, estimates and concentration–time profiles, from pregnant and nonpregnant Caucasian women and the information regarding the gestational time-dependent changes of their metabolizing enzymes. Simulation-matched study designs were used based on information in the original studies.
Caffeine is a well-known CYP1A2 substrate. Its pharmacokinetics were studied in eight pregnant women at 36 ± 3 weeks of gestation, showing a threefold increase in the half-life and threefold decrease in the total clearance during pregnancy compared with results from 4 days postpartum in four women [24]. An increasing half-life of caffeine with progression of pregnancy has been demonstrated [25–27]. By 3–15 weeks postpartum, the mean value of caffeine half-life was within the prepregnancy range [26].
Metoprolol, a CYP2D6 substrate, was studied in five pregnant women at an average of 37 weeks of gestation and repeated 3–6 months after parturition [28]. It was concluded that the greater metoprolol clearance during pregnancy resulted from increased hepatic metabolism of the drug.
Midazolam undergoes extensive metabolism by hepatic CYP3A4 enzymes. Its PK evaluation during pregnancy was studied in 13 women (2 mg orally) at 28–32 weeks of gestation and at 6–10 weeks postpartum [29]. During pregnancy, the area under the concentration–time curve (AUC) to infinity and the maximal concentration (Cmax) were decreased by 46 and 28%, respectively, compared with postpartum results. No significant changes were observed for the half-life and the time to Cmax in the two cases.
Drug-dependent values
Drug-dependent parameter values for these compounds were taken from default Simcyp library files (summarized in Table 3). The definition and symbol for different parameters are provided in Table 3 too.
Table 3.
Pharmacokinetic parameters of caffeine, midazolam and metoprolol
| Parameter | Symbol (unit) | Caffeine | Metoprolol | Midazolam |
|---|---|---|---|---|
| Fraction available for absorption from dosage form | fa | 1 | 0.88 | 0.88 |
| Gut availability | Fg | 1 | 0.99 | 0.59 |
| First-order absorption rate constant | ka (1 h–1) | 2.18 | 1.45 | 3.04 |
| Fraction of drug unbound in plasma | fu | 0.681 | 0.879 | 0.032 |
| Blood : plasma concentration ratio | B : P | 0.98 | 1.127 | 0.664 |
| Intrinsic hepatic clearance | CLint_H (l h–1) | 8 | 195 | 1583 |
| CYP1A2 contribution to hepatic clearance | A1A2 | 1 | 0 | 0 |
| CYP2D6 contribution to hepatic clearance | A2D6 | 0 | 0.93 | 0 |
| CYP3A4 contribution to hepatic clearance | A3A4 | 0 | 0.07 | 1 |
For the sake of simplicity, all of fa, Fg and ka have been assumed to be constant in the following simulations, while fu, B : P and CLint_H depend on the pregnancy-induced changes of haematocrit, plasma albumin and hepatic enzyme activities during pregnancy.
Based on the activities of hepatic CYP1A2, CYP2D6 and CYP3A4, the change of CLint_H was defined as follows:
where CLint_H0 is the basal hepatic intrinsic clearance in the nonpregnant women, expressed in the model as a ratio of basal value. A1A2, A2D6 and A3A4 denote the contribution fraction of various metabolic pathways at gestational age GA to CLint_H0 in the metabolism of xenobiotic; therefore, A1A2 + A2D6 + A3A4 = 1 (Table 3). The enzyme activity is represented as α and is dependent on gestational age (Tables 2 and 3). The values of CLint_H0 and the total contribution of different metabolic pathways to the total CLint_H0 were taken from Simcyp compound profiles, which are extrapolated from in vitro data for the respective relevant metabolic enzymes for these drugs [30].
In addition, Table 4 summarizes the tissue:plasma partition coefficients for the three aforementioned xenobiotics estimated using Rodgers and Rowland equations [31, 32]. Given that the data on the fetoplacental tissue:plasma partition coefficient (KPreg:P) are not available from the literature, the same values as brain:plasma partition coefficients are assumed for the compartment of the fetoplacental unit for simulation. This is mainly based on their similar characteristics, such as high blood perfusion and existence of blood–tissue barriers. All of these tissue:plasma partition coefficients are assumed to be constant during pregnancy.
Table 4.
Tissue:plasma partition coefficients of caffeine, midazolam and metoprolol
| Tissue | Caffeine | Metoprolol | Midazolam |
|---|---|---|---|
| Adipose | 0.191 | 0.407 | 9.334 |
| Bone | 0.374 | 1.161 | 7.712 |
| Brain | 0.606 | 1.775 | 7.04 |
| Gut | 0.578 | 2.524 | 5.62 |
| Heart | 0.583 | 2.643 | 1.805 |
| Kidney | 0.597 | 2.475 | 2.725 |
| Liver | 0.57 | 3.379 | 3.4 |
| Lung | 0.62 | 1.553 | 0.728 |
| Muscle | 0.622 | 2.683 | 2.842 |
| Skin | 0.6 | 1.36 | 3.436 |
| Spleen | 0.591 | 2.732 | 2.757 |
| Fetoplacental unit* | 0.606 | 1.775 | 7.04 |
Assumed to be the same as that of brain.
Results
Caffeine pharmacokinetics profile
Simulated plasma caffeine concentrations for pregnant and nonpregnant women showed good agreement with the clinical observations (Figure 2). These plots demonstrated that the model replicated the observed higher plasma exposure obtained in pregnant women than in the nonpregnant women. A comparison of observed and predicted PK parameters for caffeine is given in Table 5.
Figure 2.

Simulated mean plasma total caffeine concentrations in nonpregnant (n = 4) and pregnant women (n = 8). , predictions; •, Brazier et al. [24]
Table 5.
Comparison between observed and simulated pharmacokinetic parameters
| Pregnant women | Nonpregnant women | Fold change from control | |||||||||||
|---|---|---|---|---|---|---|---|---|---|---|---|---|---|
| Observed | Predicted | Observed | Predicted | Observed | Predicted | ||||||||
| Drug | PK parameter | Mean (SD) | Mean (total) | Mean (unbound) | Ratio (predicted/observed) | Mean (SD) | Mean (total) | Mean (unbound) | Ratio (predicted/observed) | Mean (total) | Mean (unbound) | Ratio | |
| Caffeine 150 mg oral | n | 8 | 4 | ||||||||||
| Cmax (mg l–1) | 4.58 (1.2) | 3.26 | 2.67 | 0.71 | 6.02 (1.8) | 3.59 | 2.44 | 0.60 | ↓0.76 | ↓0.91 | ↑1.09 | 1.19 | |
| Tmax (h) | 1.5 | 1.5 | 1.5 | 1.00 | 0.75† | 0.97 | 1 | 1.29 | ↑2.00 | ↑1.55 | ↑1.5 | 0.77 | |
| AUC24h (mg l–1 h–1) | 52 | 47 | 36.41 | 0.91 | 26 | 24 | 16.36 | 0.92 | ↑2.00 | ↑1.96 | ↑2.23 | 0.98 | |
| CL (l h–1) | 2.86 (0.54) | 3.19‡ | – | 1.12 | 7.17 (2.43) | 6.25‡ | – | 0.87 | ↓0.40 | ↓0.51 | – | 1.28 | |
| Metoprolol 100 mg oral | n | 5 | |||||||||||
| Cmax (μg l–1) | 60 (61) | 126 | 120 | 2.10 | 180 (67) | 201 | 186 | 1.12 | ↓0.33 | ↓1.60 | ↓1.55 | 4.8 | |
| Tmax (h) | 1.7 (0.3) | 0.5 | 0.4 | 0.32 | 1.1 (0.8)† | 0.5 | 0.3 | 0.46 | ↑0.65 | 1.00 | ↓0.94 | 1.55 | |
| AUC12h (μg l–1 h–1) | 219 (277) | 414 | 391 | 1.89 | 835 (389) | 585 | 516 | 0.70 | ↓3.81 | ↓1.41 | ↓1.32 | 0.37 | |
| AUC12h (μg l–1 h–1)* | 188 (67) | 143 | 135 | 0.76 | 310 (89) | 164 | 144 | 0.22 | ↓1.65 | ↓1.15 | ↓1.07 | 0.70 | |
| CL (l h–1) | 573.6 (162) | 241.5‡ | – | 0.42 | 102.6 (23.4) | 170.9‡ | – | 1.67 | ↑5.59 | ↑1.41 | – | 0.25 | |
| Midazolam 2 mg oral | n | 13 | 13 | ||||||||||
| Cmax (μg l–1) | 6.4 (2.6) | 3.85 | 0.1 | 0.60 | 9.3 (2.0) | 6.48 | 0.3 | 0.70 | ↓1.45 | ↓1.68 | ↓2.05 | 1.16 | |
| Tmax (h) | 0.56 (0.15) | 0.36 | 0.36 | 0.65 | 0.54 (0.14)† | 0.39 | 0.38 | 0.72 | ↑0.96 | ↓1.08 | ↓1.05 | 1.12 | |
| AUC6h (μg l–1 h–1) | 9.5 (4.3) | 7.05 | 0.23 | 0.74 | 17.9 (6) | 10.8 | 0.42 | 0.60 | ↓1.88 | ↓1.53 | ↓1.86 | 0.81 | |
| CL (l h–1) | 252 (108) | 284‡ | – | 1.13 | 120 (36) | 185‡ | – | 1.54 | ↑2.10 | ↑1.54 | – | 0.73 | |
AUC, area under the concentration-time profile; CL, clearance; Cmax, the maximum concentration; n, number of women; Tmax, the time at which Cmax occurs.
For 10 mg intravenous formulation.
Calculated from dose/AUC24h for caffeine, dose/AUC12h for metoprolol and dose/AUC6h for midazolam.
Metoprolol pharmacokinetics profile
Simulated metoprolol concentration–time profiles were comparable to the observation obtained for metoprolol level in both pregnant and nonpregnant women (Figure 3). The simulated profiles for the intravenous dose indicated a lower AUC12h for the pregnant (143 ng ml−1 h−1) compared with the nonpregnant women (164 ng ml−1 h−1). A similar trend for the AUC12h was also found for the oral dose, 414 ng ml−1 h−1 for pregnant and 585 ng ml−1 h−1 for nonpregnant women.
Figure 3.

Simulated mean plasma total metoprolol concentrations in pregnant and nonpregnant women after administration of a 10 mg intravenous (upper two figures) or a 100 mg oral (lower two figures) single dose of metoprolol. , predictions; , Hogstedt et al. [28] (n = 5)
Calculated pharmacokinetic parameters of metoprolol from simulated profiles are given in Table 5, in comparison with those obtained for clinical profiles.
Midazolam pharmacokinetics profile
Midazolam simulation results are shown in Figure 4. The model was able to describe the elimination profiles of midazolam and the overall lower exposure in pregnant compared with nonpregnant women; however, the distribution phase was underpredicted. The model prediction for the AUC6h was 7.1 μg l−1 h−1, which is lower than that in the control group (10.8 μg l−1 h−1). This corresponds to 35% difference between the two groups. Comparison of the PK parameters obtained for the simulated profiles with those from clinical study are given in Table 5.
Figure 4.

Simulated mean plasma total midazolam concentrations in pregnant and nonpregnant women. , predictions; •, Hebert et al. [29] (n = 13)
Total vs. unbound pharmacokinetic profiles in pregnancy
As shown in Figures 5 and 6 and also in Table 5, there is a big difference between the total plasma concentration and the unbound plasma concentration for midazolam. However, the AUC ratios and Cmax ratios of all three drugs for pregnancy/nonpregnancy assessed using unbound concentrations showed only a slight difference relative to the corresponding values based on total concentrations, with the exception of midazolam (a highly bound drug). According to simulation results of various ‘what-if’ scenarios, different contributions of time-dependent changes in plasma protein binding and enzyme activity were observed. In the case of caffeine and metoprolol, a change in the enzyme activity during pregnancy had a big impact on AUC, but not on Cmax. In the case of midazolam, the contribution of enzyme activity was similar to that of protein binding. As shown in Figure 6, the impact of a change in protein binding on Cmax and AUC could be in the opposite direction from that for the enzyme activity (the caffeine case).
Figure 5.
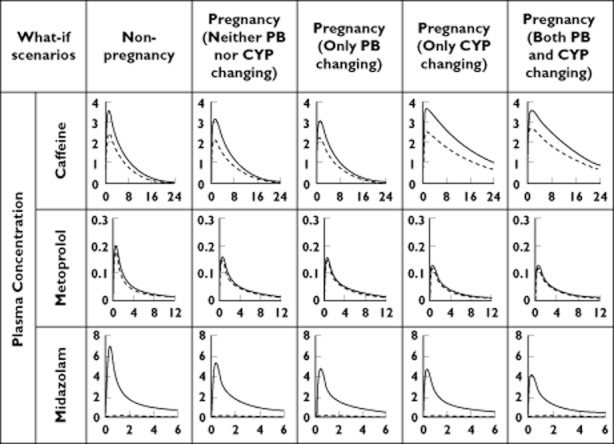
Comparison of total plasma concentrations (continuous lines) to unbound plasma concentrations (dashed lines) in different ‘what-if’ scenarios accounting for changes of plasma protein binding (PB) and/or metabolism (CYP) during pregnancy. The horizontal axis is time (in hours). The vertical axis is plasma concentration (in mg l–1 for caffeine and metoprolol and in ng ml–1 for midazolam). All the scenarios are based on the same oral dose of 150 mg for caffeine, 100 mg for metoprolol and 2 mg for midazolam
Figure 6.

Contributions of changes to plasma protein binding and metabolism during pregnancy to variation of Cmax and AUC during pregnancy. Dark grey columns are based on the total plasma concentration and pale grey columns are based on the unbound plasma concentration
Discussion
The p-PBPK model developed here considers the gestational time-dependent parameters, which is a major advance on previous models according to a recent review [16] that enables the simulation of kinetics at any stage of pregnancy. This is, to our knowledge, the first p-PBPK model incorporating time-dependent activity of cytochrome P450 enzymes that is parameterized dynamically throughout pregnancy (as opposed to the discrete option of pregnant vs. nonpregnant status).
Previously developed p-PBPK models suffer from uncertainty in many of their parameters that account for the gestational time-dependent parameters. Therefore, various growth equations were used to generate the unavailable data [20, 33–37]. The assumption used for many values, such as constant metabolism throughout pregnancy, limits their application to a specific compound at specific gestational times. Unlike these models, the proposed p-PBPK model in the present study was parameterized based on meta-analyses of combined physiological values (particularly those of enzyme activity for CYP1A2, CYP3A4 and CYP2D6) that vary throughout the gestational period [3]. These features enable the model to predict the pharmacokinetics of drugs eliminated via combination of the three enzymes studied and renal excretion at any time point during the pregnancy (personal correspondence, Alice Ke, University of Washington).
The structure of the current PBPK model is different from those of previous models, because the focus here was the maternal exposure. Andrew's model consists of 20 maternal compartments and 16 fetal compartments [20], while Luecke's model is comprised of 26 maternal compartments and 15 embryo/fetal compartments [33]. The latter was formulated as a set of 41 differential equations, while there are only 14 differential equations in the current model. The simplification in the current model reduces the uncertainty stemming from fetal physiological parameters; however, as a result of this simplification no concentration estimate in the fetal compartments can be made.
The model was validated using three different probes, namely caffeine, midazolam and metoprolol. Despite the limitations related to the small validation set, the focus on drugs that are predominantly metabolized by a single enzyme, and assumptions regarding absence of changes in gut wall metabolism (see later discussion), it appears that the model could form the nucleus for further development and, moreover, it identifies the knowledge gaps to be addressed.
Irrespective of the small study size for caffeine (four nonpregnant and eight pregnant women), the model is able to describe the concentration profiles of caffeine in pregnant and nonpregnant women (Figure 2). The model predicted a twofold increase in caffeine exposure near term compared with that in nonpregnant women. The AUC24h increased from 24 mg l−1 h−1 in nonpregnant women to 50 mg l−1 h−1 near term. These values are consistent with the reported values for nonpregnant vs. pregnant women (26 vs. 52 mg l−1 h−1) [24]. This increase in AUC corresponds to a twofold decrease in total clearance [24, 25], most probably because of the decrease in CYP1A2 activity during pregnancy [38, 39]. In both study arms, the predictability of the constructed model to give similar PK parameters is given in Table 5.
The obtained lower AUC12h of metoprolol for pregnant women compared with the control group was in agreement with clinical studies showing higher clearance of metoprolol during pregnancy. During pregnancy, metoprolol clearance, CLi.v., was increased from 39.0 ± 10.7 l h−1 in five nonpregnant women to 82.8 ± 34.9 l h−1 in five pregnant women at term [28]. This increase in clearance during pregnancy results from increased hepatic metabolism of metoprolol [28] due to increased CYP2D6 activity during gestation [39, 40]. Data from those five women shows a 39% decrease in the AUC after intravenous administration and 47% after oral administration of metoprolol in pregnant women compared with nonpregnant women, while our simulation shows a decrease of 13% for intravenous administration and 35% for an oral dose (Table 5). This could be explained partly by the small size of the clinical study (n = 5) and the knowledge that the activity of CYP2D6 is highly variable among individuals and controlled by genetic factors [41, 42]. Information on individual CYP2D6 polymorphisms was neither reported in the original paper nor included in the model.
For midazolam, the p-PBPK model underpredicted the maximal concentrations in both groups of pregnant and nonpregnant women (Figure 4); however, the predicted values lie within the reported range. The model predicted a 35% difference in the AUC6h between pregnant (7.1 μg l−1 h−1) and nonpregnant values (10.8 μg l−1 h−1). This difference is consistent with the clinical 46.9% difference calculated for the first 6 h after drug administration.
An underprediction of Cmax occurred for caffeine. However, the Cmax prediction could be improved by modifying the parameter setting of the first-order absorption, where three parameters are used, namely fa (fraction available for absorption from dosage form), ka (first-order absorption rate constant) and Fg (gut availability). As given in Table 3, for caffeine, fa = 1, Fg = 1 and ka = 2.18 h−1, while for midazolam, fa = 0.88, Fg = 0.59 and ka = 3.04 h−1. It is noteworthy that the current p-PBPK model and its simulation used only these default values provided by the Simcyp Simulator, which does not include any information from the three clinical pregnancy studies that were considered in this report.
As pharmacological effects are related to the unbound drug concentration, clinical consideration should be given to the possibility that pregnant women may need a change of dose if the exposure to unbound concentration changes (e.g. midazolam). Consideration of the total midazolam ratios for AUC and Cmax suggests that a bigger dose increase is needed in pregnancy than necessary. For drugs with a higher fraction unbound, such as caffeine (fu = 0.68) and metoprolol (fu = 0.88) in this study, both the total and the unbound ratios suggest that a similar magnitude of dose decrease and increase, respectively, is needed for these drugs. The utilization of a p-PBPK model to undertake ‘what-if’ simulations is useful to predict the changes in unbound drug concentration that are likely to occur during pregnancy and, subsequently, to provide information to guide dosing recommendations.
In general, model predictions for caffeine, midazolam and metoprolol demonstrated a good performance when compared against the clinical observations. The current model was developed to describe drug disposition in maternal organs; hence, no effort was made to model the fetoplacental unit in detail within the model structure. Nonetheless, the fetoplacental compartment was semi-mechanistic in that its volume and the blood flow from the maternal circulation were time dependent. The ‘dummy’ nature of the compartment and assumption on its homogeneity without subdivision into fetus, placenta, membranes, amniotic fluid and the umbilical cord, prevent any extrapolation to interpret the concentration within the fetoplacental unit. This could be considered in a future expansion of the model to consider both maternal and fetal exposure.
An assumption was made that the partition coefficient for this fetoplacental compartment is the same as that for the brain compartment. This assumption was made on the basis that the barriers to these tissues share some similar physiological and biochemical functions. Drug-metabolizing enzymes and transporters are expressed both in the placenta [43–45] and in the brain [46–49] and have a similar function in each organ; however, their significance is related to local kinetics rather than overall exposure in the body. Both of these barriers comprise anatomically tight subbarriers [46, 50, 51]. As the make-up of the placental barrier changes over the course of pregnancy [51], the assumed constant value of fetoplacental tissue:plasma partition coefficient may need mechanistic description, most probably, as a gestational time-varying parameter. From the sensitivity analysis of Cmax, Tmax and AUC in plasma and in the fetoplacental compartment with respect to the partition coefficient of the fetoplacental compartment (Appendix S1), it was observed that the system concentration is insensitive to this parameter, while the the fetoplacental compartment exposure to caffeine depends on this parameter.
Further sensitivity analysis on the impact of gestational age shows that both the plasma AUC and the pregnancy tissue AUC increased during pregnancy, with respect to the same oral caffeine consumption (Appendix S2). Both AUCs peaked at 35 weeks of gestation. In particular, the plasma AUC at this gestational age was twofold higher than prepregnancy (49.6 vs. 24.0 mg l−1 h). Visibly, the rate of increase in the pregnancy tissue AUC was larger in the first trimester compared with that in the second or third trimester.
Another short-coming of the current model was related to assumptions on constant metabolism in the gut wall throughout pregnancy. This may not have any impact on caffeine and metoprolol (which are metabolized by CYP1A2 and CYP2D6); however, sensitivity of the changes to gut wall metabolism requires some investigation for drugs such as midazolam (a CYP3A4 substrate) and other drugs with varying gut wall metabolism. As the value of Fg is dependent on the enterocytic blood flow of the gut wall, the permeability clearance of the gut wall, as well as the intrinsic metabolic clearance of the gut wall, PK prediction of the compounds with gut wall metabolism (midazolam is a representative compound) could be improved by considering the gut wall metabolism. The gut wall metabolism might be changing throughout pregnancy.
Finally, considerations for individual variability are not part of the model. Once the interindividual variability is added to model parameters, the model will be more useful in its ability to assist study design for clinical investigations of PK and dosage requirements during any specific gestational time period.
Conclusions
A simple, perfusion-limited compartmental PBPK model has been developed for Caucasian healthy pregnant women, which describes the kinetics in various stages of gestation. Time-dependent profiles for three major metabolizing enzymes, CYP1A2, CYP2D6 and CYP3A4, were included in the model and validated using three different sets of pharmacokinetic data in the pregnant women. Potential extensions to the model and further validation may include drugs with multiple elimination pathways, drugs with variable levels of gut wall metabolism and assessment of fetal exposure.
Acknowledgments
This project was partly funded by an FSA (Food Standards Agency) grant (T01065) of the UK Government. We thank Dr Hora Soltani for consultation on pregnancy-related physiology and Mr James Kay for assistance with collecting the references and preparation of the manuscript.
Competing Interests
There are no competing interests to declare.
Supporting Information
Additional Supporting Information may be found in the online version of this article:
Appendix S1
Sensitivity analysis on KPreg:P (pregnancy tissue:plasma partition coefficient)
Appendix S2
Sensitivity analysis on GA (gestational age)
Please note: Wiley-Blackwell are not responsible for the content or functionality of any supporting materials supplied by the authors. Any queries (other than missing material) should be directed to the corresponding author for the article.
References
- 1.Anderson GD. Pregnancy-induced changes in pharmacokinetics: a mechanistic-based approach. Clin Pharmacokinet. 2005;44:989–1008. doi: 10.2165/00003088-200544100-00001. [DOI] [PubMed] [Google Scholar]
- 2.Hodge LS, Tracy TS. Alterations in drug disposition during pregnancy: implications for drug therapy. Expert Opin Drug Metab Toxicol. 2007;3:557–571. doi: 10.1517/17425225.3.4.557. [DOI] [PubMed] [Google Scholar]
- 3.Abduljalil K, Furness P, Johnson TN, Rostami-Hodjegan A, Soltani H. Physiological, anatomical and metabolic changes with gestational age during normal pregnancy: creating a database and analysing trends for parameters required in physiologically based pharmacokinetic modelling. Clin Pharmacokinet. 2012;51:365–396. doi: 10.2165/11597440-000000000-00000. [DOI] [PubMed] [Google Scholar]
- 4.Rodger MA, Makropoulos D, Walker M, Keely E, Karovitch A, Wells PS. Participation of pregnant women in clinical trials: will they participate and why? Am J Perinatol. 2003;20:69–76. doi: 10.1055/s-2003-38318. [DOI] [PubMed] [Google Scholar]
- 5.McCullough LB, Coverdale JH, Chervenak FA. A comprehensive ethical framework for responsibly designing and conducting pharmacologic research that involves pregnant women. Am J Obstet Gynecol. 2005;193:901–907. doi: 10.1016/j.ajog.2005.06.020. [DOI] [PubMed] [Google Scholar]
- 6.Chambers CD, Polifka JE, Friedman JM. Drug safety in pregnant women and their babies: ignorance not bliss. Clin Pharmacol Ther. 2008;83:181–183. doi: 10.1038/sj.clpt.6100448. [DOI] [PubMed] [Google Scholar]
- 7.Herring C, McManus A, Weeks A. Off-label prescribing during pregnancy in the UK: an analysis of 18,000 prescriptions in Liverpool Women's Hospital. Int J Pharm Pract. 2010;18:226–229. doi: 10.1211/ijpp.18.04.0007. [DOI] [PubMed] [Google Scholar]
- 8.Rayburn WF, Turnbull GL. Off-label drug prescribing on a state university obstetric service. J Reprod Med. 1995;40:186–188. [PubMed] [Google Scholar]
- 9.Mattison D, Zajicek A. Gaps in knowledge in treating pregnant women. Gend Med. 2006;3:169–182. doi: 10.1016/s1550-8579(06)80205-6. [DOI] [PubMed] [Google Scholar]
- 10.Freeman MP, Nolan PE, Jr, Davis MF, Anthony M, Fried K, Fankhauser M, Woosley RL, Moreno F. Pharmacokinetics of sertraline across pregnancy and postpartum. J Clin Psychopharmacol. 2008;28:646–653. doi: 10.1097/JCP.0b013e31818d2048. [DOI] [PubMed] [Google Scholar]
- 11.Hostetter A, Stowe ZN, Strader JR, Jr, McLaughlin E, Llewellyn A. Dose of selective serotonin uptake inhibitors across pregnancy: clinical implications. Depress Anxiety. 2000;11:51–57. [PubMed] [Google Scholar]
- 12.Sit DK, Perel JM, Helsel JC, Wisner KL. Changes in antidepressant metabolism and dosing across pregnancy and early postpartum. J Clin Psychiatry. 2008;69:652–658. doi: 10.4088/jcp.v69n0419. [DOI] [PMC free article] [PubMed] [Google Scholar]
- 13.Center for Drug Evaluation Research. Guidance for Industry: Establishing Pregnancy Exposure Registries. Rockville: Food and Drug Administration, US Department of Health and Human Services; 2002. pp. 1–24. Available at http://www.fda.gov/downloads/Drugs/GuidanceComplianceRegulatoryInformation/Guidances/UCM071639.pdf (last accessed March 2012) [Google Scholar]
- 14.Center for Drug Evaluation Research. Guidance for Industry, Pharmacokinetics in Pregnancy – Study Design, Data Analysis, and Impact on Dosing and Labeling. Rockville: Food and Drug Administration, US Department of Health and Human Services; 2004. pp. 1–14. Available at http://www.fda.gov/downloads/Drugs/GuidanceComplianceRegulatoryInformation/Guidances/UCM072133.pdf (last accessed March 2012) [Google Scholar]
- 15.Committee for Medicinal Products for Human Use. Guideline on the Exposure to Medicinal Products during Pregnancy: Need for Post-Authorisation Data. London: European Medicines Agency; 2005. pp. 1–21. Available at http://www.ema.europa.eu/docs/en_GB/document_library/Regulatory_and_procedural_guideline/2009/11/WC500011303.pdf (last accessed March 2012) [Google Scholar]
- 16.Gaohua L, Abduljalil K, Jamei M, Johnson TN, Soltani H, Rostami-Hodjegan A. Physiologically-based pharmacokinetic (PBPK) models for assessing the kinetics of xenobiotics during pregnancy: achievements and shortcomings. Curr Drug Metab. 2012;13:695–720. doi: 10.2174/138920012800840374. [DOI] [PubMed] [Google Scholar]
- 17.Luecke RH, Wosilait WD, Pearce BA, Young JF. A computer model and program for xenobiotic disposition during pregnancy. Comput Methods Programs Biomed. 1997;53:201–224. doi: 10.1016/s0169-2607(97)00020-5. [DOI] [PubMed] [Google Scholar]
- 18.Clewell HJ, Gearhart JM, Gentry PR, Covington TR, VanLandingham CB, Crump KS, Shipp AM. Evaluation of the uncertainty in an oral reference dose for methylmercury due to interindividual variability in pharmacokinetics. Risk Anal. 1999;19:547–558. doi: 10.1023/a:1007017116171. [DOI] [PubMed] [Google Scholar]
- 19.Corley RA, Mast TJ, Carney EW, Rogers JM, Daston GP. Evaluation of physiologically based models of pregnancy and lactation for their application in children's health risk assessments. Crit Rev Toxicol. 2003;33:137–211. doi: 10.1080/713611035. [DOI] [PubMed] [Google Scholar]
- 20.Andrew MA, Hebert MF, Vicini P. Physiologically based pharmacokinetic model of midazolam disposition during pregnancy. Conf Proc IEEE Eng Med Biol Soc. 2008;2008:5454–5457. doi: 10.1109/IEMBS.2008.4650448. [DOI] [PubMed] [Google Scholar]
- 21.Pilari S, Preusse C, Huisinga W. Gestational influences on the pharmacokinetics of gestagenic drugs: a combined in silico, in vitro and in vivo analysis. Eur J Pharm Sci. 2011;42:318–331. doi: 10.1016/j.ejps.2010.12.003. [DOI] [PubMed] [Google Scholar]
- 22.Jamei M, Marciniak S, Feng K, Barnett A, Tucker GT, Rostami-Hodjegan A. The Simcyp® Population-Based ADME Simulator. Expert Opin Drug Metab Toxicol. 2009;5:211–223. doi: 10.1517/17425250802691074. [DOI] [PubMed] [Google Scholar]
- 23.Luecke RH, Wosilait WD, Young JF. Mathematical modeling of human embryonic and fetal growth rates. Growth Dev Aging. 1999;63:49–59. [PubMed] [Google Scholar]
- 24.Brazier JL, Ritter J, Berland M, Khenfer D, Faucon G. Pharmacokinetics of caffeine during and after pregnancy. Dev Pharmacol Ther. 1983;6:315–322. doi: 10.1159/000457332. [DOI] [PubMed] [Google Scholar]
- 25.Aldridge A, Bailey J, Neims AH. The disposition of caffeine during and after pregnancy. Semin Perinatol. 1981;5:310–314. [PubMed] [Google Scholar]
- 26.Knutti R, Rothweiler H, Schlatter C. Effect of pregnancy on the pharmacokinetics of caffeine. Eur J Clin Pharmacol. 1981;21:121–126. doi: 10.1007/BF00637512. [DOI] [PubMed] [Google Scholar]
- 27.Parsons WD, Pelletier JG. Delayed elimination of caffeine by women in the last 2 weeks of pregnancy. Can Med Assoc J. 1982;127:377–380. [PMC free article] [PubMed] [Google Scholar]
- 28.Hogstedt S, Lindberg B, Peng DR, Regardh CG, Rane A. Pregnancy-induced increase in metoprolol metabolism. Clin Pharmacol Ther. 1985;37:688–692. doi: 10.1038/clpt.1985.114. [DOI] [PubMed] [Google Scholar]
- 29.Hebert MF, Easterling TR, Kirby B, Carr DB, Buchanan ML, Rutherford T, Thummel KE, Fishbein DP, Unadkat JD. Effects of pregnancy on CYP3A and P-glycoprotein activities as measured by disposition of midazolam and digoxin: a University of Washington specialized center of research study. Clin Pharmacol Ther. 2008;84:248–253. doi: 10.1038/clpt.2008.1. [DOI] [PubMed] [Google Scholar]
- 30.Rostami-Hodjegan A, Tucker GT. Simulation and prediction of in vivo drug metabolism in human populations from in vitro data. Nat Rev Drug Discov. 2007;6:140–148. doi: 10.1038/nrd2173. [DOI] [PubMed] [Google Scholar]
- 31.Rodgers T, Leahy D, Rowland M. Physiologically based pharmacokinetic modeling 1: predicting the tissue distribution of moderate-to-strong bases. J Pharm Sci. 2005;94:1259–1276. doi: 10.1002/jps.20322. [DOI] [PubMed] [Google Scholar]
- 32.Rodgers T, Rowland M. Physiologically based pharmacokinetic modelling 2: predicting the tissue distribution of acids, very weak bases, neutrals and zwitterions. J Pharm Sci. 2006;95:1238–1257. doi: 10.1002/jps.20502. [DOI] [PubMed] [Google Scholar]
- 33.Luecke RH, Wosilait WD, Pearce BA, Young JF. A physiologically based pharmacokinetic computer model for human pregnancy. Teratology. 1994;49:90–103. doi: 10.1002/tera.1420490205. [DOI] [PubMed] [Google Scholar]
- 34.Luecke RH, Wosilait WD, Young JF. Mathematical analysis for teratogenic sensitivity. Teratology. 1997;55:373–380. doi: 10.1002/(SICI)1096-9926(199706)55:6<373::AID-TERA3>3.0.CO;2-Z. [DOI] [PubMed] [Google Scholar]
- 35.Young JF, Branham WS, Sheehan DM, Baker ME, Wosilait WD, Luecke RH. Physiological ‘constants’ for PBPK models for pregnancy. J Toxicol Environ Health. 1997;52:385–401. doi: 10.1080/00984109708984072. [DOI] [PubMed] [Google Scholar]
- 36.Young JF. Physiologically-based pharmacokinetic model for pregnancy as a tool for investigation of developmental mechanisms. Comput Biol Med. 1998;28:359–364. doi: 10.1016/s0010-4825(98)00024-9. [DOI] [PubMed] [Google Scholar]
- 37.Andrew MA, Hebert MF, Vicini P. Physiologically Based Pharmacokinetic (PBPK) modeling of midazolam disposition in pregnant and postpartum women. Abstract 1760. Berlin: Population Approach Group in Europe, Nineteenth Meeting, 8-11 June 2010. Available at http://www.page-meeting.org/?abstract=1760 (last accessed March 2012) [DOI] [PubMed]
- 38.Tsutsumi K, Kotegawa T, Matsuki S, Tanaka Y, Ishii Y, Kodama Y, Kuranari M, Miyakawa I, Nakano S. The effect of pregnancy on cytochrome P4501A2, xanthine oxidase, and N-acetyltransferase activities in humans. Clin Pharmacol Ther. 2001;70:121–125. doi: 10.1067/mcp.2001.116495. [DOI] [PubMed] [Google Scholar]
- 39.Tracy TS, Venkataramanan R, Glover DD, Caritis SN. Temporal changes in drug metabolism (CYP1A2, CYP2D6 and CYP3A Activity) during pregnancy. Am J Obstet Gynecol. 2005;192:633–639. doi: 10.1016/j.ajog.2004.08.030. [DOI] [PubMed] [Google Scholar]
- 40.Wadelius M, Darj E, Frenne G, Rane A. Induction of CYP2D6 in pregnancy. Clin Pharmacol Ther. 1997;62:400–407. doi: 10.1016/S0009-9236(97)90118-1. [DOI] [PubMed] [Google Scholar]
- 41.Laurent-Kenesi MA, Funck-Brentano C, Poirier JM, Decolin D, Jaillon P. Influence of CYP2D6-dependent metabolism on the steady-state pharmacokinetics and pharmacodynamics of metoprolol and nicardipine, alone and in combination. Br J Clin Pharmacol. 1993;36:531–538. doi: 10.1111/j.1365-2125.1993.tb00411.x. [DOI] [PMC free article] [PubMed] [Google Scholar]
- 42.Kaila N, Straka RJ, Brundage RC. Mixture models and subpopulation classification: a pharmacokinetic simulation study and application to metoprolol CYP2D6 phenotype. J Pharmacokinet Pharmacodyn. 2007;34:141–156. doi: 10.1007/s10928-006-9038-9. [DOI] [PubMed] [Google Scholar]
- 43.Syme MR, Paxton JW, Keelan JA. Drug transfer and metabolism by the human placenta. Clin Pharmacokinet. 2004;43:487–514. doi: 10.2165/00003088-200443080-00001. [DOI] [PubMed] [Google Scholar]
- 44.Myllynen P, Immonen E, Kummu M, Vahakangas K. Developmental expression of drug metabolizing enzymes and transporter proteins in human placenta and fetal tissues. Expert Opin Drug Metab Toxicol. 2009;5:1483–1499. doi: 10.1517/17425250903304049. [DOI] [PubMed] [Google Scholar]
- 45.Vahakangas K, Myllynen P. Drug transporters in the human blood-placental barrier. Br J Pharmacol. 2009;158:665–678. doi: 10.1111/j.1476-5381.2009.00336.x. [DOI] [PMC free article] [PubMed] [Google Scholar]
- 46.Prat A, Biernacki K, Wosik K, Antel JP. Glial cell influence on the human blood-brain barrier. Glia. 2001;36:145–155. doi: 10.1002/glia.1104. [DOI] [PubMed] [Google Scholar]
- 47.de Boer AG, van der Sandt IC, Gaillard PJ. The role of drug transporters at the blood-brain barrier. Annu Rev Pharmacol Toxicol. 2003;43:629–656. doi: 10.1146/annurev.pharmtox.43.100901.140204. [DOI] [PubMed] [Google Scholar]
- 48.Virgintino D, Errede M, Girolamo F, Capobianco C, Robertson D, Vimercati A, Serio G, Di Benedetto A, Yonekawa Y, Frei K, Roncali L. Fetal blood-brain barrier P-glycoprotein contributes to brain protection during human development. J Neuropathol Exp Neurol. 2008;67:50–61. doi: 10.1097/nen.0b013e31815f65d9. [DOI] [PubMed] [Google Scholar]
- 49.Dutheil F, Dauchy S, Diry M, Sazdovitch V, Cloarec O, Mellottee L, Bieche I, Ingelman-Sundberg M, Flinois JP, de Waziers I, Beaune P, Decleves X, Duyckaerts C, Loriot MA. Xenobiotic-metabolizing enzymes and transporters in the normal human brain: regional and cellular mapping as a basis for putative roles in cerebral function. Drug Metab Dispos. 2009;37:1528–1538. doi: 10.1124/dmd.109.027011. [DOI] [PubMed] [Google Scholar]
- 50.Ambrosi G, Virgintino D, Benagiano V, Maiorano E, Bertossi M, Roncali L. Glial cells and blood-brain barrier in the human cerebral cortex. Ital J Anat Embryol. 1995;100(Suppl. 1):177–184. [PubMed] [Google Scholar]
- 51.Riquelme G. Review: placental syncytiotrophoblast membranes–domains, subdomains and microdomains. Placenta. 2011;32(Suppl. 2):S196–202. doi: 10.1016/j.placenta.2011.01.002. [DOI] [PubMed] [Google Scholar]
Associated Data
This section collects any data citations, data availability statements, or supplementary materials included in this article.