

Abstract
Purpose
To compare the diagnostic accuracy of MR elastography and anatomic MR imaging features in the diagnosis of severe hepatic fibrosis and cirrhosis.
Materials and Methods
Three readers independently assessed presence of morphological changes associated with hepatic fibrosis in 72 patients with liver biopsy including: caudate to right lobe ratios, nodularity, portal venous hypertension (PVH) stigmata, posterior hepatic notch, expanded gallbladder fossa and right hepatic vein caliber. Three readers measured shear stiffness values using quantitative shear stiffness maps (elastograms). Sensitivity, specificity and diagnostic accuracy of stiffness values and each morphological feature were calculated. Inter-reader agreement was summarized using weighted kappa statistics. Intra-class correlation coefficient was used to assess inter-reader reproducibility of stiffness measurements. Binary logistic regression was used to assess inter-reader variability for dichotomized stiffness values and each morphological feature.
Results
Using 5.9 kPa as a cut-off for differentiating F3–F4 from F0–2 stages, overall sensitivity, specificity and diagnostic accuracy for MR elastography were 85.4%, 88.4 % and 87% respectively. Overall inter-reader agreement for stiffness values was substantial, with insignificant difference (p=0.74) in the frequency of differentiating F3–4 from F0–2 fibrosis. Only hepatic nodularity and PVH stigmata showed moderately high overall accuracy of 69.4% and 72.2%. Inter-reader agreement was substantial only for PVH stigmata, moderate for C/R m, deep notch and expanded gallbladder fossa. Only posterior hepatic notch (p=0.82) showed no significant difference in reader rating.
Conclusion
MR elastography is a non-invasive, accurate and reproducible technique compared with conventional features of detecting severe hepatic fibrosis.
Keywords: liver, fibrosis, cirrhosis, magnetic resonance elastography, morphological features
INTRODUCTION
Cirrhosis represents the end result of chronic injury to the liver from a variety of causes. Histologically the injury is characterized by progressive parenchymal fibrosis which, together with nodular regeneration, leads to hepatic architectural disorganization and dysfunction. The cirrhotic liver develops characteristic morphological changes. Previous studies have found high diagnostic accuracy in detection of advanced fibrosis on imaging studies using features such as increased caudate to right hepatic lobe ratio based on atrophy of the right hepatic lobe and hypertrophy of lateral segment of the left hepatic lobe and caudate lobe (atrophy - hypertrophy complex) (1–3), parenchymal nodularity and linear/reticular enhancement (4), portal venous hypertension stigmata (varices, ascites and splenomegaly), the expanded gallbladder fossa sign (5,6), the posterior hepatic notch sign (7), and decreased right hepatic vein caliber (8) amongst others.
Biopsy is currently the gold standard for the diagnosis of fibrosis and cirrhosis. However, most patients would prefer to have a non-invasive test rather than a biopsy, because of the potential for procedural pain and complications such as bleeding, pneumothorax, biliary tree puncture and death (approximately 1 in 10,000–12,000) (9). Biopsy has a significant sampling error of up to 14.5–25% when determining presence or absence of cirrhosis and fibrosis score variability (10–11). Biopsy also suffers from poor reproducibility (10, 12), and variability in sample scoring by pathologists (13). Thus, a reproducible and non-invasive test is warranted to evaluate the presence and progression of chronic liver disease and to monitor treatment (14). A number of noninvasive imaging techniques have been considered to diagnose hepatic fibrosis. These include dynamic contrast-enhanced magnetic resonance imaging (DCE MRI), functional MRI such as diffusion-weighted imaging, and magnetization transfer contrast MRI (15). However, none of these imaging techniques have been shown to be either sensitive or specific in the detection of early but clinically significant hepatic fibrosis (15).
Recently MR elastography has been developed to non-invasively image the viscoelastic mechanical properties (elasticity or stiffness) of tissue in vivo (14). As the liver becomes firm due to fibrosis, the resulting changes in viscoelastic properties can be measured as changes in shear stiffness by MR elastography (15, 16). A number of recent studies have shown MR elastography to be an accurate method of diagnosing and staging hepatic fibrosis (17–20). This multi-reader study compares the ability of MR elastography in diagnosing hepatic fibrosis and cirrhosis with that of traditional morphological imaging parameters. We also want to assess the reproducibility of the interpretations of these morphologic imaging features and MR elastography using different readers.
MATERIALS AND METHODS
Patient Population
This retrospective study was institutional review board (IRB) approved and Health Insurance Portability and Accountability Act (HIPAA) compliant. Informed written consent was obtained for acquisition of MR elastography. Between October 2008 and June 2011, a database that included all MR elastography exams yielded 242 consecutive patients with suspected or established liver dysfunction. We excluded 170 patients: one hundred and forty two patients who did not have biopsy confirmation within 1 year of the MR imaging exam, nine patients with prior liver transplants in whom the results of MR elastography may be less reliable due to possible changes of acute transplant rejection and other causes not related to fibrosis which may affect the stiffness values compared with normal liver (18), six patients in whom there was poor wave penetration on MR elastography images, one patient who had portal venous thrombosis which may affect the stiffness of the liver, and twelve patients who had hemochromatosis, in whom stiffness measurements were unreliable. Seventy-two patients, all of whom had liver biopsy, constituted the study cohort.
The study included 38 males (mean age: 53.6 ± 11.3 years) and 34 females (mean age: 53.4 ± 12.7 years). The average interval between the MR elastography and liver biopsy was 4.3 ± 3.6 months. Etiologies for liver dysfunction included 28 patients (38.9%) with hepatitis C, of which 16 had cirrhosis; 6 patients (8.3%) with unspecified cirrhosis; 9 patients (12.5%) with primary sclerosing cholangitis, of which 1 patient had cirrhosis; 7 patients (9.7%) with abnormal liver enzymes; 7 patients (9.7%) with autoimmune hepatitis, of which 3 had cirrhosis; single patients with alcohol-related cirrhosis, non-alcoholic steatohepatitis, primary biliary cirrhosis, Wilson’s disease, cystic fibrosis, glycogen storage disorder, and sarcoidosis.
Seven of the 72 patients had therapy with Peg interferon and Ribavirin for an average of 48 weeks. Two of the seven had stopped therapy two weeks prior to the MRE. None of the patients were on antiviral or other therapy at the time of the MRE. Four of the seven patients were deemed non-responders to therapy.
MR (Including MR Elastography) Imaging Technique
All exams were performed on 1.5-T MR system (Magnetom Espree, Siemens Health care, Erlangen, Germany). A flexible six-element phased array matrix coil (anterior) and 6-elements of a spine matrix coil (posterior) were used for signal reception. Anatomical MR protocol consisted of: breath-hold axial and coronal T2-weighted half-Fourier acquisition single-shot turbo spin echo (HASTE), axial T2 fat suppressed (FS), axial and coronal fat suppressed gradient echo unenhanced images, double echo chemical shift gradient-echo images, axial diffusion (b values of 50,500, and 1000 sec/mm2) and apparent diffusion coefficient (ADC) map. Contrast-enhanced imaging was performed after intravenous power injection bolus administration of gadopentetate dimeglumine (0.1 mmol kg−1 Magnevist; Bayer HealthCare Berlin, Germany) at a rate of 2 ml s−1 followed by 20 ml saline flush with a power injector (Spectris; Medrad Warrendale, PA). After contrast injection, axial arterial phase (scan time based on fluoroscopy-preparation timing sequence), axial portal venous phase, and delayed axial (45–60 sec and 2–5 minutes) and coronal (90 sec) sequences were obtained.
Magnetic Resonance Elastography
To perform MRE, an external 60 Hz acoustic vibration was supplied by a Resoundant system (Mayo Clinic, Rochester, MN U.S.A). The system consisted of an active driver, located outside the magnet room, which generated continuous low frequency vibration. These vibrations were transmitted via a flexible tube to a drum-like passive driver (19-cm diameter, 1.5 cm thick flat and disc shaped), which was placed directly against the anterior right chest wall over the liver and held in place by an abdominal binder. The propagating shear waves were imaged with a modified phase difference gradient-echo sequence which incorporated first moment nulled motion encoding gradients sensitive to through-plane motion. The Resoundant system was synchronized to these gradients via a trigger provided by the imager. The trigger time was stepped to provide a sample of the propagating wave field at four different phase offsets. The parameters of the MR elastography sequence were as follows: repetition time (TR)/echo time (TE), 50/24.2 msec; flip angle, 15°; bandwidth, 260 Hz/pixel; imaging frequency, 63.5 MHz; acquisition matrix, 256 × 64; section thickness, 5 mm; field of view (FOV), 390×390 mm2. The scanning time of each trans-axial slice was 21–29 seconds with breath-hold. Four trans-axial slices at different anatomic levels were acquired. The resulting phase difference images for each slice were processed using an offline inversion algorithm (MSDI, Mayo Clinic, Rochester, MN), and the elastic shear modulus map of the liver (elastogram) was subsequently generated (19, 21–23).
Image Interpretation
Three radiologists independently evaluated the MR elastograms and were blinded to clinical and histological information. They had less than three years experience in interpreting MR elastography, as it is a new technique. Imaging analysis of the morphologic imaging characteristics was also performed by three radiologists with different levels of expertise (10, 6, and 3 years) in abdominal MRI. Each reader reviewed the relevant articles related to the standard definitions of imaging characteristics and reviewed ten cases for training purposes in a separate setting. Two sets of different readers read either the conventional or MRE exams. One radiologist who performed both stiffness measurement and image analysis did so with a break of 4 weeks between the two measurements. Images for all 72 patients were viewed on a PACS workstation (National Display Systems with Centricity package © 2006 GE Medical Systems, Barrington, IL, U.S.A).
MR Elastography Analysis
Three round/oval-shaped (2–3 cm wide) regions of interest (ROI) were placed on the right lobe of liver using conventional MR images. When placing a ROI, care was taken to avoid bile ducts and large vessels within the liver, motion artifacts, the region immediately below the driver, and the left lobe of liver (which is prone to suboptimal wave penetration). For the measurement of shear stiffness using MR elastography, the ROIs were first visually transposed onto the wave images to ensure that they were placed in regions with adequate wave quality. A region was determined to have adequate wave quality if the propagating waves had both good amplitude and the presence of a clear dominant propagation direction. Subsequently the ROI locations were visually transposed onto the quantitative elastogram image and mean stiffness values (in kilopascals, kPa) were calculated. Overall stiffness value of the heterogeneous liver was calculated by averaging the mean value of shear stiffness for each slice. Per slice agreement of shear stiffness between two readers was compared.
Morphological Analysis
Hepatic Measurements
Axial and coronal delayed contrast-enhanced T1-fat suppressed gradient echo images with shared prepulses (SHARP) or three dimensional volume interpolated breath-hold examination (VIBE) were used for the hepatic anatomical measurements. If the landmarks for measurement were not optimally seen on one image or no intravenous contrast was given, other sequences displaying the landmarks were used. When the portal vein bifurcation was in between slices, the caudal slice was selected (24).
Measurement Of Caudate/Right Lobe Using The Lateral Edge Of Main Portal Vein (C/R-m) And Caudate/Right Lobe Using Lateral Edge Of Right Portal Vein (C/R-r)
Using axial image three parallel lines were drawn through right lateral wall of the bifurcation of the main portal vein, medial edge of the caudate lobe and lateral edge of the bifurcation of the right portal vein respectively. A line is drawn perpendicularly to the above lines midway between the main portal vein and inferior vena cava. Using the main portal vein distance C is the width of the caudate lobe and distance R is the width of the right lobe. Using the right portal vein, distance C′ is the width of the caudate lobe and distance R′ is the width of right lobe. The ratio of C to R is the C/R m, and that of C′ to R′ is C/R r (1, 24).
Other Morphological Features
The expanded gallbladder fossa sign is enlargement of the peri-cholecystic space bounded laterally by the right hepatic lobe and medially by the left lateral segment, in conjunction with non-visualization of the left medial segment (6). The posterior hepatic notch sign (Figure 1) is a sharp notch in the posterior surface of the liver (7). Parenchymal nodularity with or without linear signal intensity abnormalities and features of portal venous hypertension (varices, splenomegaly and ascites) were also noted. Splenomegaly was considered present when the splenic length was ≥13 cm (25). The right hepatic vein caliber (RHVC) was measured as close as possible to its confluence with the inferior vena cava and considered reduced if < 5 mm (8). Each reader also gave an overall final subjective impression of whether cirrhosis was present or absent after reviewing the images.
Figure 1.
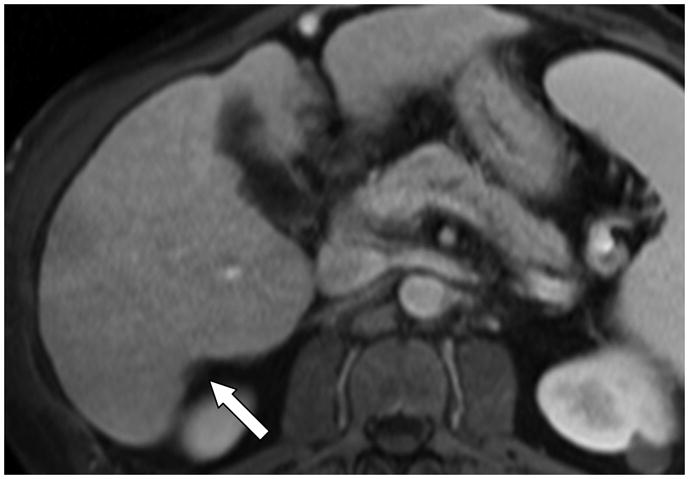
Axial contrast enhanced T1 fat suppressed gradient echo recalled image in a 55-year-old man with known cirrhosis, shows a sharp indentation (posterior hepatic notch sign) in the posterior margin of the right hepatic lobe (arrow).
Histological Analysis
Liver tissue was processed the same day of the biopsy in the histological laboratory of the Department of Pathology. H&E and trichrome stained slides were reviewed by an attending hepato-pathologist who was blinded to clinical information and MR imaging results in all cases. When grading the fibrosis, areas with large portal tracts or subcapsular fibrotic tissues were excluded. Assessment of fibrosis was performed according to METAVIR scoring system for patients with chronic viral disease and autoimmune hepatitis. Specifically, fibrosis was divided into 5 stages: F0, no fibrosis; F1, mild fibrosis (portal fibrosis without septa); F2, moderate fibrosis (portal fibrosis with rare septa); F3, bridging fibrosis (numerous septa connecting portal and/or central areas); F4, cirrhosis (thick septa with well formed regenerative nodules) (13). In addition the Brunt system was used for fibrosis staging in patients with non-alcoholic steato-hepatitis (NASH) (26) and the Batts and Ludwig system for those with cholestatic liver (27).
Statistical Analysis
F3 and F4 were combined to represent severe fibrosis and cirrhosis, while F0–F2 stages were combined to represent lesser stages of fibrosis. Mean stiffness value of 5.9 kPa was chosen as a cut off value to dichotomize mean stiffness values (18). The quantitative imaging features were dichotomized as follows: C/R m ≥ 0.65, C/R r ≥ 0.9 and reduced RVHC if < 5 mm. Qualitative morphological features were dichotomized based on visual assessment (i.e. present or absent). Weighted kappa (k) statistics were used to show inter-reader agreement for dichotomized stiffness values and each morphological feature, where k: ≤ 0.21 slight agreement; 0.21–0.4 fair agreement; 0.41–0.60 moderate agreement; 0.61–0.80 substantial agreement; ≥ 0.81 excellent agreement. Frequency distribution of dichotomized stiffness values and each imaging feature per reader was determined. Binary logistic regression was then used to assess inter-reader variability for dichotomized stiffness values and each morphological feature; p value was calculated using Wald statistics (28). Mc Nemar’s test was used to compare reader scoring of each morphological parameter and dichotomized stiffness value with histology in differentiating severe fibrosis and cirrhosis (F3–4) from lesser stages (F0–2). Intra-class correlation coefficient (ICC) was used to assess reproducibility and agreement of the MR elastography measurements between readers. The following degrees of agreement were used for ICC: > 0.9, excellent; > 0.8, good; > 0.7, acceptable; > 0.6, questionable; and > 0.5, poor. The significance level was set at p < 0.05. Paired t test and Lin’s concordance correlation coefficient (ñc) was used for assessing per slice agreement between readers in measuring the shear stiffness values. Statistical analyses were performed using MedCalc for Windows, version 9.6.4.0 (MedCalc Software, Mariakerke, Belgium 2010).
RESULTS
Histological Analysis
The average liver biopsy sample length was 20.8 ± 2.0 mm. The distribution of fibrosis for the 72 patients based on histology was: stage 4 (n=26); stage 3 (n=6); stage 2 (n=6); stage 1 and mild/non-specific inflammation (n=34; 5 of 34 patients showed normal histology).
MR Elastography Analysis
Using 5.9 kPa as the cut-off, the sensitivity, specificity and accuracy were calculated for each reader as: X 78%, 90%, 84.7%; Y 90.6%, 90%, 90.3% and Z 84.4%, 85%, 84.7% respectively. Overall sensitivity, specificity and accuracy were 85.4% (CI 95% 78.3 – 92.4), 88.4% (CI 95% 84.1 – 92.7), 87% (CI 95% 85.1 – 88.8), respectively. Figure 2 shows overall inter-reader agreement for stiffness values was substantial, with insignificant difference (p=0.74) in the frequency of differentiating F3–4 from F0–2 fibrosis. All readers correctly assessed a far greater percentage of stiffness values with respect to histology, compared with morphological features. Intra-class correlation was found to be: reader X and Y, 0.968; reader Y and Z, 0.8; reader X and Z, 0.74; (p<0.001). Overall inter-reader agreement for dichotomized stiffness values was substantial k=0.79 (95% CI: 0.76 – 0.82). Readers’ measurements on per slice comparison were comparable (p=0.09) with excellent concordance correlation coefficient (ñc = 0.959, p < 0.001). Five of thirty-two patients (15.6%) with stage 3 or 4 on liver biopsy had no morphologic findings of cirrhosis but had elevated pressures on MR elastography. One patient with clinical findings of congestive cardiac failure, but not cirrhosis, had an elevated stiffness (6 kPa), which could be considered a false positive case.
Figure 2.

Graph showing no significant difference in reader pattern of assigning stiffness values (p=0.74). Overall inter-reader agreement was substantial with k: 0.79 (CI 95% 0.72–0.86).
Morphological Feature Analysis
Table 1 details multi-reader sensitivity, specificity and accuracy of each morphological feature in the detection of severe fibrosis and cirrhosis. Sensitivity, specificity and accuracy for the overall impression of the diagnosis of cirrhosis of the three readers were: reader A: 78%, 75%, 76.4%; B: 81.3%, 70%, 75%; and C: 100%, 22.5%, 56.9%. Figure 3 shows frequency distribution of ratings for morphological features, with significant differences in the pattern of reader rating distribution for five of seven imaging features. Only posterior hepatic notch sign (p=0.82) was comparable in reader rating. Readers’ rating for portal venous hypertension (p=0.056) showed borderline significant difference. Hepatic nodularity and PVH stigmata showed moderately high overall accuracy of 69.4% and 72.2% respectively. Table 2 displays overall reader agreement for each morphological feature given by kappa (k) with confidence interval. Overall agreement was substantial only for PVH stigmata (k=0.678) and moderate for C/R m, deep notch (k=0.53 each) and expanded gallbladder fossa (k=0.44).
Table 1.
Diagnostic performance of each of the morphological features in detecting severe fibrosis/cirrhosis.
| Sensitivity | Specificity | Accuracy | |||||
|---|---|---|---|---|---|---|---|
| Reader A | Impression | 78.1% | 25/32 | 75% | 30/40 | 76.4% | 55/72 |
| Reader B | Impression | 81.3% | 26/32 | 70% | 28/40 | 75% | 54/72 |
| Reader C | Impression | 100% | 32/32 | 22.5% | 9/40 | 56.9% | 41/72 |
| Reader A | C/R r | 37.5% | 12/32 | 35% | 14/40 | 36.1% | 26/72 |
| Reader B | C/R r | 15.6% | 5/32 | 92.5% | 37/40 | 58.3% | 42/72 |
| Reader C | C/R r | 50% | 16/32 | 40% | 16/40 | 44.4% | 32/72 |
| Reader A | C/R m | 50% | 16/32 | 65% | 26/40 | 58.3% | 42/72 |
| Reader B | C/R m | 25% | 8/32 | 75.6% | 31/40 | 54.2% | 39/72 |
| Reader C | C/R m | 62.5% | 20/32 | 55% | 22/40 | 58.3% | 42/72 |
| Reader A | Nodules | 78.1% | 25/32 | 82.5% | 33/40 | 80.6% | 58/72 |
| Reader B | Nodules | 84.4% | 27/32 | 70.2% | 28/40 | 76.4% | 55/72 |
| Reader C | Nodules | 100% | 32/32 | 12.5% | 5/40 | 51.3% | 37/72 |
| Reader A | Notch | 50% | 16/32 | 82.5% | 33/40 | 68.1% | 49/72 |
| Reader B | Notch | 53% | 17/32 | 85% | 34/40 | 70.8% | 51/72 |
| Reader C | Notch | 37.5% | 12/32 | 80% | 32/40 | 61.1% | 44/72 |
| Reader A | GBF | 28.1% | 9/32 | 85% | 34/40 | 59.7% | 43/72 |
| Reader B | GBF | 62.5% | 20/32 | 72.5% | 29/40 | 68% | 49/72 |
| Reader C | GBF | 21.8% | 7/32 | 80% | 32/40 | 54.2% | 39/72 |
| Reader A | PVH | 65.6% | 21/32 | 77.5% | 31/40 | 72.2% | 52/72 |
| Reader B | PVH | 65.6% | 21/32 | 87.5% | 35/40 | 77.8% | 56/72 |
| Reader C | PVH | 75% | 24/32 | 60% | 24/40 | 66.7% | 48/72 |
| Reader A | RHVC < 5 | 40.6% | 13/32 | 57.5% | 23/40 | 50% | 36/72 |
| Reader B | RHVC < 5 | 62.5% | 20/32 | 45% | 18/40 | 52.8% | 38/72 |
| Reader C | RHVC < 5 | 9.3% | 3/32 | 85% | 34/40 | 51.3% | 37/72 |
Figure 3.


Figure 3 (a–g) Graphs show reader variability in rating distribution for each morphological feature. Positive and negative bars indicate percentage of the correct and incorrect assignment respectively, of the presence of a morphological feature compared with histology.
Figure 3 (a) Rating distribution of caudate to right lobe ratio (using right portal vein) showing significant inter-reader difference, p<0.001.
Figure 3 (b) Rating distribution of caudate to right lobe ratio (using main portal vein) showing significant inter-reader difference, p=0.033.
Figure 3 (c) Rating distribution of liver nodularity showing significant inter-reader difference, p<0.001.
Figure 3 (d) Rating distribution of posterior hepatic notch showing no significant inter-reader difference, p=0.822.
Figure 3 (e) Rating distribution of expanded gallbladder fossa showing significant inter-reader difference, p=0.004.
Figure 3 (f) Rating distribution of portal venous hypertension stigmata shows borderline significant inter-reader difference, p=0.056.
Figure 3 (g) Rating distribution of right hepatic vein caliber showing significant inter-reader difference, p<0.001.
Table 2.
Kappa values representing inter-reader agreement for each morphological feature.
| Feature | Reader A and B | Reader A and C | Reader B and C | Overall |
|---|---|---|---|---|
| C/R r | −0.05 (−0.2, 0.09) | 0.53 (0.34, 0.72) | 0.08 (−0.05, 0.21) | 0.18 (−0.56 to 0.94) |
| C/R m | 0.56 (0.35, 0.77) | 0.60 (0.41, 0.78) | 0.44 (0.25, 0.63) | 0.53 (0.32 to 0.74) |
| Nodules | 0.75 (0.6, 0.9) | 0.10 (0.01, 0.2) | 0.16 (0.03, 0.30) | 0.33 (−0.55 to 1.22) |
| Notch | 0.54 (0.34, 0.73) | 0.55 (0.35, 0.75) | 0.50 (0.29, 0.72) | 0.53 (0.46 to 0.59) |
| GBF | 0.46 (0.27, 0.65) | 0.58 (0.35, 0.81) | 0.28 (0.07, 0.43) | 0.44 (0.06 to 0.82) |
| PVH | 0.77 (0.62, 0.92) | 0.67 (0.51, 0.83) | 0.62 (0.46, 0.78) | 0.68 (0.49 to 0.87) |
| RHV<5 mm | 0.43 (0.23, 0.63) | 0.23 (0.046, 0.41) | 0.11 (−0.025, 0.24) | 0.25 (−0.14 to 0.65) |
Numbers in parentheses are 95% confidence intervals.
DISCUSSION
Development of hepatic fibrosis and cirrhosis is insidious, evolves gradually, and patients are often asymptomatic. Early accurate and non-invasive diagnosis of cirrhosis is vital as cirrhosis is associated with significant complications such as variceal hemorrhage, renal failure, hepatic encephalopathy and hepatocellular carcinoma (HCC). Those with cirrhosis should undergo more frequent surveillance for the development of HCC (29). Also, there is mounting evidence that fibrosis can regress in many chronic liver diseases, especially after treatment with antiviral medications, making early diagnosis of fibrosis important (30). The distinction of mild (F1–F2) from advanced or severe fibrosis (F3–F4) is important as patients with severe fibrosis are more likely to have complications such as varices and require screening for hepatocellular carcinoma.
MR elastography has been confirmed to be a highly accurate diagnostic test in differentiating severe fibrosis from lesser stages of the disease (17–20). Figures 4 and 5 are specific examples where MRE was superior to assessment using conventional morphologic feature methods in its sensitivity to fibrosis. In the current study 15.6% (5 of 32) with stage 3 or 4 fibrosis on liver biopsy having elevated stiffnesses on MR elastography showed normal morphological features. Although the readers had different levels of expertise in body MRI, our study shows MR elastography to be highly reproducible as shown by a high intra-class correlation coefficient, kappa values and no significant difference in frequency of stiffness value distribution between the readers. A recent small reproducibility study for the MR elastography exam showed the standard deviation of stiffness measurements on the same subject on different days using the same machine and reader was low (11.9%) (31). The MR Elastography acquisitions used in this study required longer than optimal breath-holds which may have resulted in unwanted motion in the later acquired phase offsets. To reduce sensitivity to this bulk motion, the technique employs first moment nulled motion encoding gradients and considers all four phase offsets together in the inversion algorithm, actually providing some redundancy. Bulk motion in one temporal sample would not significantly alter the result. In subsequent studies, using parallel imaging techniques, the acquisitions have been shortened to more tolerable breath-hold durations.
Figure 4.
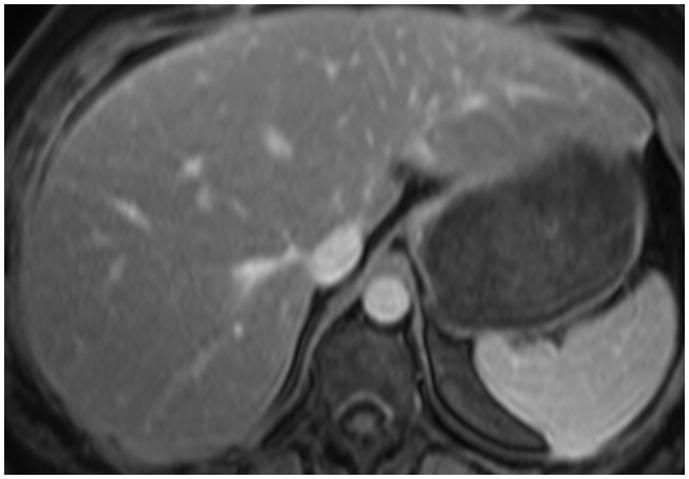

Figure 4 (a) Axial contrast-enhanced fat-suppressed T1 gradient echo in a 48-year-old female with known history of non-alcoholic steatohepatitis (NASH) showing normal hepatic morphology.
Figure 4 (b) Elastogram shows significantly elevated pressures with mean 6.4 kPa. Biopsy showed stage 3 fibrosis.
Figure 5.


Figure 5 (a) Axial contrast-enhanced fat-suppressed T1 gradient echo image in a 29-year-old male with chronic hepatitis C, shows normal hepatic morphology without definitive findings of cirrhosis.
Figure 5 (b) Elastogram shows elevated pressures with mean 7.6 kPa from severe fibrosis.
In the current study, stages F 3–4 and F 0–2 were taken to represent severe fibrosis and cirrhosis and mild to moderate inflammation and fibrosis, respectively. In differentiating stages F ≤ 2 and F ≥ 3, using MR elastography with a cutoff of 5.9 kPa, sensitivity, specificity, and accuracy for readers in the current study ranged from 78–84.4%, 85–90% and 84.7–90.3% respectively. In comparison to MR elastography, the sensitivity, specificity and accuracy for subjective impression of cirrhosis of the 3 readers in this study using imaging features ranged from 78–100%, 23–75%, and 57–76% respectively. In the current study, sensitivity and specificity of MRE of 85.4% and 88.4% respectively in differentiating stages F0–2 from F3–4 compares favorably with that of a previous studies by Yin et al and Huwart et al with a sensitivity and specificity 78% and 96% and 91 and 97% respectively. Table 3 illustrates diagnostic performance of conventional imaging markers from previous studies.
Table 3.
Diagnostic performance of previous studies using single morphological feature in the diagnosis of cirrhosis.
| Morphological feature | Sensitivity/Specificity/Accuracy (%) | Population | n | Imaging modality | Reference |
|---|---|---|---|---|---|
| C/R ratio ≥ 0.65 | 84/100/93.8 | Cirrhotic/normal | 81 | US, CT | 1 |
| C/R lobe ratio ≥ 0.65 | 43/100/79 | Cirrhotic, CLD, normal | 181 | US | 2 |
| Expanded gallbladder fossa | 68/98/98 | Cirrhotic, normal | 313 | MR | 6 |
| Right posterior hepatic notch | 72/98/82 | Cirrhotic, normal | 330 | MR | 7 |
| Modified C/R ratio ≥ 0.9 | 71.7/77.4/74.2 | Cirrhotic, normal | 236 | MR | 24 |
| Surface nodularity | 87.5/81.5/45 | Abnormal LFT with biopsy | 70 | US | 33 |
CLD, chronic liver disease; LFT, liver function tests
In our study, the results of the evaluation of the morphological criteria were lower than that reported in the literature and the inter-observer agreement was not high. Despite having a large number of patients with cirrhosis and stage 1 fibrosis (which creates spectrum bias in terms of disease severity in the cohort), the performance of conventional imaging features still remained poor. Overall, five of the seven features showed a highest accuracy ≤ 67%. In this study, the caudate to right lobe ratio using the lateral edge of main portal vein ≥ 0.65 (C/R m) had moderate overall inter-reader agreement (k: 0.53) with overall accuracy of 56.9% (CI 95% 51–62.8). This is significantly lower than the accuracy of 79–94% reported in previous studies (1, 2). The caudate to right lobe ratio using the lateral edge of the right portal vein > 0.9 (C/R r) had a lower accuracy of 36–58 % compared to 74% in the study by Awaya (24) and there was only slight inter-reader agreement (k: 0.18). The posterior hepatic notch sign showed an overall accuracy of 66.6% (CI 95% 54.2–79.1) compared with 82% found by Ito (7). The inter-reader agreement was moderate (k=0.53). For the expanded gallbladder fossa sign, the three reader accuracy of 54–68% was lower than the 80% in a study by Ito (6). The overall accuracy of stigmata of portal venous hypertension was 72.2% (CI 95% 58.4–86) and there was substantial inter-observer agreement (k=0.68). In our study, using hepatic vein diameter of < 5 mm in the detection of severe fibrosis, the accuracies were low 51.3 % (CI 95% 47.8–54.8) with only fair inter-observer agreement (k: 0.25). The lower results of our study for the morphological imaging criteria may be explained by the fact that the readers’ morphological analysis was performed independently, rather than in consensus, which we believe better reflects everyday practice.
MR elastography has significant advantages such as sampling multiple liver cross-sections, which is far more representative of the hepatic parenchyma than a single liver biopsy. Unlike sonographic elastography, MR elastography does not require an acoustic window and is not operator dependent (15). In addition, MR elastography is relatively unaffected by the patient’s body habitus and the presence of ascites, as shear waves generated in-vivo in MR elastography have good hepatic penetration (15). Disadvantages of MR elastography include inaccuracy in patients with hemochromatosis because of signal to noise limitations using gradient echo sequences (32), although newer sequences are being developed (14).
Two technical limitations of MR elastography were noted in this study. First, shear wave propagation is not always homogenous throughout the liver and through each of the four acquired slices. If the wave propagation is not adequate through a slice, that slice cannot be used for shear stiffness evaluation. As MR elastography is a new technique, further development of this technique is likely, hopefully leading to more accurate shear stiffness measurements (15). Second, sometimes shear stiffness values were falsely elevated in the region just below the passive driver. This artifact is suggested when focal elevated measurements are seen in anterior liver below the level of the driver but not in the remainder of the slice. Measurements in this region were not included in the calculations if this artifact was present.
In conclusion, MRE is more reliable than the use of conventional imaging in the diagnosis of severe fibrosis and cirrhosis. MRE may allow direct measurements of liver parenchymal changes whereas the morphological changes are secondary changes. Underlying fibrosis may or may not manifest as changes in the hepatic morphology and the manifestation of morphological features may be variable. Additionally, assessment of some morphological features may be subjective. Non-invasive modalities such as MR elastography with its superior diagnostic accuracy can diagnose severe fibrosis and cirrhosis with high confidence and reproducibility, thus potentially eliminating the need for a liver biopsy and its associated complications.
Acknowledgments
The authors thank Dr. Richard Ehman and his colleagues at the Mayo Clinic for their development of the MR technology used in this study.
This work was partially supported by grant EB001981 from the National Institute of Health.
Abbreviations
- C/R m
caudate to right lobe ratio using the lateral edge of the main portal vein
- C/R r
caudate to right lobe ratio using the lateral edge of the right portal vein
- GBF
gallbladder fossa
- PVH
portal venous hypertension
- RHVC
right hepatic vein caliber
References
- 1.Harbin WP, Robert NJ, Ferrucci JT., Jr Diagnosis of cirrhosis based on regional changes in hepatic morphology: a radiological and pathological analysis. Radiology. 1980;135(2):273–83. doi: 10.1148/radiology.135.2.7367613. [DOI] [PubMed] [Google Scholar]
- 2.Giorgio A, Amoroso P, Lettieri G. Cirrhosis: Value of caudate to right lobe ratio in diagnosis with US. Radiology. 1986;161:443–445. doi: 10.1148/radiology.161.2.3532188. [DOI] [PubMed] [Google Scholar]
- 3.Torres WE, Whitmire LF, Gedgaudas-McClees K, et al. Computed tomography of hepatic morphologic changes in cirrhosis of the liver. J Comput Assist Tomogr. 1986;10(1):47–50. doi: 10.1097/00004728-198601000-00009. [DOI] [PubMed] [Google Scholar]
- 4.Aguirre DA, Behling CA, Alpert E, et al. Liver fibrosis: Noninvasive diagnosis with double contrast material – enhanced MR imaging. Radiology. 2006;239(2):425–437. doi: 10.1148/radiol.2392050505. [DOI] [PubMed] [Google Scholar]
- 5.Fisher MR, Gore RM. Computed tomography in the evaluation of cirrhosis and portal hypertension. J Clin Gastroenterol. 1985;7(2):173–81. doi: 10.1097/00004836-198504000-00012. [DOI] [PubMed] [Google Scholar]
- 6.Ito K. Expanded gallbladder fossa: Simple MR imaging sign of cirrhosis. Radiology. 1999;211:723–726. doi: 10.1148/radiology.211.3.r99ma31723. [DOI] [PubMed] [Google Scholar]
- 7.Ito K, Mitchell DG, Kim MJ, Awaya H, Koike S, Matsunaga N. Right posterior hepatic notch sign: a simple diagnostic MR finding of cirrhosis. J Magn Reson Imaging. 2003;18(5):561–6. doi: 10.1002/jmri.10387. [DOI] [PubMed] [Google Scholar]
- 8.Zhang Y, Zhang XM, Prowda JC, et al. Changes in hepatic venous morphology with cirrhosis on MRI. J Magn Reson Imaging. 2009;29:1085–1092. doi: 10.1002/jmri.21718. [DOI] [PubMed] [Google Scholar]
- 9.Carey E, Carey WD. Noninvasive tests for liver disease, fibrosis, and cirrhosis: Is liver biopsy obsolete? Cleve Clin J Med. 2010;77(8):519–27. doi: 10.3949/ccjm.77a.09138. [DOI] [PubMed] [Google Scholar]
- 10.Regev A, Berho M, Jeffers LJ, et al. Sampling error and intraobserver variation in liver biopsy in patients with chronic HCV infection. Am J Gastroenterol. 2002;97(10):2614–8. doi: 10.1111/j.1572-0241.2002.06038.x. [DOI] [PubMed] [Google Scholar]
- 11.Bedossa P, Dargere D, Paradis V. Sampling variability of liver fibrosis in chronic hepatitis C. Hepatology. 2003;38:1449–1457. doi: 10.1016/j.hep.2003.09.022. [DOI] [PubMed] [Google Scholar]
- 12.Huwart L, Peeters F, Sinkus R, et al. Liver fibrosis: non-invasive assessment with MR elastography. NMR Biomed. 2006;19:173–179. doi: 10.1002/nbm.1030. [DOI] [PubMed] [Google Scholar]
- 13.Intraobserver and interobserver variations in liver biopsy interpretation in patients with chronic hepatitis C: the French METAVIR Cooperative Study Group. Hepatology. 1994;20:15–20. [PubMed] [Google Scholar]
- 14.Faria SC, Ganesan K, Mwangi I, et al. MR imaging of liver fibrosis: Current state of the art. RadioGraphics. 2009;29:1615–1635. doi: 10.1148/rg.296095512. [DOI] [PMC free article] [PubMed] [Google Scholar]
- 15.Yin M, Talwalkar JA, Glaser KJ, et al. Assessment of hepatic fibrosis with magnetic resonance elastography. Clin Gastroenterol Hepatol. 2007;5(10):1207–13. e2. doi: 10.1016/j.cgh.2007.06.012. [DOI] [PMC free article] [PubMed] [Google Scholar]
- 16.Talwalkar JA, Yin M, Fidler JL, Sanderson SO, Kamath PS, Ehman RL. Magnetic resonance imaging of hepatic fibrosis: emerging clinical applications. Hepatology. 2008;47(1):332–42. doi: 10.1002/hep.21972. [DOI] [PubMed] [Google Scholar]
- 17.Huwart L, Sempoux C, Salameh N, et al. Liver fibrosis: noninvasive assessment with MR elastography versus aspartate aminotransferase-to-platelet ratio index. Radiology. 2007;245:458–466. doi: 10.1148/radiol.2452061673. [DOI] [PubMed] [Google Scholar]
- 18.Wang Y, Ganger D, Levitsky J, et al. Assessment of chronic hepatitis and fibrosis: Comparison of MR elastography and diffusion-weighted imaging. AJR. 2011;196:553–561. doi: 10.2214/AJR.10.4580. [DOI] [PMC free article] [PubMed] [Google Scholar]
- 19.Rouviere O, Yin M, Dresner MA, et al. MR elastography of the liver: preliminary results. Radiology. 2006;240:440–448. doi: 10.1148/radiol.2402050606. [DOI] [PubMed] [Google Scholar]
- 20.Huwart L, Salameh N, ter Beek L, et al. MR elastography of liver fibrosis: preliminary results comparing spin-echo and echo-planar imaging. Eur Radiol. 2008;18:2535–2541. doi: 10.1007/s00330-008-1051-5. [DOI] [PubMed] [Google Scholar]
- 21.Manduca A, Oliphant TE, Dresner MA, et al. Magnetic resonance elastography: non-invasive mapping of tissue elasticity. Med Image Anal. 2001;5:237–54. doi: 10.1016/s1361-8415(00)00039-6. [DOI] [PubMed] [Google Scholar]
- 22.Muthupillai R, Lomas DJ, Rossman PJ, Greenleaf JF, Manduca A, Ehman RL. Magnetic resonance elastography by direct visualization of propagating acoustic strain waves. Science. 1995;269.5232:1854–7. doi: 10.1126/science.7569924. [DOI] [PubMed] [Google Scholar]
- 23.Taouli B, Ehman RL, Reeder SB. Advanced MRI methods for assessment of chronic liver disease. AJR. 2009;193:14–27. doi: 10.2214/AJR.09.2601. [DOI] [PMC free article] [PubMed] [Google Scholar]
- 24.Awaya H, Mitchell DG, Kamishima T, Holland G, Ito K, Matsumoto T. Cirrhosis: modified caudate-right lobe ratio. Radiology. 2002;224(3):769–74. doi: 10.1148/radiol.2243011495. [DOI] [PubMed] [Google Scholar]
- 25.Robertson F, Leander P, Ekberg O. Radiology of the spleen. Eur Radiol. 2001;11:80–95. doi: 10.1007/s003300000528. [DOI] [PubMed] [Google Scholar]
- 26.Brunt EM, Janney CG, Di Bisceglie AM, Neuschwander-Tetri BA, Bacon BR. Nonalcoholic steatohepatitis: a proposal for grading and staging the histological lesions. Am J Gastroenterol. 1999;94:2467–2474. doi: 10.1111/j.1572-0241.1999.01377.x. [DOI] [PubMed] [Google Scholar]
- 27.Batts KP, Ludwig J. Chronic hepatitis: an update on terminology and reporting. Am J Surg Pathol. 1995;9:1409–1417. doi: 10.1097/00000478-199512000-00007. [DOI] [PubMed] [Google Scholar]
- 28.Carrino J, Lurie JD, Tosteson ANA. Lumbar spine: Reliability of MR imaging findings. Radiology. 2009;250(1):161–170. doi: 10.1148/radiol.2493071999. [DOI] [PMC free article] [PubMed] [Google Scholar]
- 29.Bruix J, Sherman M. Management of hepatocellular carcinoma: An update. Hepatology. 2011;53(3):1020–1022. doi: 10.1002/hep.24199. [DOI] [PMC free article] [PubMed] [Google Scholar]
- 30.Friedman SL, Bansal MB. Reversal of hepatic fibrosis- Fact or fantasy? Hepatology. 2006;43(2 Suppl 1):S82–88. doi: 10.1002/hep.20974. [DOI] [PubMed] [Google Scholar]
- 31.Hines CDG, Bley TA, Lindstrom MJ, et al. Repeatability of magnetic resonance elastography for quantification of hepatic stiffness. JMRI. 2010;31:725–731. doi: 10.1002/jmri.22066. [DOI] [PMC free article] [PubMed] [Google Scholar]
- 32.Huwart L, Sempoux C, Vicaut E, et al. Magnetic resonance elastography for the non-invasive staging of liver fibrosis. Gastroenterology. 2008;135(1):32–40. doi: 10.1053/j.gastro.2008.03.076. [DOI] [PubMed] [Google Scholar]
- 33.Ferral H, Male R, Cardiel M, Munoz L, et al. Cirrhosis: Diagnosis by liver surface analysis with high-frequency ultrasound. Abdom Imaging. 1992;17(1):74–78. doi: 10.1007/BF01888512. [DOI] [PubMed] [Google Scholar]