

Abstract
This research aims to identify distinct courses of depressive symptoms among middle aged and older Americans and to ascertain how these courses vary by race/ethnicity. Data came from the 1995-2006 Health and Retirement Study which involved a national sample of 17,196 Americans over 50 years of age with up to six repeated observations. Depressive symptoms were measured by an abbreviated version of the Center for Epidemiologic Studies Depression scale. Semi parametric group based mixture models (Proc Traj) were used for data analysis. Six major trajectories were identified: (a) minimal depressive symptoms (15.9%), (b) low depressive symptoms (36.3%), (c) moderate and stable depressive symptoms (29.2%), (d) high but decreasing depressive symptoms (6.6%), (e) moderate but increasing depressive symptoms (8.3%), and (f) persistently high depressive symptoms (3.6%). Adjustment of time-varying covariates (e.g., income and health conditions) resulted in a similar set of distinct trajectories. Relative to white Americans, black and Hispanic Americans were significantly more likely to be in trajectories of more elevated depressive symptoms. In addition, they were more likely to experience increasing and decreasing depressive symptoms. Racial and ethnic variations in trajectory groups were partially mediated by SES, marital status, and health conditions, particularly when both interpersonal and intrapersonal differences in these variables were taken into account.
Keywords: Depressive Symptoms, Trajectory, Racial/Ethnic Difference, Hispanic
Introduction
Racial/Ethnic differences in depressive symptoms have been a subject of considerable interest. There is some evidence from cross-sectional studies that blacks and Hispanics have more depressive symptoms than whites (Bromberger, Harlow, Avis, Kravitz, & Cordal, 2004; Romero, Ortiz, Finley, Wayne, & Lindeman, 2005). According to recent longitudinal studies, non-whites or blacks have more depressive symptoms (Mirowsky & Kim, 2007; Kim & Durden, 2007) but are characterized by more moderate rates of change than white Americans (George & Lynch, 2003; Klein et al., 2008). In these studies, the focus was on the average change of depressive symptoms over time and how individuals deviate from this average. Nonetheless, changes in depressive symptoms can be quite heterogeneous, with some individuals experiencing declines or improvements in symptomatology over time and others remaining at stable levels of symptoms (Andreescu, Chang, Mulsant, & Ganguli, 2008). This suggests the need to examine not only the average trajectory of change but also its underlying heterogeneity. If heterogeneity is found, temporal variations in depressive symptoms can be understood as a number of distinct trajectories, which may vary by race/ethnicity.
Research on the multiple trajectories of depressive symptoms is emerging in recent years. There are numerous studies based on special populations including patients with depressive or personality disorders (Cuijpers, van Lier, van Straten & Donker, 2005; Gildengers et al. 2005; Vermote et al., 2009), elderly primary care patients (Cui, Lyness, Tang, Tu & Conwell, 2008), elderly women caregivers (Taylor, Ezell, Kuchibhatta, Ostbye & Clipp, 2008), and individuals who experienced bereavement (Aneshensel, Botticello & Yamamoto-Mitani, 2004; Bonanno, Wortman, Lehman, et al., 2002). Focusing on the natural history of depressive symptoms among middle aged and older adults, a few studies have yielded valuable insights (Aldwin, Spiro, Levenson & Cupertino, 2001; Andreescu et al., 2008; Jones & Peskin, 2009). For instance, they have identified multiple trajectories of depressive symptoms characterized by stability at various levels as well as changes in terms of improvement and deterioration. Factors differentiating these trajectories include gender, education, baseline physical and mental health status, health behavior, and personality attributes (Aldwin et al., 2001; Andreescu et al., 2008). However, it is difficult to generalize these findings to middle aged and older Americans in general or racial/ethnic minorities in particular. This is because there is no study of multiple trajectories of depressive symptoms which is based on data derived from a national probability sample of middle aged and older Americans over an extended period of observation (i.e., 10 years or longer). Nor is there any study focusing on the mechanisms underlying racial/ethnic variations in the multiple trajectories of depressive symptoms.
Hence, several important research questions remain unanswered. In particular, what are the long-term multiple courses of depressive symptoms among middle aged and older Americans? How do white, black, and Hispanic Americans differ in the probabilities of being in various trajectories of depressive symptoms? For example, are black and Hispanic Americans more likely to experience persistence in elevated depressive symptomatology than white Americans? Finally, can these racial/ethnic variations, if any, be explained by various confounding variables (e.g., age and gender) and/or mediating factors (e.g., education, marital status, and health status)?
Research addressing these questions may inform current theories of social stratification of aging and health in two respects. First, in longitudinal analyses, the population is often assumed to be homogeneous with respect to how the predictors operate on the outcomes. This assumption may not always be valid because trajectories often vary significantly in the direction of change (i.e., increasing, stable, or decreasing) and in their predictors (Raudenbush, 2001). In contrast, a pattern or person-centered approach emphasizes subgroup heterogeneity that reflects qualitatively distinct sub-patterns of changes (Nagin, 2005; Ryff, Singer, Love, & Essex, 1998). This approach would provide significant new insights concerning the heterogeneity underlying the average trajectory of change.
Second, by focusing on how white, black, and Hispanic Americans differ in associating with distinct trajectory groups, one would be able to further elaborate the mechanism underlying the social stratification of aging and health with respect to racial/ethnic variations in the dynamics of depressive symptoms in particular. Specifically, it provides us an opportunity to evaluate not only these trajectories across racial/ethnic groups but also whether the same mechanism applies to blacks, Hispanics, and whites.
In this study, we analyzed the multiple trajectories of depressive symptoms among middle age and old Americans, and examined how these trajectories vary by race/ethnicity. We used data derived from a nationally representative sample of Americans over 50 years of age with up to six repeated assessments over a period of 11 years. Dynamic models with both time-constant and time-varying covariates were employed to evaluate racial/ethnic variations in trajectories of depressive symptoms.
Hypotheses
According to Raudenbush (2001), the assumption that everyone is increasing (or decreasing) with respect to depression is not warranted. Many persons will never be high in depression, whereas others will always be high. In addition, some persons will be recovering from serious depression. Still others will become increasingly depressed, and perhaps another group will oscillate between high and low levels of depression. Together these divergent trajectories may offset one another, leading to the stability in the course of depressive symptoms observed in prior studies.
Our understanding of the heterogeneity of changes in depressive symptoms may be informed by two bodies of research: (a) resilience among adults, and (b) the natural history of late-life depression. Recent studies of resilience suggested that large numbers of people manage to endure the temporary upheaval of loss or potentially traumatic events remarkably well. For instance, chronic depression and distress tend to occur in 10% to 15% of bereaved individuals, whereas those who exhibited relatively low levels of depression or distress have consistently approached or exceeded 50% of the sample (Bonnanno, 2004). Accordingly, the levels of and rates of change in depressive symptoms can be expected to be relatively stable over time, particular among those without significant symptoms.
On the other hand, depression in elderly community and primary care populations has a poor prognosis (Cole, Bellavance, & Mansour, 1999). In a longitudinal study of depressed older adults, the average symptom severity remained above the 85th percentile of the population average for 6 years. Symptoms were short-lived or in remission for respectively 14% and 23% of depressed persons. In addition, 44% of the subjects had an unfavorable but fluctuating course and 32% went through a severe chronic course (Beekman, Geerlings, Deeg et al., 2002). Hence, among older depressed adults, there is a significant stability in depressive symptoms with limited numbers of remissions and recurrence observed as well.
Together findings from the studies of resilience and the natural history of depression are consistent with recent observations of interpersonal variations in changes in depressive symptoms. For example, whereas depressive symptoms in general increased moderately with time among Americans over 50 years of age, there are considerable interpersonal differences in the intercept and linear slope associated with the trajectory of depressive symptoms (Xu, Liang, Bennett, Quinones, & Ye, in press). Following a sample of 1,260 low income and education elderly people in rural southwestern Pennsylvania for up to 12 years, Andreescu et al. (2008) identified six trajectories of depressive symptoms, of which three were linear and three were quadratic. Although a significant proportion of the respondents had none or minimal depressive symptoms during the 12-year period of observation, others experienced either a substantial increase or reduction in symptoms. Data from elderly primary care patients in Western New York and community residents in the Netherlands yielded similar findings (Cui et al., 2008; Geerlings, Beekman, Deeg & van Tilburg, 2000). We hypothesize that the previously observed multiple courses of changes in depressive symptom can be extended to a nationally representative sample of middle aged and older Americans. In particular, there are multiple trajectories, perhaps five or six, along which depressive symptoms evolve over time with the majority experiencing few symptoms (Hypothesis 1 [H1]).
Racial/ethnic stratification, a system involving racial/ethnic groups interacting in patterns of dominance and subordination (Jackson, Antonucci, & Gibson, 1990; Williams, 1997), may influence physical and mental health through several mechanisms, including less advantaged socioeconomic position, poor access to and quality of health care, constraints placed on life style choices, or stress as a result of perception of discrimination (Crimmins, Hayward, & Seeman, 2004; Robert & House 2000). In addition, racial/ethnic minorities shoulder a disproportionate burden of diseases and disability (Centers for Disease Control and Prevention, 2005; Oliver & Muntaner, 2005). The impact of poor health may lead to diminished sense of control (Schulz, Heckhausen, & O’Brien, 1994; Shaw & Krause, 2001), thus inducing higher levels of depressive symptoms (George & Lynch, 2003; Mirowsky & Ross, 1992; Seligman & Altenor, 1980). Therefore, we hypothesize that blacks and Hispanics are more likely than whites to report elevated levels (Hypothesis 2a [H2a]). We are unaware of any research comparing Hispanics and blacks in the multiple trajectories of depressive symptoms. However, there is evidence that Hispanic elders exhibit greater depressive symptoms than older blacks (Blazer, 2003; Mui, 1993). Hence, we further postulate that Hispanics are more likely to have more elevated trajectories of depressive symptoms than blacks (Hypothesis 2b [H2b]).
Following the framework of racial/ethnic stratification of aging and health, we posit that race/ethnicity could affect the course of depressive symptoms changes indirectly via various psychosocial factors. Most longitudinal studies have shown that differences in the level of depressive symptoms between whites and blacks or non-whites diminished substantially when socioeconomic status (SES) and health were adjusted (Klein et al., 2008; Lynch & George 2002; Yang, 2007), although there are exceptions (Kim & Durden 2007; Skarupski et al., 2005). Hence, we hypothesize that racial/ethnic differences in trajectory groups of depressive symptoms are partially mediated by SES and health differentials. That is, the odds of following the various trajectories become more similar across black, Hispanic and white Americans, when major sources of stress and strain such as SES and health status are adjusted (Hypothesis 3 [H3]).
Methods
Design and data
Data came from the Health and Retirement Study (HRS), a longitudinal survey of middle aged and older Americans. The original HRS cohort started in 1992 with a national sample of over 12,600 persons born in 1931-1941. In 1993, the “Asset and Health Dynamics among the Oldest Old” (AHEAD) cohort was surveyed with a national sample of individuals aged 70 and over (i.e., born before 1923). Biennial follow-ups have been made of the HRS and AHEAD respondents thereafter. Starting from 1998, HRS and AHEAD surveys were fully integrated and two additional cohorts were added: Children of the Depression (CODA) – persons born in 1924-1930 and War Baby (WB) – persons born in 1942-1947. As of 2006, these four components of HRS yielded a nationally representative sample of respondents over 50 years of age. To overcome language barriers, a Spanish version of the questionnaire was administered by bilingual interviewers to Spanish-speaking respondents. Respondents who were unable to communicate adequately in either English or Spanish, and for whom interviews with proxy informants could not be obtained, were excluded from the HRS. Additional information regarding the HRS, including response rates and mortality, is available at its website (http://hrsonline.isr.umich.edu).
In the present study, baseline data were obtained from responses in 1995 for AHEAD, 1996 for HRS, and 1998 for CODA and WB. Follow-up data were gathered in 1998 (for AHEAD and HRS cohorts), 2000, 2002, 2004, and 2006. Hence, up to 5 or 6 repeated observations were obtained for each admission cohort over 8 to 11 years. HRS data collected in 1992 and 1994 and AHEAD data in 1993 were excluded because several key questions and their response options were asked differently.
A total of 22,185 individuals age 51 and older completed the baseline interviews. We excluded 734 respondents who reported a racial/ethnic group other than Hispanic, non-Hispanic white, or non-Hispanic black, 2,657 respondents with zero analytical weights (mostly age-ineligible spouses and respondents living outside the U.S. or institutionalized), and 905 respondents with proxy interviews. Our dynamic specifications required several time-varying covariates, including lagged measures and their changes between two adjacent waves. Therefore we further excluded 693 individuals who never responded to consecutive interviews between 1995 and 2006, because of insufficient information for deriving lagged covariates and change terms. The final analytical sample consisted of 17,196 individuals contributing to 64,674 observations. Of the 17,196 respondents, 7,799 (45.4%) responded at all 6 waves, whereas 3,594 (20.9%), 1,753 (10.2%), 1,994 (11.6%), and 2,056 (12.0%) responded respectively at 5, 4, 3, and 2 waves. Therefore, nearly 80% of the respondents completed at least four observations.
Measures
Depressive symptoms were measured by an abbreviated version of the Center for Epidemiologic Studies Depression (CES-D) scale. The scale composed of nine dichotomous items, each being a yes/no indicator measuring the respondent’s feelings much of the time over the week prior to the interview. The items included feeling depressed, feeling everything was an effort, sleep was restless, feeling lonely, feeling sad, could not get going, feeling happy, enjoying life, and having a lot of energy. A summary score (range: 0-9) was constructed with the positive items reverse coded such that a higher score indicating more negative affect.
Of the nine items, eight were from the original CES-D scale which has been shown to have an internal consistency and factor structure comparable to that of prior versions of the CES-D (Turvey, Wallace & Herzog, 1999). We included a ninth item (i.e., had a lot of energy), because “fatigue or loss of energy nearly every day” is one of the criteria for diagnosis of major depressive episode by the Diagnostic and Statistical Manual of Mental Disorders, 4th edition (DSM-IV). Furthermore, the “energy” item loads well on the common depression factor (Jones & Fonda, 2004). Our own analysis also demonstrated comparable internal reliability between the nine-item and eight-item CES-D scales (Cronbach’s alpha = 0.79 for both scales). The nine-item CES-D scale has been successfully used in prior research (Yang, Cazorla-Lancaster, & Jones, 2008).
Indicated by two dummy variables, race/ethnicity included three categories: non-Hispanic black and Hispanic with non-Hispanic white as the reference group. Non-Hispanic black and non-Hispanic white are referred to interchangeably as black and white. In addition, several measures of social stratification were included. Age differences were measured by age in 1995, and a dummy variable for gender (female =1) was created. Education was indexed by years of schooling. Respondents were grouped into quartiles according to their household income level at the baseline. Our analysis used a four-point scale to indicate each respondent’s household income level (1=lowest income quartile, 2=low-middle income quartile, 3=high-middle income quartile, and 4=highest income quartile). Baseline marital status was coded as a dichotomous variable (1 for married or living with a partner and 0 otherwise).
Several measures of health status were also included. In particular, diseases were a count of seven health conditions: heart disease, cancer, stroke, diabetes, hypertension, lung disease, and arthritis. Self-rated health was a single item rating of the respondent’s health (1=excellent, 2=very good, 3=good, 4=fair, and 5=poor). Functional status was represented by a count of difficulties with six activities of daily living (ADL) (dressing, walking, bathing or showering, eating, getting in or out of bed, and using the toilet) and five instrumental activities of daily living (IADLs) (preparing hot meals, grocery shopping, making phone calls, taking medications, and managing own money and expenses). A higher score (range: 0-11) represented greater functional impairment.
Data analysis
We used group-based, semi-parametric mixture models (hereafter referred to as group-based trajectory model) to identify distinct trajectories of depressive symptoms (Jones, Nagin & Roeder, 2001; Nagin, 2005). This approach includes two components. The first component is a basic group model which depicts individuals with similar trajectories. Trajectory parameters are derived by a latent class analysis through maximum likelihood estimation. In particular, the distinct trajectory groups are derived with the following specifications:
| (1) |
is a latent variable representing the depressive symptoms of individual i at a given assessment, T (e.g., 1998) for group membership g. Time refers to number of years since the baseline. β0g, and β1g are the coefficients associated with the intercept and rate of change in depressive symptoms, respectively, for individuals in group g. is a disturbance term assumed to be normally distributed with zero mean and constant variance.
Because the depressive symptoms measure can only vary between 0 and 9, we assumed a censored normal distribution for to account for possible floor and ceiling effects. It is linked to its observed but censored counterpart, as follows:
In identifying the distinct trajectories of depressive symptoms, linear as well as polynomial functions of time were examined. The time variable was centered at its grand mean to minimize multicollinearity, when polynomial functions of time were evaluated. Through a process similar to that of latent class analysis, parameters were estimated to define the shapes of the trajectories and their probabilities. The optimal number of trajectory groups was chosen on the basis of the Bayesian Information Criterion (BIC) score and an examination of the 99% confidence interval of adjacent trajectories.
In the second component of the group-based trajectory approach, the probabilities of trajectory group memberships were treated as the dependent variable predicted by the person level time-constant covariates in a fashion similar to a multinomial logistic regression analysis. To examine racial/ethnic differences in CES-D trajectories, we evaluated the following specifications:
| (5) |
where θg represents the parameters of a multinomial logistic model that captures the effects of time-constant covariates zi (e.g., race/ethnicity) on πg, the probability of membership in group g (Nagin, 2005, pp. 96-99). A SAS procedure, Proc Traj, was used to estimate the association of zi with πg (Equation 5), simultaneously with the identified trajectories (Equation 1) (Jones, Nagin & Roeder, 2001).
The HRS involves a national sample of households, augmented by oversamples of African Americans, Hispanics, and Floridians. Many of the attributes (e.g., race/ethnicity, age, marital status) upon which unequal selection probabilities were based were explicitly controlled in the multivariate analyses. When sampling weights are solely a function of independent variables included in the model, unweighted ordinary least squares (OLS) estimates are preferred because they are unbiased, consistent, and have smaller standard errors than weighted estimates (Winship and Radbill 1994). In addition, we undertook separate analyses with and without weighting (i.e., level 1 weights from the corresponding wave of interview and level 2 weights from the 1998 interview) and obtained very similar results from models without time-varying covariates. Hence we chose not to weight the data.
To address the concern for the over-abundance of significant results due to the massive sample (17,196 respondents with 64,674 observations), only estimates with a p value less than 0.01 were considered as being statistically significant.
Time-varying covariates
When studying health trajectories over an extended period of observation (e.g., 11 years as in our study), many of the covariates could change over time. Therefore, we conducted additional analyses by incorporating time-varying covariates in equation (1) as follows:
| (6) |
where XkiT are the kth time-varying covariates associated with individual i at time T. βkg refers to the coefficients associated with the effects of the time-varying covariates, for individuals in group g.
In our analysis, a number of covariates (i.e., household income, marital status, diseases, functional status, and self-rated health) could vary with time. To ensure a clear time sequence between the time-varying covariates and the outcome variable, our model included the lagged measure (i.e., observation from the last interview, Xt-1) and the change term (i.e., change in the value of the variable between the last interview and the present interview, ΔXt-1,t = Xt − Xt-1) for each of the time-varying covariates. For instance, marital status was included as a lagged covariate and as the change in status (-1 for dissolutions, 0 for no change, and 1 for the acquisition of a spouse/partner). Table 1 presents the descriptive statistics of all variables in our analysis. Similar to the model without time-varying covariates, the optimal number of trajectory groups was chosen on the basis of the BIC score and an examination of the 99% confidence interval of adjacent trajectories.
Table 1.
Descriptive statistics of time-varying and time constant covariates
| Time Varying Covariates | 1998 (n=13,139) |
2000 (n=14,999) |
2002 (n=13,185) |
2004 (n=12,139) |
2006 (n=11,212) |
|---|---|---|---|---|---|
| Depressive Symptoms | 2.09 ± 2.18 | 1.98 ± 2.13 | 1.92 ± 2.15 | 1.86 ± 2.14 | 1.89 ± 2.15 |
| Time since baseline (in years) | 2.36 ± 0.48 | 3.78 ± 1.07 | 5.75 ± 1.06 | 7.70 ± 1.04 | 9.67 ± 1.03 |
| Lagged marital status | 9,360 (71%) | 10,491 (70%) | 8,790 (67%) | 7,966 (66%) | 7,300 (65%) |
| Change in marital status | -0.02 ± 0.14 | -0.05 ± 0.27 | -0.03 ± 0.21 | -0.02 ± 0.20 | -0.03 ± 0.21 |
| Lagged household income (in quartile) a | 2.43 ± 1.08 | 2.49 ± 1.08 | 2.51 ± 1.08 | 2.44 ± 1.08 | 2.65 ± 1.28 |
| Change in household income (in quartile) a | -0.01 ± 0.76 | -0.02 ± 0.76 | -0.08 ± 0.76 | 0.18 ± 1.47 | -0.05 ± 1.69 |
| Lagged self-rated health | 2.66 ± 1.13 | 2.80 ± 1.13 | 2.70 ± 1.09 | 2.75 ± 1.08 | 2.81 ± 1.08 |
| Change in self-rated health | 0.25 ± 0.92 | -0.04 ± 0.90 | 0.11 ± 0.88 | 0.11 ± 0.86 | 0.07 ± 0.86 |
| Lagged chronic diseases | 1.55 ± 1.21 | 1.61 ± 1.24 | 1.69 ± 1.24 | 1.85 ± 1.27 | 1.99 ± 1.28 |
| Change in chronic diseases | 0.20 ± 0.56 | 0.13 ± 0.58 | 0.22 ± 0.58 | 0.18 ± 0.58 | 0.18 ± 0.57 |
| Lagged functional status | 0.36 ± 1.17 | 0.35 ± 1.20 | 0.35 ± 1.17 | 0.50 ± 1.29 | 0.53 ± 1.35 |
| Change in functional status | 0.12 ± 1.16 | 0.07 ± 1.08 | 0.26 ± 1.19 | 0.14 ± 1.11 | 0.08 ± 1.16 |
|
| |||||
| Time Constant Covariates |
Total (n=17,196) |
White (n=13,644) |
Black (n=2,340) |
Hispanic (n=1,212) |
Racial/Ethnic Differenceb |
|
| |||||
| Died (between baseline and 2006) | 4,061 (24%) | 3,207 (24%) | 603 (26%) | 251 (21%) | .WBH, BH |
| Ever attrited (between baseline and 2006) | 1,537 (9%) | 1,132 (8%) | 268 (11%) | 137 (11%) | WBH, WB, WH |
| Age (in 1995) | 64.28 ± 10.23 | 64.32 ± 10.06 | 62.80 ± 9.93 | 62.28 ± 9.44 | WBH, WB, WH |
| Female | 10,061 (59%) | 7,832 (57%) | 1,506 (64%) | 723 (60%) | WBH, WB |
| Education | 12.08 ± 3.27 | 12.64 ± 2.75 | 10.81 ± 3.53 | 8.30 ± 4.62 | WBH, WB, WH, BH |
| Baseline marital status | 12,205 (71%) | 10,143 (74%) | 1,217 (52%) | 845 (70%) | WBH, WB, WH, BH |
| Baseline household income (in quartile) a | 2.50 ± 1.12 | 2.65 ± 1.08 | 1.99 ± 1.08 | 1.79 ± 0.99 | WBH, WB, WH, BH |
| Baseline household income (in $) d | 49,649 ± 68,172 | 54,908 ± 72,057 | 30,632 ± 38,416 | 27,158 ± 55,921 | WBH, WB, WH |
| Baseline self-rated health | 2.67 ± 1.14 | 2.56 ± 1.11 | 3.06 ± 1.14 | 3.15 ± 1.17 | WBH, WB, WH |
| Baseline chronic diseases | 1.51 ± 1.22 | 1.47 ± 1.21 | 1.77 ± 1.24 | 1.40 ± 1.20 | WBH, WB, BH |
| Baseline functional status | 0.35 ± 1.16 | 0.29 ± 1.05 | 0.59 ± 1.51 | 0.56 ± 1.47 | WBH, WB, WH |
| Baseline CES-D | 1.71 ± 1.96 | 1.57 ± 1.84 | 2.15 ± 2.16 | 2.46 ± 2.44 | WBH, WB, WH, BH |
Note: Statistics are reported as mean ± standard deviation or n (%). Time varying covariates are those associated with repeated observations within individuals. Data based on the 1995-2006 Health and Retirement Study (HRS).
Household income is measured on a scale from 1 to 4 (with 1 = lowest income quartile, 2=low middle income quartile, 3=high middle income quartile, and 4= highest income quartile).
WBH = significant difference across blacks, Hispanics, and whites at p<0.01 level; WB = significant difference between white and black Americans at p<0.01 level, WH = significant difference between white and Hispanic Americans at p<0.01 level; and BH = significant difference between black and Hispanic Americans at p<0.01 level.
Measured in inflation adjusted 1998 U.S. dollars.
It is important to note that the derived trajectories may vary significantly depending upon the inclusion of time-varying covariates (XkiT) beyond the time-related parameters (TimeiT). Trajectories derived without time-varying covariates are not directly comparable with those identified after adjusting for time-varying covariates (Nagin, 2005, pp. 124). The resulting trajectories (i.e., the level and rate of change of each trajectory) may differ significantly, and the number of trajectories could vary as well. This is because different variables are involved in identifying distinct latent classes or trajectory groups.
To evaluate the hypotheses, we first derived the basic trajectory groups by estimating a model (M1.0 in Table 2) in which depressive symptoms are a function of time only, without any other covariates. Second, we evaluate race/ethnic differences in the probabilities of belonging to the identified trajectories (M1.1 in Table 3) and the extent racial/ethnic variations are mediated by socioeconomic status and baseline marital status (M1.2 in Table 3) and baseline health (M1.3 in Table 3). To determine a mediation effect, we follow the classic approach outlined by Baron and Kenny (1986) with a procedure for significance tests suggested by Clogg, Petkova & Haritou (1995). Third, to assess the effects of time-varying health and marital status, we derived trajectories while adjusting for time-varying covariates (i.e., marital status, household income, and health conditions) (M2.0 in Table 5), and then we included socioeconomic variables as predictors (M2.1 in Table 7).
Table 2.
Estimated trajectory groups and group-specific growth parameters covariates (M1.0)
| Minimal Depressive Symptoms | Low Depressive Symptoms | Moderate and Stable Depressive Symptoms | High but Decreasing Depressive Symptoms | Moderate but Increasing Depressive Symptoms | Persistently High Depressive Symptoms | |
|---|---|---|---|---|---|---|
| Growth Parameter | ||||||
| Intercept | -1.847** | 0.511** | 2.275** | 4.546** | 4.389** | 7.302** |
| Linear slope | -0.162** | -0.083** | 0.014 | -0.386** | 0.373** | 0.067 |
| Quadratic slope | 0.010 | 0.007 | 0.0005 | 0.004 | 0.005 | -0.007 |
| Cubic slope | 0.006 | 0.003** | 0.001 | 0.003 | -0.006 | -0.003 |
| Group Proportion | 15.9% | 36.3% | 29.2% | 6.6% | 8.3% | 3.6% |
|
| ||||||
| Sigma | 1.835** | |||||
| Model Fit Statistics | ||||||
| BIC (N=64,674) | -117,002.0 | |||||
| BIC (N=17,196) | -116,982.1 | |||||
| AIC fit index | -116,865.8 | |||||
| Log Likelihood | -116,835.8 | |||||
Level 1 N = 64,674, Level 2 N = 17,196. Data reflect aggregate results from multiple imputation. BIC = Bayesian information criterion. AIC = Akaike’s information criterion.
p<.01,
p<.001.
Minimal Depressive Symptoms: Characterized by nearly zero depressive symptoms along with a small decrease over 11 years.
Low Depressive Symptoms: Characterized by a level of one symptom with a small decline throughout 11 years.
Moderate and Stable Depressive Symptoms: Characterized by a stable level of two depressive symptoms throughout 11 years.
High but Decreasing Depressive Symptoms: Characterized by nearly six symptoms at the baseline with substantial reduction over 11 years, ending with approximately three symptoms.
Moderate but Increasing Depressive Symptoms: Characterized by substantial increases in distress from approximately 3.5 to nearly 6 symptoms over 11 years.
Persistently High Depressive Symptoms: Characterized by a very high level of distress with an average of 7 symptoms which persisted over 11 years.
Table 3.
Factors associated with trajectory group membership (M1)
| Trajectory | Parameter | M1.1 | M1.2 | M1.3 | |||
|---|---|---|---|---|---|---|---|
| Minimal Depressive Symptoms (Reference group) | |||||||
| Low Depressive Symptoms | |||||||
| Constant | 0.257 | ** | 2.287 | 0.664 | |||
| Dead | 2.090 | ** | 1.988 | * | 2.122 | * | |
| Ever Attrition | 1.201 | 1.157 | 1.023 | ||||
| Black | 2.128 | ** | 1.606 | ** | 1.268 | ||
| Hispanic | 1.935 | ** | 1.559 | 1.357 | |||
| Age in 1995 | 1.030 | ** | 1.025 | ** | 1.018 | ||
| Female | 1.455 | ** | 1.347 | ** | 1.498 | ** | |
| Education | 0.914 | ** | 0.934 | ** | |||
| Baseline household income a | 0.864 | ** | 0.873 | ||||
| Baseline marital status | 0.843 | 0.908 | |||||
| Baseline CES-D | 2.976 | ** | |||||
| Baseline functional status | 0.654 | ||||||
| Baseline self-rated health | 1.464 | ** | |||||
| Baseline chronic diseases | 1.230 | * | |||||
| Moderate and Stable Depressive Symptoms | |||||||
| Constant | 0.034 | ** | 2.161 | 0.062 | * | ||
| Dead | 4.007 | ** | 3.847 | ** | 2.832 | ** | |
| Ever Attrition | 0.884 | 0.830 | 0.929 | ||||
| Black | 2.949 | ** | 1.907 | ** | 1.426 | ||
| Hispanic | 1.980 | ** | 1.054 | 0.988 | |||
| Age in 1995 | 1.054 | ** | 1.038 | ** | 1.026 | ** | |
| Female | 2.021 | ** | 1.760 | ** | 2.106 | ** | |
| Education | 0.861 | ** | 0.904 | ** | |||
| Baseline household income a | 0.716 | ** | 0.836 | * | |||
| Baseline marital status | 0.840 | 0.909 | |||||
| Baseline CES-D | 4.937 | ** | |||||
| Baseline functional status | 1.206 | ||||||
| Baseline self-rated health | 2.411 | ** | |||||
| Baseline chronic diseases | 1.463 | ** | |||||
| High but Decreasing Depressive Symptoms | |||||||
| Constant | 0.014 | ** | 10.669 | ** | 0.002 | ** | |
| Dead | 4.541 | ** | 4.061 | ** | 3.372 | ** | |
| Ever Attrition | 1.402 | 1.363 | 1.419 | ||||
| Black | 4.590 | ** | 2.125 | ** | 1.361 | ||
| Hispanic | 5.606 | ** | 1.892 | * | 1.320 | ||
| Age in 1995 | 1.033 | ** | 1.000 | 1.016 | |||
| Female | 3.289 | ** | 2.536 | ** | 3.637 | ** | |
| Education | 0.806 | ** | 0.871 | ** | |||
| Baseline household income a | 0.612 | ** | 0.783 | * | |||
| Baseline marital status | 0.634 | * | 0.855 | ||||
| Baseline CES-D | 7.875 | ** | |||||
| Baseline functional status | 1.314 | ||||||
| Baseline self-rated health | 3.533 | ** | |||||
| Baseline chronic diseases | 1.510 | ** | |||||
| Moderate but Increasing Depressive Symptoms | |||||||
| Constant | 0.004 | ** | 1.009 | 0.003 | ** | ||
| Dead | 6.619 | ** | 6.463 | ** | 5.478 | ** | |
| Ever Attrition | 1.408 | 1.436 | 1.345 | ||||
| Black | 3.122 | ** | 1.705 | * | 1.068 | ||
| Hispanic | 3.117 | ** | 1.027 | 0.850 | |||
| Age in 1995 | 1.061 | ** | 1.041 | ** | 1.033 | * | |
| Female | 2.835 | ** | 2.552 | ** | 3.090 | ** | |
| Education | 0.805 | ** | 0.866 | ** | |||
| Baseline household income a | 0.578 | ** | 0.724 | ** | |||
| Baseline marital status | 1.184 | 1.243 | |||||
| Baseline CES-D | 6.512 | ** | |||||
| Baseline functional status | 1.266 | ||||||
| Baseline self-rated health | 3.120 | ** | |||||
| Baseline chronic diseases | 1.689 | ** | |||||
| Persistently High Depressive Symptoms | |||||||
| Constant | 0.021 | ** | 79.117 | ** | 0.000 | ** | |
| Dead | 10.907 | ** | 9.205 | ** | 6.887 | ** | |
| Ever Attrition | 1.079 | 0.975 | 1.191 | ||||
| Black | 3.702 | ** | 1.454 | 0.864 | |||
| Hispanic | 7.391 | ** | 1.478 | 1.044 | |||
| Age in 1995 | 1.012 | 0.974 | ** | 1.004 | |||
| Female | 4.510 | ** | 3.528 | ** | 4.538 | ** | |
| Education | 0.751 | ** | 0.826 | ** | |||
| Baseline household income a | 0.499 | ** | 0.751 | * | |||
| Baseline marital status | 0.671 | * | 0.903 | ||||
| Baseline CES-D | 10.317 | ** | |||||
| Baseline functional status | 1.393 | ||||||
| Baseline self-rated health | 4.205 | ** | |||||
| Baseline chronic diseases | 1.681 | ** | |||||
| Model Fit Statistics | |||||||
| BIC (N=64,674) | -116296.2 | -115812.2 | -112819.5 | ||||
| BIC (N=17,196) | -116256.5 | -115762.6 | -112756.6 | ||||
| AIC fit index | -116023.9 | -115471.9 | -112388.3 | ||||
| Log Likelihood | -115963.9 | -115396.9 | -112293.3 | ||||
Level 1 N = 64,674, Level 2 N = 17,196. All regression estimates are presented in relative risk ratios (RRR). Data reflect aggregate results from multiple imputation. BIC = Bayesian information criterion. AIC = Akaike’s information criterion.
p<.01,
p<.001.
Household income is measured on a scale from 1 to 4 (with 1 = lowest income quartile, 2=low middle income quartile, 3=high middle income quartile, and 4= highest income quartile).
Table 5.
Trajectory groups and group-specific growth parameters, while adjusting for time-varying covariates (M2.0)
| Minimal Depressive Symptomstv | Low Depressive Symptomstv | Moderate and Stable Depressive Symptomstv | High but Decreasing Depressive Symptomstv | Moderate but Increasing Depressive Symptomstv | Persistently High Depressive Symptomstv | |
|---|---|---|---|---|---|---|
| Growth Parameter | ||||||
| Intercept | -4.035** | -1.202** | 0.396 | 0.703 | 1.028 | 3.689** |
| Linear slope | -0.118 | -0.114** | -0.028 | -0.455** | 0.432 | -0.040 |
| Quadratic slope | 0.006 | 0.005 | -0.005 | 0.074 | -0.009 | 0.008 |
| Cubic slope | 0.003 | 0.002* | 0.001 | -0.009 | -0.010 | -0.005 |
| Lagged marital status | -0.495** | -0.265** | -0.588** | -0.487 | -0.317 | -0.707** |
| Change in marital status | -1.317** | -0.736** | -1.498** | 0.260 | -1.521 | -0.767 |
| Lagged household incomea | -0.150* | -0.128** | -0.105* | -0.321 | 0.029 | 0.036 |
| Change in household incomea | -0.082 | -0.057* | -0.070* | -0.160 | -0.334 | 0.069 |
| Lagged self-rated health | 1.049** | 0.781** | 0.877** | 1.120** | 1.075** | 0.972** |
| Change in self-rated health | 0.813** | 0.564** | 0.627** | 0.766** | 1.055 | 0.664** |
| Lagged chronic diseases | 0.232** | 0.139** | 0.103** | 0.002 | -0.005 | -0.034 |
| Change in chronic diseases | 0.191* | 0.088** | 0.184** | 0.146 | -0.036 | -0.110 |
| Lagged functional status | 0.204** | 0.320** | 0.392** | 0.228* | 0.217 | 0.238** |
| Change in functional status | 0.162** | 0.247** | 0.327** | 0.207 | 0.332 | 0.156 |
| Group Proportion | 15.3% | 49.2% | 24.2% | 4.2% | 4.5% | 2.5% |
|
| ||||||
| Sigma | 1.779** | |||||
| Model Fit Statistics | ||||||
| BIC (N=64,674) | -112428.5 | |||||
| BIC (N=17,196) | -112368.8 | |||||
| AIC fit index | -112020.0 | |||||
| Log Likelihood | -111930.0 | |||||
Level 1 N = 64,674, Level 2 N = 17,196. Data reflect aggregate results from multiple imputation. BIC = Bayesian information criterion. AIC = Akaike’s information criterion.
p<.01,
p<.001.
Household income is measured on a scale from 1 to 4 (with 1 = lowest income quartile, 2=low middle income quartile, 3=high middle income quartile, and 4= highest income quartile).
Table 7.
Factors associated with trajectory group membership, while adjusting for time-varying covariates (M2)
| Trajectory Parameter | M2.1 |
|---|---|
| Minimal Depressive Symptomstv (Reference group) | |
| Low Depressive Symptomstv | |
| Constant | 0.656 |
| Dead | 1.255 |
| Ever Attrition | 0.891 |
| Black | 1.146 |
| Hispanic | 0.691 |
| Age in 1995 | 1.009 |
| Female | 1.519** |
| Education | 0.972 |
| Baseline CES-D | 2.692** |
| Moderate and Stable Depressive Symptomstv | |
| Constant | 0.135** |
| Dead | 1.113 |
| Ever Attrition | 0.996 |
| Black | 0.963 |
| Hispanic | 0.540** |
| Age in 1995 | 1.006 |
| Female | 2.327** |
| Education | 0.930** |
| Baseline CES-D | 4.259** |
| High but Decreasing Depressive Symptomstv | |
| Constant | 0.755 |
| Dead | 1.378 |
| Ever Attrition | 2.171* |
| Black | 1.266 |
| Hispanic | 2.218* |
| Age in 1995 | 0.941** |
| Female | 2.276** |
| Education | 0.944 |
| Baseline CES-D | 4.161** |
| Moderate but Increasing Depressive Symptomstv | |
| Constant | 0.246 |
| Dead | 4.478** |
| Ever Attrition | 1.741 |
| Black | 0.388 |
| Hispanic | 1.348 |
| Age in 1995 | 0.971 |
| Female | 2.439* |
| Education | 0.928 |
| Baseline CES-D | 3.203** |
| Persistently High Depressive Symptomstv | |
| Constant | 0.046** |
| Dead | 1.804* |
| Ever Attrition | 1.296 |
| Black | 0.594* |
| Hispanic | 0.746 |
| Age in 1995 | 0.980* |
| Female | 3.028** |
| Education | 0.907** |
| Baseline CES-D | 5.964** |
|
| |
| Model Fit Statistics | |
| BIC (N=64,674) | -110617.1 |
| BIC (N=17,196) | -110531.0 |
| AIC fit index | -110027.1 |
| Log Likelihood | -109897.1 |
Model adjusted for marital status, household income, self-rated health status, functional status, and diseases as time-varying covariates. Level 1 N = 64,674, Level 2 N = 17,196. All regression estimates are presented in relative risk ratios (RRR). Data reflect aggregate results from multiple imputation. BIC = Bayesian information criterion. AIC = Akaike’s information criterion
p<.01,
p<.001.
Mortality, attrition, and missing data
In growth mixture models, subjects are included in the analysis if they have at least one observation with valid data on the dependent variable (Jones, Nagin & Roeder, 2001). To minimize the loss of subjects due to item missing in covariates, multiple imputation was undertaken (Schafer, 1997). Three complete data sets were imputed with the NORM software developed by Schafer (1997), and analyses were run on each of these three data sets. Parameter estimates and their standard errors were derived by averaging across three imputations and by adjusting for their variance. In addition, following Mroczek and Spiro (2005), two binary variables were constructed to identify those who died or dropped out of the study during the period of observation and were included in the level-2 equation. These measures were treated as confounding variables instead of predictors in our model to assess the degree to which the findings depend on a subject’s missing data pattern (Hedeker & Gibbons, 2006).
Findings
Trajectories of depressive symptoms
To identify the distinct trajectories of depressive symptoms, we explored various models including intercept only and linear, quadratic, or cubic functions of time. Although a linear function may be sufficient in describing some trajectories, we chose to apply a cubic function for each group, given the number of repeated observations available and that cubic functions are more flexible in identifying the distinct trajectories. On the basis of changes in the BIC score as the number of trajectory groups increased from 2 to 10 and whether there was any overlap between the confidence intervals of adjacent trajectories, we chose 6 groups because the improvement in BIC began to level off after 6 groups (Appendix A).
The six trajectories identified are as follows (Figure 1a and Table 2):
Minimal depressive symptoms: Accounting for 15.9% of the sample, it was characterized by nearly zero depressive symptoms along with a small negative linear slope. People in this group had little symptomatology throughout the 11 year observation period.
Low depressive symptoms: Representing 36.3% of the sample, this was the largest trajectory group. Relative to the group of minimal depressive symptoms, this course was distinguished by approximately one symptom throughout the period of observation, although the number of symptoms tended to decline slightly over time.
Moderate and stable depressive symptoms: 29.2% of the sample followed this trajectory. Individuals in this group had a stable level of two depressive symptoms throughout the 11 years.
High but decreasing depressive symptoms: Individuals in this group began with nearly six symptoms at the baseline but experienced substantial reduction over time, ending with approximately three symptoms. They accounted for 6.6% of the sample.
Moderate but increasing depressive symptoms: Individuals in this group had substantial increases in symptomatology from approximately 3.5 to nearly 6 symptoms over the 11-year period. They accounted for 8.3% of the sample.
Persistently high depressive symptoms: Characterizing 3.6% of the sample, this trajectory group exhibited a very high level of symptomatology with an average of 7 symptoms which persisted over the 11-year period.
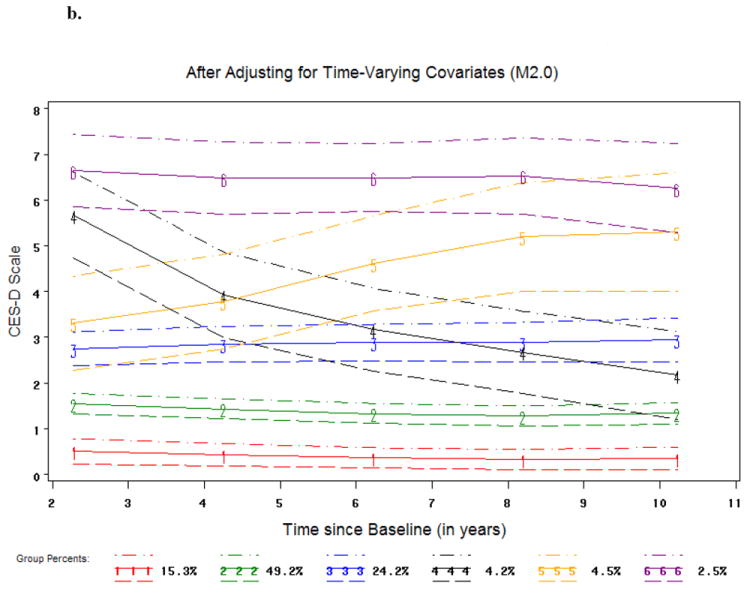
Figure 1. Trajectory Groups of Depressive Symptoms over Time.
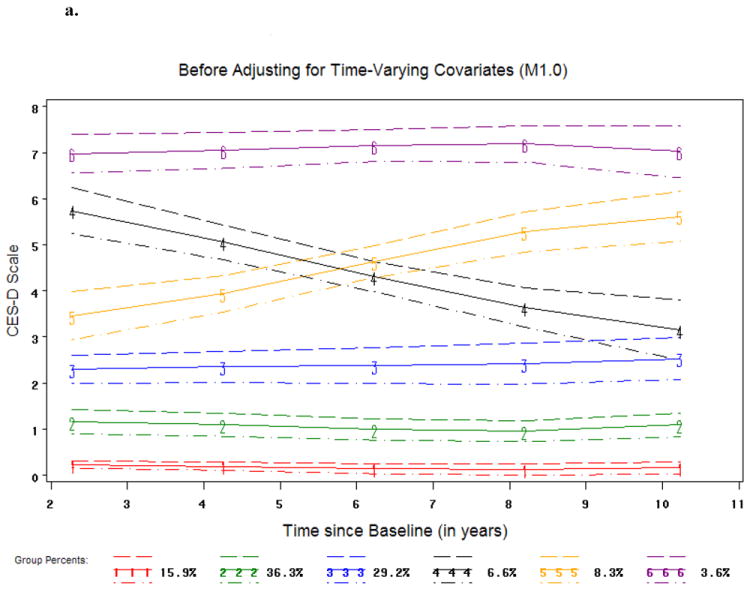
a
Trajectory #1 = Minimal Depressive Symptoms
Trajectory #2 = Low Depressive Symptoms
Trajectory #3 = Moderate and Stable Depressive Symptoms
Trajectory #4 = High but Decreasing Depressive Symptoms
Trajectory #5 = Moderate but Increasing Depressive Symptoms
Trajectory #6 = Persistently High Depressive Symptoms
b
Trajectory #1 = Minimal Depressive Symptomstv
Trajectory #2 = Low Depressive Symptomstv
Trajectory #3 = Moderate and Stable Depressive Symptomstv
Trajectory #4 = High but Decreasing Depressive Symptomstv
Trajectory #5 = Moderate but Increasing Depressive Symptomstv
Trajectory #6 = Persistently High Depressive Symptomstv
These results lend support to our hypothesis of the existence of five or six courses of depressive symptoms with the majority of respondents suffering very few symptoms (H1).
Racial/ethnic differences in depressive symptoms trajectories
Relative to the course of minimal depressive symptoms, black and Hispanic Americans were significantly more likely than white Americans to belong to the remaining five trajectory groups (M1.1 Table 3). These included three stable trajectories at low, moderate, and high levels (i.e., low depressive systems, moderate but stable depressive symptoms, and persistently high depressive symptoms) and two trajectories characterized by an increase or reduction in depressive symptoms over time (i.e., moderate but increasing depressive symptoms and high but decreasing depressive symptoms). For instance, blacks and Hispanics had respectively three and two-fold relative risks of that for whites to be classified with moderate and stable depressive symptoms (Relative risk ratio or RRR = 2.949, p<.001, and RRR = 1.980, p<.001, respectively; M1.1 in Table 3). Similar racial/ethnic differences were found for the persistently high depressive symptoms trajectory. On the other hand, blacks and Hispanics were also more likely to experience a significant rise or decline in symptoms. In particular, blacks and Hispanics had a three-fold risk (RRR = 3.122, p<.001, and RRR = 3.117, p<.001, respectively; M1.1 in Table 3) than whites in following a path of moderate but increasing depressive symptoms. Meanwhile, blacks and Hispanics were more likely than whites in experiencing a substantial reduction of depressive symptoms (RRR = 4.590, p<.001, and RRR = 5.606, p<.001, respectively; M1.1 in Table 3). Our findings support the hypothesized racial/ethnic differences with reference to the three stable trajectories of depressive symptoms at the low, moderate, and high levels. However, blacks and Hispanics were also found more likely to experience a significant increase or reduction in symptoms (i.e., moderate but increasing depressive symptoms and high but decreasing depressive symptoms) which were not anticipated.
Do Hispanics differ from black Americans in their probability of following different trajectories? Hispanics were more likely than black Americans to have a persistently high depressive symptoms trajectory (RRR = 1.996, p<.01, data not shown), although they did not differ in the probabilities associated with other trajectory groups. Hence, this is some support for H2b in that Hispanics had a greater likelihood in belonging to at least one trajectory of elevated depressive symptoms.
Racial/ethnic differences in the six trajectory groups can be shown with a bivariate cross-tabulation (Table 4) as well. Relative to black and Hispanic Americans, white Americans were more likely to belong to the minimal depressive symptoms (15.5%) and low depressive symptoms groups (39.5%). In contrast, Hispanics were more likely than black and white Americans to fall into the trajectory groups of high but decreasing symptom group (10.8%), moderate but increasing (9.2%), and persistently high depressive symptoms group (7.5%). Blacks tended to fall between white and Hispanic Americans in terms of all the trajectories except the moderate and stable depressive symptoms group (35.5%). These results are very similar to those derived from Table 3 (M1.1), except that regarding the low depressive symptoms. This difference could be due to the fact that a number of covariates (i.e., age, gender, death, attrition) were adjusted in M1.1.
Table 4.
Trajectory groups by race/ethnicity
| Minimal Depressive Symptoms | Low Depressive Symptoms | Moderate and Stable Depressive Symptoms | High but Decreasing Depressive Symptoms | Moderate but Increasing Depressive Symptoms | Persistently High Depressive Symptoms | Total | |
|---|---|---|---|---|---|---|---|
| Non-Hispanic White | 15.54% | 39.53% | 31.05% | 5.49% | 5.69% | 2.70% | 100% |
| Non-Hispanic Black | 7.95% | 36.20% | 35.47% | 9.02% | 7.22% | 4.15% | 100% |
| Hispanic | 8.91% | 34.24% | 29.37% | 10.81% | 9.16% | 7.51% | 100% |
Respondents were assigned to one of the six trajectory groups based on the maximum posterior probability of group membership from Model M1.0 (Table 2).
Mediating effects of SES and physical health status
Blacks, Hispanics, and whites differed significantly in education, baseline marital status, baseline household income, and baseline health characteristics (Table 1) which were correlated with memberships in various trajectory groups as well (M1.3 in Table 3). These linkages in conjunction with the observed racial/ethnic variations in trajectory groups of depressive symptoms provide an appropriate context for analyzing mediation effects as outlined by Baron and Kenney (1986).
How do racial/ethnic differences in the trajectories of depressive symptoms change, when SES and health status are taken into account? There were no longer significant differences between black and white Americans or between Hispanic and white Americans in following different courses of depressive symptoms, after controlling for the baseline measures of SES and health status (M1.3 Table 3). Black/white differences in the relative risk ratios associated with (a) the moderate and stable depressive symptoms trajectory, (b) high but decreasing depressive symptoms trajectory, (c) moderate but increasing depressive symptoms trajectory, and (d) persistently high depressive symptoms trajectory (as compared to the minimal depressive symptoms trajectory) was attenuated respectively by 40.4% [(2.128-1.268)/2.128=0.404, p<.001], 51.7% [(2.949-1.426)/2.949=0.517, p<.001], 70.3% [(4.590-1.361)/4.590=0.703, p<.001], 65.8% [(3.122-1.068)/3.122=0.658, p<.001], and 76.7% [(3.702-0.864)/3.702=0.767, p<.001] (Clogg et al., 1995). Likewise, the Hispanic/white differences in the relative risk ratios were attenuated by 29.9% (P=0.030), 50.1% (p=0.099), 76.5% (p<0.001), 72.7% (p<0.001), and 85.9% (p<0.001), respectively.
However, the mechanisms underlying the black-white and Hispanic-white differences appeared to vary. Black-white differences persisted until baseline health characteristics were introduced in the model, whereas the adjustment of SES variables alone (e.g., education and household income) only attenuated the magnitude of the racial differences (M1.2 and M1.3 in Table 3). In contrast, SES variables alone largely explained the Hispanic-white differences in their likelihood of following different trajectory paths (except for the high but decreasing depressive symptoms trajectory). This suggests that black-white differences in the trajectories of depressive symptoms were a function of social economic position and physical health, while Hispanic-white differences were generally attributable to the disadvantaged social economic position of Hispanics.
Effects of time-varying covariates
Specific life events such as widowhood or illness which evolve over time are often embedded in the trajectories of depressive symptoms. Consequently, we conducted parallel analysis to examine the multiple trajectories of depressive symptoms by taking these events into account. In doing so, we included lagged measures of marital status, household income, health conditions at each observation, and their changes between two adjacent observations. Based on our analysis of 2 to 10 trajectory groups and their BIC scores, we chose six groups to depict changes in depressive symptoms when time-varying covariates were adjusted (Appendix A). As explicated previously, trajectories derived without time-varying covariates are not directly comparable with those identified after adjusting for time-varying covariates (Nagin, 2005, pp. 124). This is because in addition to the time, time-varying marital status, household income, and health conditions were included in deriving the trajectory groups.
Nonetheless, the number and shape of the trajectory groups identified with time-varying covariates adjusted were quite similar to those identified without such an adjustment (Figure 1b). Hence we named these trajectories with the same labels with a subscript tv, referring to the adjustment of time-varying covariates. As shown in Table 5, for all six trajectory groups, depressive symptoms at a given time varied with not only time but also marital status, household income, and health status. For instance, fewer symptoms were generally associated with being married and higher income. This was particularly true with regard to groups such as minimal depressive symptomstv, low depressive symptomstv, and moderate and stable depressive symptomstv. For the remaining three trajectories, the roles of marital status and health status were still significant but much less prominent. Finally, in contrast with the results before adjusting for time-varying covariates, more people were categorized in the low depressive symptomstv group (49.2% versus 36.3% without such an adjustment).
To what extent are the trajectory groups with or without adjusting time-varying covariates correspond to each other? As shown in Table 6, there is a moderate agreement (Kappa = .417; weighted Kappa = .556). The correspondences for minimal depressive symptoms and low depressive symptoms are better than those for the remaining four trajectory groups. Hence, the assignment of individuals to a given trajectory group is sensitive to intrapersonal variations in SES, marital status, and health status.
Table 6.
Correspondence between trajectory groups before and after adjusting for time-varying covariatesa
| Group Membership Based on Model M2.0 | Total | |||||||
|---|---|---|---|---|---|---|---|---|
| Minimal Depressive Symptomstv | Low Depressive Symptomstv | Moderate and Stable Depressive Symptomstv | High but Decreasing Depressive Symptomstv | Moderate but Increasing Depressive Symptomstv | Persistently High Depressive Symptomstv | |||
| Group Membership Based on Model M1.0 | Minimal Depressive Symptoms | 1,640 (9.54%) | 744 (4.50%) | 0 (0.00%) | 0 (0.00%) | 0 (0.00%) | 0 (0.00%) | 2,414 (14.04%) |
| Low Depressive Symptoms | 505 (2.94%) | 5,763 (33.51%) | 354 (2.06%) | 34 (0.20%) | 0 (0.00%) | 0 (0.00%) | 6,656 (38.71%) | |
| Moderate and Stable Depressive Symptoms | 54 (0.31%) | 3,086 (17.95%) | 2,095 (12.18%) | 109 (0.63%) | 75 (0.44%) | 4 (0.02%) | 5,423 (31.54%) | |
| High but Decreasing Depressive Symptoms | 1 (0.01%) | 145 (0.84%) | 544 (3.16%) | 286 (1.66%) | 35 (0.20%) | 80 (0.47%) | 1,091 (6.34%) | |
| Moderate but Increasing Depressive Symptoms | 0 (0.00%) | 107 (0.62%) | 626 (3.64%) | 6 (0.03%) | 279 (1.62%) | 38 (0.22%) | 1,056 (6.14%) | |
| Persistently High Depressive Symptoms | 0 (0.00%) | 11 (0.06%) | 159 (0.92%) | 62 (0.36%) | 71 (0.41%) | 253 (1.47%) | 556 (3.23%) | |
| Total | 2,200 (12.79%) | 9,886 (57.49%) | 3,778 (21.97%) | 497 (2.89%) | 460 (2.68%) | 375 (2.18%) | 17,196 (100%) | |
Respondents were assigned to one of the six trajectory groups based on the maximum posterior probability of group membership from Models M1.0 (Table 2) and M2.0 (Table 5). All proportions are expressed in total percentages (Simple Kappa = .417, standard error = .0052; Weighted Kappa = .556, standard error = .0048).
Racial/ethnic variations in CES-D trajectories manifest differently, depending on whether health and marital status are allowed to vary with time. When only baseline measures of health, income and marital status are controlled, the initially observed disadvantages of blacks and Hispanics associated with three trajectories (i.e., moderate but stable depressive symptoms, high but decreasing symptoms, persistently high depressive symptoms) are no longer statistically significant (M1.1 and M1.3 in Table 3). In contrast, when time-varying marital, income, and health status were adjusted, significant racial/ethnic variations remained. Specifically, Hispanics were less likely than whites to follow a trajectory of moderate and stable depressive symptomstv (RRR = .540, p<.001, M2.1 in Table 7), while blacks were less likely than whites to have persistently high depressive symptomstv (RRR = .594, p<.01, M2.1 in Table 7). Moreover, relative to blacks, Hispanics were significantly less likely to be in the low depressive symptomstv or moderate and stable depressive symptomstv groups (RRR = .603, p<.01, RRR = .560, p<.01, respectively, data not shown). Although these results are not directly comparable with those without adjusting for time-varying covariates, they provide some indication that the racial/ethnic minorities’ higher probabilities of associating with poor trajectories of depressive symptoms are likely a function of intrapersonal variations in SES, marital status, and health status.
Effects of other covariates
In addition to race/ethnicity, older age was associated with slightly higher risk of having a trajectory of elevated depressive symptoms, which appeared to be partially mediated by SES and baseline health status (M1.1 and M1.3 in Table 3). Even after SES and health characteristics were accounted for (either as baseline measures or time-varying covariates), female gender was shown to be associated with a significantly increased probability of being classified with greater depressive symptoms, while better education was linked to reduced risk of having an elevated trajectory of depressive symptoms (M1.3 in Table 3 and M2.1 in Table 7).
Baseline health characteristics were significantly associated with trajectory group membership. Individuals with more chronic diseases, poorer self-rated health status and greater symptomatology at baseline were more likely to have trajectories of worse depressive symptoms (M1.3 in Table 3). Although functional status was found to be an important factor influencing a person’s level of depressive symptoms when measured as a time-varying covariate, baseline functional status was not associated with the various trajectory groups. This suggests that the relationship between functional status and depressive symptoms may be more instantaneous than other health measures.
To control for possible selection bias associated with death and respondent drop out, mortality and attrition during the period of follow-up were included in our analysis as covariates. Although they are generally considered confounding variables, they may also serve as surrogates for poor health. Mortality was substantially correlated with a higher risk of following greater depressive symptom trajectories, while attrition for non-mortality reasons in general did not affect the findings (M1.1 in Table 3 and M2.1 in Table 7).
Discussion
A key contribution of this research lies in its quantitative depiction of the heterogeneity underlying the average trajectory along which depressive symptoms evolve in middle and late life. It extends the current understanding that depressive symptoms rise moderately after midlife (Mirowsky & Kim, 2007; Yang, 2007) by presenting some evidence that this average trajectory is a composite of six distinct courses of changes. In particular, some 16% of the respondents had few or no symptoms over the 11-year period, whereas 64 to 73% had low or moderate levels of depressive symptoms. Finally, significant clinical symptoms were experienced by 10 to 18% of the respondents, and many of them also encountered substantial increase or reduction in symptoms (i.e., high but decreasing depressive symptoms trajectory, moderate but increasing depressive symptoms trajectory, and persistently high depressive symptoms trajectory in Figure 1a). This is in line with reports of 8% to 16% of the prevalence of significant depressive symptoms among community-dwelling older adults (Blazer, 2003). The six distinct trajectories identified by us are similar to those observed by Andreescu et al. (2008) in 1,260 older adults with low income and education in rural southwestern Pennsylvania over a 12-year period. Our findings have extended the generalizability of the previously observed trajectories of depressive symptoms to a nationally representative sample of middle aged and older Americans with significant representation of racial/ethnic minorities.
Research on racial/ethnic variations in trajectory groups of depressive symptoms is sparse. To the best of our knowledge, this is the first study of multiple trajectories of depressive symptoms across black, Hispanic, and white Americans in middle and old age. According to our findings, blacks and Hispanics were significantly more likely than whites to report elevated levels of depressive symptoms. In addition, there is evidence that Hispanics were more likely than blacks to encounter a course of persistently high depressive symptoms. These findings are consistent with the assertion that depression may be more prevalent among Mexican Americans than whites and African Americans (Blazer, 2003). On the other hand, black and Hispanic Americans were more likely than white Americans to experience a longer-term increase or reduction in depressive symptoms. The reason for racial and ethnic differences in this respect is unclear, although they are likely a result of both interpersonal differences and intrapersonal changes in SES and health status.
An innovation of our research involved the incorporation of time-varying covariates. This is important given that many covariates may change over time. In the vast majority of prior studies, covariates were assumed to be constant over time. A more dynamic approach, such as ours, can better capture the linkages between the changes in covariates and depressive symptom trajectories. For example, although baseline functional status was not correlated with trajectory groups of depressive symptoms (Table 3), lagged functional health and its change term were nevertheless significant predictors of depressive symptoms at a given time (Table 5). In addition, with time-varying covariates adjusted, blacks actually exhibited a lower probability than whites in encountering persistently high depressive symptoms (Table 7). More importantly, results from the analysis involving time-varying covariates reinforced the existence of six distinct trajectory groups of depressive symptoms and lent additional support to the hypothesis that racial/ethnic differences in courses of depressive symptoms are confounded by SES and health status.
We further evaluated how racial and ethnic differences in depressive symptoms were mediated by interpersonal and intrapersonal variations in income, marital status, and health conditions. When these variables were treated as time-constant covariates (Model M1.3 in Table 3), only interpersonal variations were controlled. When they were treated as time-varying covariates, interpersonal and intrapersonal differences in income, marital status, and health conditions were adjusted (Model M2.0 in Table 5 and Model M2.1 in Table 7) (Hedeker & Gibbons, 2006: 72).
It is important to consider both intrapersonal differences and interpersonal changes in SES, marital status, and health status, when evaluating racial/ethnic disparities in trajectories of depressive symptoms. Racial/ethnic differences were suppressed, when only interpersonal variations in these covariates were controlled. Furthermore, the mechanisms underlying the black-white and Hispanic-white differences appeared to differ. Hispanic-white differences are predominantly explained by SES differentials, whereas both SES and health differentials help to account for white-black differences. However, when both interpersonal and intrapersonal differences in these measures were taken into account, racial/ethnic differences diminished but some remained significant. Therefore, racial/ethnic differences in CES-D trajectory groups are only partially mediated by SES, marital status, and health status.
There are currently several major hypotheses concerning racial/ethnic variations in health in old age. The cumulative disadvantage hypothesis suggests that health disparities across racial/ethnic groups would increase over the life course (Dannefer, 2003). In contrast, the age-as-leveler and persistent health inequality hypotheses posit that racial/ethnic inequalities in health should decrease or remain stable as people get older (Ferraro & Farmer, 1996; House, Lantz & Herd, 2005). All these hypotheses have been framed in terms of an average health trajectory over time. This focus may be overly restrictive as there is strong evidence that multiple courses of changes in depressive symptoms exist. It would be interesting to cast hypotheses such as cumulative disadvantage, age-as-level, and persistent health inequality in terms of multiple trajectories of depressive symptoms. For instance, how do racial/ethnic differences in the experience of depression over time change with age? On the other hand, additional insights could be gained from analyzing blacks, Hispanics, and whites separately in exploring the unique patterns of trajectories within each race/ethnicity. For example, the number, configuration, and relative distribution of the courses of depressive symptoms among blacks could vary substantially from those among Hispanics and whites. Further research is definitely warranted.
Several implications for the prevention of depression can be drawn from our findings and the statistical methods used here could be implemented in prevention and clinical trials. For example, it is important to identify those who are at significant risk for persistently high levels of depressive symptoms. Interventions, particularly primary and secondary prevention, can then be targeted at subgroups of older adults or elderly patients in primary care (Schoevers, Smit, Deeg, et al., 2006; Smit, Ederveen, Cuijpers et al., 2006), according to key risk factors of these trajectories (e.g., racial and ethnic minorities, women, depressive symptoms and chronic diseases at baseline). Furthermore, trajectories of depressive symptoms are useful outcome measures. They are more informative than measures pertaining to symptomatology at a given point in time because significant changes may occur over time. They may lead to a much better understanding of the relative effectiveness and efficiency of current geriatric interventions in promoting and maintaining optimal mental health in old age.
Like all scientific endeavors, this research may be significantly improved. First, depressive symptoms in this research were assessed once every two years. This design could miss significant fluctuations in depressive symptoms. Repeated and frequent observations of individuals over a brief period can yield much fine-grained data on changes in health and functioning. Thus, a major challenge is how to synthesize data and knowledge of long-term as well as short-term changes in depressive symptoms. Second, because respondents of HRS were sampled in mid- and late-life, differential mortality had already altered the representativeness of the original birth cohorts before they were eligible for inclusion. This left truncation may lead to selection bias. If survival is more selective among black and Hispanic Americans than white Americans, more whites with poor physical and mental health might have been included in the HRS panel. This could lead to underestimated racial/ethnic differences in the trajectories of depressive symptoms. Third, because our dynamic specifications required several time-varying covariates, we excluded 693 individuals who never responded to consecutive interviews between 1995 and 2006. These individuals had worse health and they were more likely to be black. Hence the exclusion of these individuals in our analysis might have resulted in an underestimation of the racial differences in CES-D trajectories.
Finally, this research could be improved by further differentiating subgroups of blacks, Hispanics, and whites. Although there are important commonalities in each ethnic group, there is also variation within the subgroup (Williams et al., 2007). For instance, black immigrants from Sub-Saharan Africa or the Caribbean may be better educated than native born black Americans (Williams, 2005). Hispanics include Cubans, Puerto Ricans, Mexican Americans, and Central/South American origin individuals. They are culturally diverse with different customs, values, migration patterns, and socioeconomic status (Marger, 2003). In this regard, factors such as acculturation and age at immigration may have important implications for health in middle and later life (Markides & Black, 1996). Moreover, much is to be learned about trajectories of depressive symptoms in other minority groups in the U.S., such as American Indians and Asians, which would further enhance our understanding of racial/ethnic differences in the dynamics of affective health in old age.
Trajectory groups of depressive symptoms provide new insights concerning the heterogeneity underlying the average changes in depressive symptoms among middle and old age Americans. Black and Hispanic Americans have greater probabilities of following trajectories of elevated depressive symptoms relative to white Americans. Such differences, however, are largely confounded by heterogeneity in the socioeconomic and health status across racial/ethnic groups. In addition, the mechanisms underlying the black-white and Hispanic-white differences in the trajectories of depressive symptoms appeared to vary. Future interventions targeting older minority Americans and research on the trajectories of positive well-being are clearly warranted.
Acknowledgments
This research was supported by the National Institute on Aging via grants R01-AG015124 and R01-AG028116 (Jersey Liang, PI) and by the National Institutes of Health via a pilot grant (Xiao Xu, PI) from the University of Michigan Claude D. Pepper Older Americans Independence Center (5P30AG024824) and the Michigan Institute of Clinical and Health Research (UL1RR024986). The Japanese Ministry of Health, Labor and Welfare Longevity Foundation and the Tokyo Metropolitan Institute of Gerontology provided additional support. We thank Bobby Jones for his useful advice on the implementation of Proc Traj and interpretation of findings.
Appendix A. BIC score by number of trajectory groups
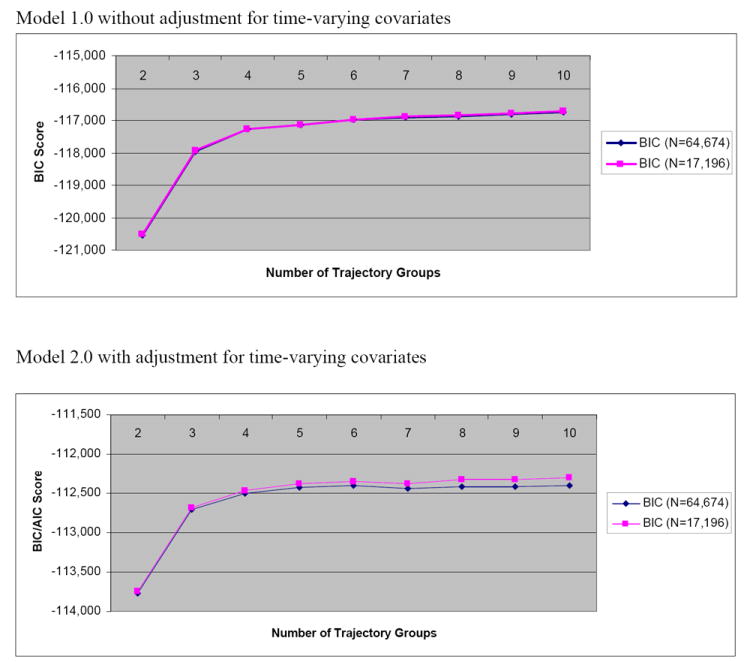
Level 1 N = 64,674, Level 2 N = 17,196. BIC = Bayesian information criterion.
Footnotes
Publisher's Disclaimer: The following manuscript is the final accepted manuscript. It has not been subjected to the final copyediting, fact-checking, and proofreading required for formal publication. It is not the definitive, publisher-authenticated version. The American Psychological Association and its Council of Editors disclaim any responsibility or liabilities for errors or omissions of this manuscript version, any version derived from this manuscript by NIH, or other third parties. The published version is available at www.apa.org/pubs/journals/pag
References
- Aldwin CM, Spiro A, Leveson MR, Cupertino AP. Longitudinal findings from the normative aging study: III. Personality, individual health trajectories, and mortality. Psychology and Aging. 2001;16(3):450–465. [PubMed] [Google Scholar]
- Andreescu C, Chang CH, Mulsant BH, Ganguli M. Twelve-year depressive symptom trajectories and their predictors in a community sample of older adults. International Psychogeriatrics. 2008;20(2):221–236. doi: 10.1017/S1041610207006667. [DOI] [PMC free article] [PubMed] [Google Scholar]
- Aneshensel CS, Botticello AL, Yamamoto-Mitani N. When caregiving ends: The course of depressive symptoms after bereavement. Journal of Health and Social Behavior. 2004;45(4):422–440. doi: 10.1177/002214650404500405. [DOI] [PubMed] [Google Scholar]
- Blazer DG. Depression in late life: Review and commentary. Journal of Gerontology: Medical Sciences. 2003;58A(1):249–265. doi: 10.1093/gerona/58.3.m249. [DOI] [PubMed] [Google Scholar]
- Bonanno GA, Wortman CB, Lehman DR, Tweed RG, Harring M, Sonnega J, Carr D, Nesse RM. Resilience to loss and chronic grief: A prospective study from preloss to 18-months postloss. Journal of Personality and Social Psychology. 2002;83(5):1150–1164. doi: 10.1037//0022-3514.83.5.1150. [DOI] [PubMed] [Google Scholar]
- Bromberger JT, Harlow S, Avis N, Kravitz HM, Cordal A. Racial/ethnic differences in the prevalence of depressive symptoms among middle-aged women: The Study of Women’s Health Across the Nation (SWAN) American Journal of Public Health. 2004;94(8):1378–1385. doi: 10.2105/ajph.94.8.1378. [DOI] [PMC free article] [PubMed] [Google Scholar]
- Centers for Disease Control and Prevention (CDC) Health disparities experienced by black or African Americans--United States. MMWR Morbidity and Mortality Weekly Report. 2005;54(1):1–3. [PubMed] [Google Scholar]
- Clogg CC, Petkova E, Haritou A. Statistical methods for comparing regression coefficients between models. The American Journal of Sociology. 1995;100(5):1261–1293. [Google Scholar]
- Crimmins EM, Hayward MD, Seeman T. Race/ethnicity, socioeconomic status, and health. In: Anderson N, Bulatau R, Cohen B, editors. Critical Perspectives on Race and Ethnic Differences in Health and Later Life. Washington, DC: National Academies Press; 2004. [PubMed] [Google Scholar]
- Cui X, Lyness JM, Tang W, Tu X, Conwell Y. Outcomes and predictors of late-life depression trajectories in older primary care patients. American Journal of Geriatric Psychiatry. 2008;16(5):406–415. doi: 10.1097/JGP.0b013e3181693264. [DOI] [PubMed] [Google Scholar]
- Cuijpers P, van Lier PA, van Straten A, Donker M. Examining differential effects of psychological treatment of depressive disorder: An application of trajectory analyses. Journal of Affective Disorder. 2005;89(1-3):137–146. doi: 10.1016/j.jad.2005.09.001. [DOI] [PubMed] [Google Scholar]
- Dannefer D. Cumulative advantage/disadvantage and the life course: Cross-fertilizing age and social science theory. Journal of Gerontology: Social Sciences. 2003;58B:S327–S337. doi: 10.1093/geronb/58.6.s327. [DOI] [PubMed] [Google Scholar]
- Ferraro KF, Farmer MM. Double jeopardy, aging as leveler, or persistent health inequality? A longitudinal analysis of white and black Americans. Journal of Gerontology: Social Sciences. 1996;51B:S319–S328. doi: 10.1093/geronb/51b.6.s319. [DOI] [PubMed] [Google Scholar]
- Geerlings SW, Beekman AT, Deeg DJ, Van Tilburg W. Physical health and the onset and persistence of depression in older adults: An eight-wave prospective community-based study. Psychological Medicine. 2000;30(2):369–380. doi: 10.1017/s0033291799001890. [DOI] [PubMed] [Google Scholar]
- George LK, Lynch SM. Race differences in depressive symptoms: A dynamic perspective on stress exposure and vulnerability. Journal of Health and Social Behavior. 2003;44(3):353–369. [PubMed] [Google Scholar]
- Gildengers AG, Houck PR, Mulsant BH, Dew MA, Aizenstein HJ, Jones BL, Greenhouse J, Pollock BG, Reynolds CF., III Trajectories of treatment response in late-life depression: Psychosocial and clinical correlates. Journal of Clinical Psychopharmacology. 2005;25(supplement 1):S8–S13. doi: 10.1097/01.jcp.0000161498.81137.12. [DOI] [PubMed] [Google Scholar]
- Hedeker D, Gibbons RD. Missing data in longitudinal studies. In: Hedeker D, Gibbons RD, editors. Longitudinal Data Analysis. John Wiley & Sons, Inc.; Hoboken, New Jersey: 2006. pp. 279–312. [Google Scholar]
- House JS, Lantz PM, Herd P. Continuity and change in the social stratification of aging and health over the life course: Evidence from a nationally representative longitudinal study from 1986 to 2001/2002 (Americans’ Changing Lives Study) Journal of Gerontology: Social Science. 2005;60B(Special Issue II):15–26. doi: 10.1093/geronb/60.special_issue_2.s15. [DOI] [PubMed] [Google Scholar]
- Jackson JS, Antonucci TC, Gibson RC. Cultural, racial, and ethnic minority influences on aging. In: Birren JE, Schaie KW, editors. Handbook of the Psychology of Aging. 3. New York: Academic Press; 1990. pp. 103–123. [Google Scholar]
- Jones B, Nagin D, Roeder K. A SAS procedure based on mixture models for estimating developmental trajectories. Sociological Method and Research. 2001;29:374–393. [Google Scholar]
- Jones CJ, Peskin H. Psychological health from the teens to the 80s: Multiple developmental trajectories. Journal of Adult Development. 2009 Aug 12; published online: [Google Scholar]
- Klein DN, Shankman SA, Rose S. Dysthymic disorder and double depression: prediction of 10-year course trajectories and outcomes. Journal of Psychiatric Research. 2008;42(5):408–415. doi: 10.1016/j.jpsychires.2007.01.009. [DOI] [PMC free article] [PubMed] [Google Scholar]
- Kim J, Durden E. Socioeconomic status and age trajectories of health. Social Science & Medicine. 2007;65(12):2489–2502. doi: 10.1016/j.socscimed.2007.07.022. [DOI] [PubMed] [Google Scholar]
- Lynch SM, George LK. Interlocking trajectories of loss-related events and depressive symptoms among elders. Journal of Gerontology: Social Sciences. 2002;57B(2):S117–S125. doi: 10.1093/geronb/57.2.s117. [DOI] [PubMed] [Google Scholar]
- Marger MN. Race and Ethnic Relations: American and Global Perspectives. 6. Belmont, CA: Wadsworth; 2003. [Google Scholar]
- Markides KS, Black SA. Race, ethnicity, and aging: The impact of inequality. In: Binstock RH, George LK, editors. Handbook of Aging and the Social Sciences. 4. San Diego, CA: Academic Press; 1996. pp. 153–170. [Google Scholar]
- Mirowsky J, Kim J. Graphing age trajectories: vector graphs, synthetic and virtual cohort projections, and cross-sectional profiles of depression. Sociological Methods & Research. 2007;35(4):497–541. [Google Scholar]
- Mirowsky J, Ross CE. Age and depression. Journal of Health and Social Behavior. 1992;33(3):187–205. discussion 206-212. [PubMed] [Google Scholar]
- Mroczek DK, Spiro A. Change in life satisfaction during adulthood: Findings from the Veterans Affairs Normative Aging Study. Journal of Personality and Social Psychology. 2005;88:189–202. doi: 10.1037/0022-3514.88.1.189. [DOI] [PubMed] [Google Scholar]
- Mui AC. Self-reported depressive symptoms among black and Hispanic frail elders: A sociocultural perspective. Journal of Applied Gerontology. 1993;12(2):170–187. [Google Scholar]
- Nagin DS. Group-based modeling of development. Cambridge, MA: Harvard University Press; 2005. [Google Scholar]
- Oliver MN, Muntaner C. Researching health inequities among African Americans: The imperative to understand social class. International Journal of Health Services. 2005;35(3):485–498. doi: 10.2190/PPQX-47DY-KW0X-78Y8. [DOI] [PubMed] [Google Scholar]
- Raudenbush SW. Comparing personal trajectories and drawing causal inferences from longitudinal data. Annual Review of Psychology. 2001;52:501–525. doi: 10.1146/annurev.psych.52.1.501. [DOI] [PubMed] [Google Scholar]
- Robert SA, House JS. Socioeconomic Inequalities in Health: An Enduring Sociological Problem. In: Bird CE, Conrad P, MA, editors. Handbook of Medical Sociology. 5. Upper Saddle River, NJ: Prentice Hall; 2000. pp. 79–97. [Google Scholar]
- Romero, Ortiz, Finley, Wayne, Lindeman 2005 [Google Scholar]
- Ryff CD, Singer B, Love GD, Essex MJ. Resilience in adulthood and later life: defining features and dynamic processes. In: Lomranz J, editor. Handbook of Aging and Mental Health: An Integrative Approach. Plenum; New York: 1998. pp. 69–96. [Google Scholar]
- Schafer JL. Analysis of Incomplete Multivariate Data. London: Chapman and Hall; 1997. [Google Scholar]
- Schoevers R, Smit F, Deeg D, Cuijpers P, Dekker J, van Tilburg W, Beekman A. Prevention of late-life depression in primary care: Do we know where to begin? American Journal of Psychiatry. 2006;163(9):1611–1621. doi: 10.1176/ajp.2006.163.9.1611. [DOI] [PubMed] [Google Scholar]
- Schulz R, Heckhausen J, O’Brien A. Control and the disablement process in the elderly. Journal of Social Behavior and Personality. 1994;9(5):139–152. [Google Scholar]
- Seligman MEP, Altenor A. Part II: Learned Helplessness. Behaviour Research and Therapy. 1980;18(5):462–473. doi: 10.1016/0005-7967(80)90011-x. [DOI] [PubMed] [Google Scholar]
- Seligman MEP, Csikszentmihalyi M. Positive psychology: An introduction. American Psychologist. 2000;55(1):5–14. doi: 10.1037//0003-066x.55.1.5. [DOI] [PubMed] [Google Scholar]
- Shaw BA, Krause N. Exploring race variations in aging and personal control. Journal of Gerontology: Social Sciences. 2001;56(2):S119–S24. doi: 10.1093/geronb/56.2.s119. [DOI] [PubMed] [Google Scholar]
- Skarupski KA, Mendes de Leon CF, Bienias JL, Barnes LL, Everson-Rose SA, Wilson RS, Evans DA. Black-white differences in depressive symptoms among older adults over time. Journal of Gerontology: Psychological Sciences. 2005;60B(3):P136–P142. doi: 10.1093/geronb/60.3.p136. [DOI] [PubMed] [Google Scholar]
- Smit F, Ederveen A, Cuijpers P, Deeg D, Beekman A. Opportunities for cost-effective prevention of late-life depression: An epidemiological approach. Archives of General Psychiatry. 2006;63:290–296. doi: 10.1001/archpsyc.63.3.290. [DOI] [PubMed] [Google Scholar]
- Taylor DH, Jr, Ezell M, Kuchibhatta M, Ostebye T, Clipp EC. Identifying trajectories of depressive symptoms for women caring for their husbands with dementia. Journal of American Geriatrics Society. 2008;56(2):322–327. doi: 10.1111/j.1532-5415.2007.01558.x. [DOI] [PMC free article] [PubMed] [Google Scholar]
- Turvey CL, Wallace RB, Herzog R. A revised CES-D measure of depressive symptoms and a DSM-based measure of major depressive episodes in the elderly. International Psychogeriatrics. 1999;11(2):139–148. doi: 10.1017/s1041610299005694. [DOI] [PubMed] [Google Scholar]
- Williams DR. Race and health: basic questions, emerging directions. Annals of Epidemiology. 1997;7(5):322–333. doi: 10.1016/s1047-2797(97)00051-3. [DOI] [PubMed] [Google Scholar]
- Williams DR. The health of U.S. racial and ethnic populations. Journal of Gerontology: Social Sciences. 2005;60B(Special Issue II):53–62. doi: 10.1093/geronb/60.special_issue_2.s53. [DOI] [PubMed] [Google Scholar]
- Williams DR, Gonzalez HM, Neighbors H, Nesse R, Abelson JM, Sweetman J, et al. Prevalence and distribution of major depressive disorder in African Americans, Caribbean blacks, and non-Hispanic whites: results from the National Survey of American Life. Archives of General Psychiatry. 2007;64(3):305–315. doi: 10.1001/archpsyc.64.3.305. [DOI] [PubMed] [Google Scholar]
- Winship C, Radbill L. Sampling Weights and Regression Analysis. Sociological Methods and Research. 1994;23:230–257. [Google Scholar]
- Xu X, Liang J, Bennett JM, Quiñones AR, Ye W. Ethnic differences in the dynamics of depressive symptoms in middle aged and older Americans. Journal of Aging and Health. doi: 10.1177/0898264310370851. in press. [DOI] [PMC free article] [PubMed] [Google Scholar]
- Yang Y. Is old age depressing? Growth trajectories and cohort variations in late-life depression. Journal of Health and Social Behavior. 2007;48(1):16–32. doi: 10.1177/002214650704800102. [DOI] [PubMed] [Google Scholar]