The pathological hallmark of an Alzheimer’s Diseased (AD) brain is the presence of insoluble neuritic plaques rich in amyloid-beta (Aβ).[1] Aβ is a 37–43 amino acid peptide that is linked to a variety of neurotoxic events, including oxidation of lipid membranes, hyperphosphorylation of tau protein, and disruption of calcium homeostasis.[2] These events lead to diseased synapses, neuronal cell death, and eventually the outward symptoms of dementia. Because evidence of Aβ and its associated toxicity are widespread in the post-mortem AD brain, preventing Aβ formation has been a suggested strategy for potential therapeutic intervention. However, in order to develop effective drugs, advanced chemical tools are needed to efficiently elucidate the proteins involved in Aβ generation, and measure how they are affected under various conditions.
Production of Aβ results from sequential cleavage of a transmembrane protein called amyloid precursor protein (APP) by two proteases, β- and γ-secretase. β-secretase (BACE) is a membrane-associated aspartic protease that cleaves APP in the extracellular domain. Hydrolysis creates the N-terminus of Aβ and initiates the amyloidogenic processing of APP.[3] Subsequent cleavage by γ-secretase in the membrane creates the C-terminus and releases the toxic Aβ fragment.[4] An alternative APP processing pathway exists that does not result in neurotoxic Aβ release. Initial hydrolysis by α-secretase, instead of BACE, followed by γ-secretase cleavage releases non-Aβ protein fragments that appear to have some neuroprotective effects, having been shown to enhance memory and learning in mice.[5,6] Further indicting BACE as a facilitator of Alzheimer’s are observations that genetic mutations that lead either to increased BACE or decreased α-secretase activity result in increased Aβ production and early-onset Alzheimer’s disease.[7] Conversely, experiments that effectively inhibit BACE activity including gene knockdown, interfering RNA, and APP mutation, have proven to reduce amyloid plaque loads and restore cognitive abilities.[3] These results have led to an increased focus on BACE as a therapeutic target.
Limiting BACE activity is a sought-after approach for pharmaceutical intervention. However, developing potent and specific small molecule BACE inhibitors has been challenging due to the broad substrate specificity of the enzyme.[8] A popular assay used to monitor inhibitor efficacy in vitro utilizes a FRET substrate that increases its fluorescence emission when hydrolyzed by BACE. Effective BACE inhibitors therefore suppress the fluorescence turn-on effect. This approach remains the standard in assaying in vitro BACE activity[9] and because this technique is amenable to high-throughput screening, it has been used extensively to identify BACE inhibitors.[10] Many of these seemingly promising inhibitors, however, are disappointingly inadequate at inhibiting BACE activity when assayed in cells.
The failure in cellular activity of inhibitors is due in part to the cellular localization of active BACE enzyme. Even though BACE is located on the extracellular membrane, it is inactive at pH 7.4 and is unlikely to cleave APP when exposed to the extracellular environment. To gain activity, BACE must be endocytosed to an endosome where the pH is between 4–5.[11] Thus, inhibitors that do not access these endosomal compartments are unable to inhibit BACE in cells. Similarly, the conventional FRET probes used to monitor BACE activity in vitro are ineffective in cells due to their limited accessibility to intracellular vesicles.
Alternative assays for evaluating BACE activity in cells have been developed but are significantly more costly and time consuming than their in vitro counterpart. The typical ELISA assay for evaluating cellular BACE activity is slow, expensive, and laborious. ELISA often requires genetic manipulation of the cell lines, several costly antibodies, and takes multiple days.[12] An alternative FRET-based assay has been developed, but still requires genetic manipulation and cannot easily detect real-time changes..[13] To overcome these challenges, we report here a β-secretase Membrane Anchored Probe (β-MAP) that monitors real-time BACE activity in living cells using a lipidated FRET substrate. An example of this type of FRET probe has been reported for a matrix metalloproteinase, but to our knowledge, not for BACE.[14] In addition to visualizing intracellular, vesicle-associated fluorescence turn-on, quantitative fluorescence differences were observed when BACE was genetically knocked down with siRNA or chemically inhibited with BACE inhibitor Axon 1125. Furthermore, a sequence-scrambled version of β-MAP was evaluated to confirm the suitability of β-MAP’s design and its specificity towards BACE in cells. The probe is non-toxic, the assay can be performed in less than one day, and requires no manipulation of the cell line or costly biological reagents. β-MAP can also be used for in vitro applications, eliminating the need for multiple chemical probes.
The structure of β-MAP is illustrated in Figure 1 and contains multiple important design features adapted from a previously reported BACE inhibitor.[15] The peptide substrate consists of the sequence EVNLDAHFWADR, which we have shown to be efficiently cleaved by BACE.[16] The first eight amino acids are identical to residues 668–675 of the Swedish mutant APP (EVNLDAEF) with the exception of a histidine mutation for the second glutamic acid. These residues are important for BACE recognition and contain the enzyme cleavage site between the leucine and aspartic acid. The remaining residues, WADR, serve to improve solubility and prevent the bulky DABCYL group from interfering in BACE hydrolysis.
Figure 1.
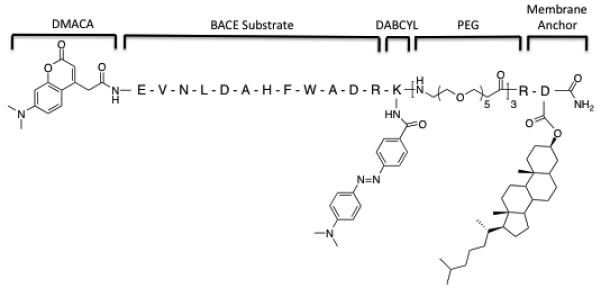
Structure of β-MAP with key design features. The fluorescent 7-dimethylaminocoumarin-4-acetic acid (DMACA) is attached at the N-terminus of the BACE substrate. Appended to the peptide substrate is a lysine residue with a 4-(dimethylaminoazo) benzene-4-carboxylic acid (DABCYL) group attached to the ε-amine. A polyethylene glycol linker provides a flexible spacer between the substrate and a dihydrocholesterol-modified aspartic acid, which serves as the cell membrane anchor.
The DMACA–DABCYL FRET pair was chosen to satisfy two requirements. First, the DMACA excitation (370 nm) and emission (480 nm) are compatible with live cell fluorescence microscopy. DMACA also retains similar fluorescence characteristics at both pH 7.4 and 4.5 (SI). This property is critical, as the probe must primarily operate in the acidic environment of an endosome. The DABCYL quenching group attached to the ε-amine group of lysine on the C-terminus of the substrate has a broad absorbance band between 420–520 nm and does not fluoresce, making it an effective ‘dark quencher’ for the DMACA group. This pair concurrently accomplishes the second goal of the probe design, which is to avoid steric interference with BACE hydrolysis. A bulkier rhodamine-fluorescein pair was initially employed due to its visible excitation/emission wavelengths, but this substrate was not efficiently cleaved by BACE in our system (not shown).
Three successive polyethylene glycol (PEG) units provide the correct spacing and orientation for the FRET peptide to be hydrolyzed by BACE in cells. Attachment of the PEG groups adjacent to the DABCYL forces the FRET peptide to be oriented from the C-terminus to the N-terminus as it extends from the cell membrane, analogous to APP. The length of the PEG chain was also carefully chosen. APP contains 28 residues between the BACE cleavage site and the cell membrane.[4] The PEG linker provides the equivalent of 29 residues between the membrane anchor and the hydrolysis site. Recent reports have suggested that the length of the linker is not strictly important, but that too short a linker could alter specificity or prevent hydrolysis.[11a] PEG also helps the solubility of the probe in aqueous solutions and is metabolically stable.
Following the PEG linker is the cell membrane anchor composed of an arginine residue and an aspartic acid modified with a dihydrocholesterol moiety. The arginine adds an additional positive charge to the probe, which not only aids solubility, but also ensures the probe does not get buried in the membrane past the cholesterol. The dihydrocholesterol moiety on the C-terminus provides a targeting vector to attach β-MAP to cell membranes, more specifically to lipid raft compartments. Lipid rafts are microdomains within the cell membrane that contain high amounts of saturated phospholipids and cholesterol and are distinct from the largely unsaturated phospholipids of the surrounding bilayer.[17] Raft domains are a site of Aβ production and oligomerization and significant amounts of BACE have been shown to localize in lipid rafts.[18] Dual fluorescence microscopy was used to show that a cholesterol-anchored BACE substrate indeed partially colocalizes in HeLa cells with lipid raft markers (SI), a result that is consistent with previous reports in which cholesterol was used in this role.[15,19] A fluorescein-tagged BACE substrate without the cholesterol anchor was not visible by microscopy, indicating the peptide alone does not localize on cells.
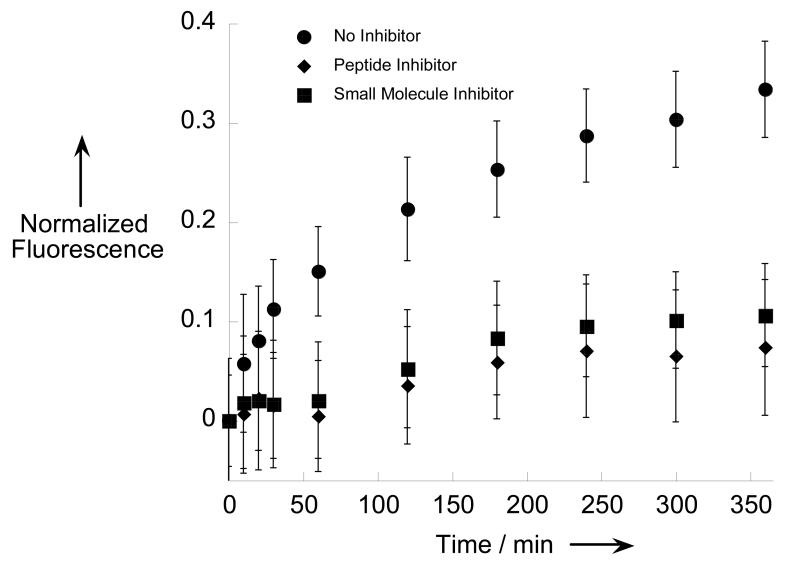
β-MAP can be used to monitor in vitro BACE hydrolysis similar to many other FRET probes reported in the literature.[20] As shown in Figure 2, an in vitro evaluation of two commercially available BACE inhibitors; one small molecule (Axon 1125), and one peptide (β-Secretase Inhibitor III), yielded expected results. In the absence of inhibitor, a strong fluorescence turn-on was observed when β-MAP was incubated with BACE corresponding to liberation of the chromophore from the quenching DABCYL group. The cleavage site was confirmed through identification of the products via LC-MS. When an inhibitor was added to the reaction mixture, the turn-on signal was significantly attenuated in both cases.
Figure 2.
β-MAP used to evaluate two commercial BACE inhibitors in vitro. A suppressed fluorescence signal denotes effective enzyme inhibition. Each condition was evaluated in triplicate. Experiments were performed at 37 °C in 0.1 M sodium acetate buffer pH 4.5 with 10 μM β-MAP and 10 μM inhibitor.
The novelty of β-MAP is in its applicability to live cell imaging. When β-MAP is incubated with HeLa cells and observed via time-lapse fluorescence microscopy, a strong fluorescence signal increases over time within distinct cellular compartments. The DMACA fluorescence is easily distinguishable from background noise and fluoresces strongly in acidic intracellular vesicles. The signal does not permeate the nucleus nor does it occur homogeneously across the cell membrane or cytoplasm. A sample time-lapse sequence of a HeLa cell treated with β-MAP is presented in Figure 3.
Figure 3.
Time-lapse sequence of a HeLa cell treated with 200 nM β-MAP and imaged at 60x magnification. DMACA fluorescence from cleaved β-MAP (λex/em = 390/470 nm) is localized primarily to intracellular vesicles and increases over time.
Integrating the DMACA fluorescence density from β-MAP in each image and plotting versus time yields a quantitative description of the fluorescence turn-on relative to untreated controls. This process, (detailed in the SI) allows for the construction of progress curves to evaluate BACE activity under various conditions.
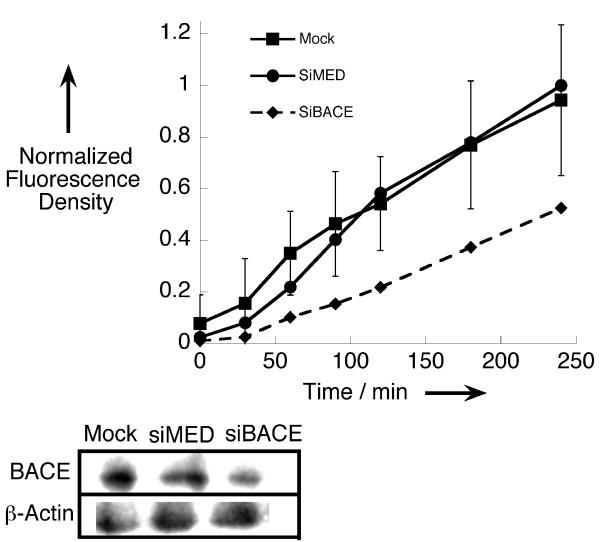
Several experiments were performed in order to verify the observed fluorescence is BACE mediated. A scrambled β-MAP probe in which the amino acids around the enzyme recognition site are in random order was synthesized and compared to β-MAP. Results presented in the SI demonstrate that the fluorescence turn-on of the sequence-scrambled probe is less than 15% that of β-MAP. Not only does this suggest that β-MAP is specific for BACE, but it also substantiates the probe’s utility because residual fluorescence from the intact probe does not influence the fluorescence signal. To further validate that BACE is responsible for the fluorescence turn-on effect, we reduced the enzyme’s expression levels in HeLa cells by using siRNA knockdown methods. As shown in Figure 4, efficient knockdown of BACE yielded a diminished fluorescence response when compared to mock and scrambled siRNA controls.
Figure 4.
HeLa cells transfected with BACE-specific siRNA exhibit a diminished capacity to cleave β-MAP, as demonstrated by the fluorescence progress curves (top). The level of BACE expression for each condition was analyzed by Western blot with β-Actin used as a loading control (bottom). Mock: Untreated control, siMED: scrambled control siRNA, siBACE: BACE-specific siRNA.
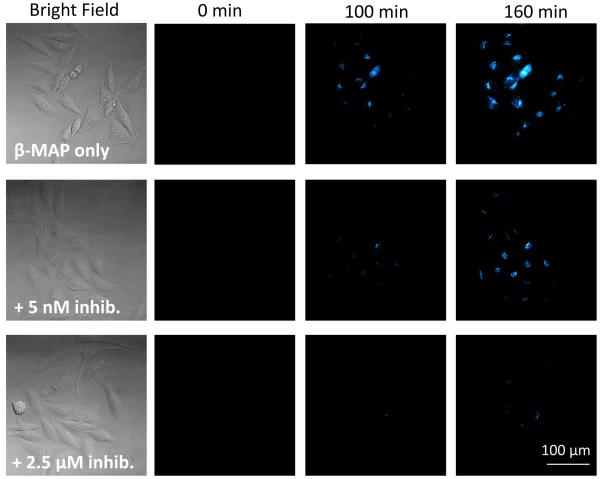
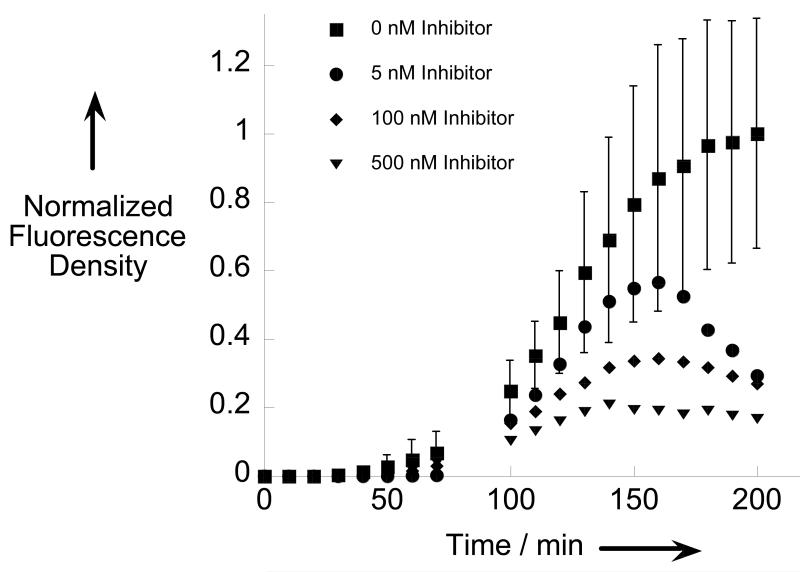
To explore the utility of β-MAP, cells were treated with both the peptide and small molecule inhibitors utilized in the in vitro BACE experiments (Figure 2) and imaged at 20× magnification. Though both inhibitors are effective in vitro, only Axon 1125 has cellular efficacy,[12a] as the peptide is unable to access the endosomal compartments where BACE is active. Qualitative analysis of the fluorescence images shows that when cells are treated with Axon 1125, a dose-dependent decrease in the fluorescence signal is observed. Figures 5a and 5b show the cell images and progress curves for selected concentrations of Axon 1125. By calculating the slope of each curve from 100 to 150 minutes a rate of hydrolysis can be determined at each inhibitor concentration. As seen from Figure 5c, the rate decreases with increasing inhibitor concentration. Not surprisingly, cells treated with β-MAP and the peptide inhibitor yielded no significant differences in the fluorescence response compared to cells treated with β-MAP alone, confirming the lack of effectiveness of the peptide inhibitor against BACE in HeLa cells (SI).
Figure 5.
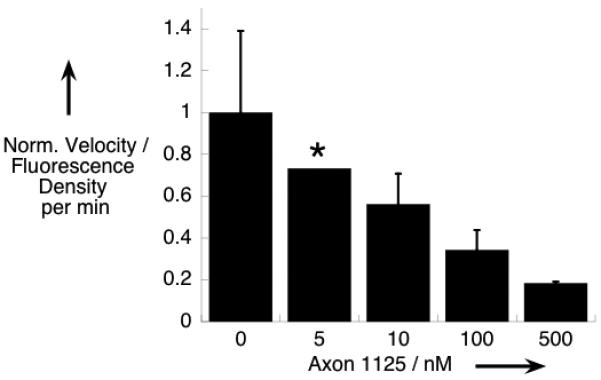
a) Fluorescence images at 20× magnification of HeLa cells treated with 200 nM β-MAP (top row) and BACE inhibitor Axon 1125 show a decrease in the fluorescence signal with increasing inhibitor concentration (bottom 2 rows). b) Progress curves showing normalized fluorescence density vs. time for selected inhibitor concentrations. c) The rate of fluorescence change (velocity) was obtained from a linear fit of the progress curves from 100 to 150 min. A dose-dependent decrease in the velocity was observed with increasing inhibitor concentration. Error bars represent the average of three trials. (*) Only one trial evaluated at 5 nM.
It is important to mention that even at high concentrations of Axon 1125, the fluorescence response from β-MAP is not completely abolished. This observation suggests the probe is not strictly specific for BACE and that a small degree of nonspecific cleavage is most likely occurring, consistent with the sequence-scrambled β-MAP data in the SI. Confirming this hypothesis, cells treated with Axon 1125 in combination with a cocktail of broad-spectrum enzyme inhibitors exhibit virtually no fluorescence turn-on (SI). While the proteases involved in non-specific proteolysis have not been conclusively identified, they represent a minor contribution to the overall fluorescence response. Furthermore, when cells are treated with 5 μM β-MAP, the fluorescence cannot be attenuated in the presence of inhibitors as it can when 200 nM probe is used (not shown). This type of non-selectivity is expected, particularly at high concentrations of probe. In fact the BACE inhibitor from which β-MAP was modeled also showed non-specific efficacy above 200 nM.[15]
In conclusion, labeling cells with β-MAP represents a novel method for monitoring BACE activity in living cells. The design of the probe allows it to concentrate in lipid raft domains within the cell membrane and be cleaved by BACE in the same way as its natural substrate APP. Hydrolysis produces a fluorescence turn-on signal that can be easily monitored via fluorescence microscopy. β-MAP was used to confirm Axon 1125 is a cellular BACE inhibitor, and because of its ease of use and applicability in unaltered cells, it could be a useful tool to efficiently screen libraries of potential BACE inhibitors. Furthermore, because β-MAP provides spatial and temporal visualization of BACE activity, the probe could be used to evaluate the effect of transient external stimuli on BACE activity without changing the enzyme’s expression levels. This type of information would be difficult to obtain via expression-based assays and could provide insight into BACE activity at the synapse, which experiences acute neurotransmitter fluctuation and is also a purported site of accelerated Aβ accumulation and toxicity.[21] Multifunctional chemical tools such as β-MAP that can expedite research and deepen our understanding of the molecular players involved in AD can play a crucial role in identifying new targets and developing therapeutics to combat this debilitating disease.
Experimental Section
Experimental details for β-MAP synthesis and other procedures referenced in the text can be found in the Supporting Information.
Supplementary Material
Footnotes
We thank the National Institutes of Health (grant GM084176), the Sloan Foundation, and the Camille and Henry Dreyfus Foundation for supporting this work. Special thanks to Sam Johnson and the Duke LMCF (grant 1S10RR027528-01) for their microscopy expertise.
Supporting information for this article is available on the WWW under http://www.angewandte.org or from the author
References
- [1].Hardy J, Selkoe D. Science. 2002;297:353. doi: 10.1126/science.1072994. [DOI] [PubMed] [Google Scholar]
- [2].a) Rauk A. Dalton Trans. 2008:1273. doi: 10.1039/b718601k. [DOI] [PubMed] [Google Scholar]; b) Crouch P, Harding S, White A, Camakaris J, Bush A, Masters C. Int. J. Biochem. Cell Biol. 2008;40:181. doi: 10.1016/j.biocel.2007.07.013. [DOI] [PubMed] [Google Scholar]
- [3].Evin G, Barakat A, Masters C. Int. J. Biochem. Cell Biol. 2010;42:1923. doi: 10.1016/j.biocel.2010.08.017. [DOI] [PubMed] [Google Scholar]
- [4].Frisardi V, et al. Curr. Alzheimer Res. 2010;7:40. doi: 10.2174/156720510790274400. [DOI] [PubMed] [Google Scholar]
- [5].Postina R. Curr Alzheimer Res. 2008;5:179. doi: 10.2174/156720508783954668. [DOI] [PubMed] [Google Scholar]
- [6].Endres K, Fahrenholz F. FEBS J. 2010;277:1585. doi: 10.1111/j.1742-4658.2010.07566.x. [DOI] [PubMed] [Google Scholar]
- [7].Hutton M, Perez-Tur J, Hardy J. Essays Biochem. 1998;33:117. doi: 10.1042/bse0330117. [DOI] [PubMed] [Google Scholar]
- [8].a) Hemming M, Elias J, Gygi S, Selkoe D. PLoS One. 2009;4 doi: 10.1371/journal.pone.0008477. [DOI] [PMC free article] [PubMed] [Google Scholar]; b) Gruninger-Leitch F, Schlatter D, Kung E, Nelbock P, Dobeli H. J. Biol. Chem. 2002;277:4687. doi: 10.1074/jbc.M109266200. [DOI] [PubMed] [Google Scholar]
- [9].Mancini F, De Simone A, Andrisano V. Anal. Bioanal. Chem. 2011;400:1979. doi: 10.1007/s00216-011-4963-x. [DOI] [PubMed] [Google Scholar]
- [10].a) Congreve M, et al. J. Med. Chem. 2007;50:1124. doi: 10.1021/jm061197u. [DOI] [PubMed] [Google Scholar]; b) Cheng Y, et al. J. Med. Chem. 2011;54:5836. doi: 10.1021/jm200544q. [DOI] [PubMed] [Google Scholar]; c) Huang D, Luthi U, Kolb P, Cecchini M, Barberis A, Caflisch A. J. Am. Chem. Soc. 2006;128:5436. doi: 10.1021/ja0573108. [DOI] [PubMed] [Google Scholar]; d) Shimmyo Y, Kihara T, Akaike A, Niidome T, Sugimoto H. Biochim. Biophys. Acta, Gen. Subj. 2008;1780:819. doi: 10.1016/j.bbagen.2008.01.017. [DOI] [PubMed] [Google Scholar]; e) Yang W, et al. J. Med. Chem. 2006;49:839. doi: 10.1021/jm0509142. [DOI] [PubMed] [Google Scholar]
- [11].a) Halima SB, Rajendran L. J. Alzheimers Dis. 2011;24:143. doi: 10.3233/JAD-2011-110269. [DOI] [PubMed] [Google Scholar]; b) Stachel S, et al. Bioorg. Med. Chem. Lett. 2009;19:2977. doi: 10.1016/j.bmcl.2009.04.033. [DOI] [PubMed] [Google Scholar]
- [12].a) Stachel S, et al. J. Med. Chem. 2004;47:6447. doi: 10.1021/jm049379g. [DOI] [PubMed] [Google Scholar]; b) Shi XP, et al. J. Alzheimers Dis. 2005;7:139. [Google Scholar]; c) Yamakawa H, Yagishita S, Futai E, Ishiura S. J. Biol. Chem. 2010;285:1634. doi: 10.1074/jbc.M109.066753. [DOI] [PMC free article] [PubMed] [Google Scholar]; d) Oh M, Kim S, Oh Y, Choi D, Sin H, Jung I, Park W. Anal. Biochem. 2003;323:7. doi: 10.1016/j.ab.2003.08.036. [DOI] [PubMed] [Google Scholar]; e) Pietrak B, et al. Anal Biochem. 2005;342:144. doi: 10.1016/j.ab.2005.04.019. [DOI] [PubMed] [Google Scholar]
- [13].Lu J, Zhang Z, Yang J, Chu J, Li P, Zeng S, Luo Q. Biochem. Biophys. Res. Commun. 2007;362:25. doi: 10.1016/j.bbrc.2007.07.145. [DOI] [PubMed] [Google Scholar]
- [14].a) Cobos-Correa A, Trojanek JB, Diemer S, Mall MA, Schultz C. Nat. Chem. Biol. 2009;5:628. doi: 10.1038/nchembio.196. [DOI] [PubMed] [Google Scholar]; b) Lemke EA, Schultz C. Nat. Chem. Bio. 2011;7:480. doi: 10.1038/nchembio.620. [DOI] [PubMed] [Google Scholar]
- [15].Rajendran L, et al. Science. 2008;320:520. doi: 10.1126/science.1156609. [DOI] [PubMed] [Google Scholar]
- [16].Folk DS, Franz KJ. J. Am. Chem. Soc. 2010;132:4994. doi: 10.1021/ja100943r. [DOI] [PMC free article] [PubMed] [Google Scholar]
- [17].Laude A, Prior I. Mol. Membr. Biol. 2004;21:193. doi: 10.1080/09687680410001700517. [DOI] [PMC free article] [PubMed] [Google Scholar]
- [18].a) Kim S, Yi J, Ko Y. J. Cell. Biochem. 2006;99:878. doi: 10.1002/jcb.20978. [DOI] [PubMed] [Google Scholar]; b) Riddell D, Christie G, Hussain I, Dingwall C. Curr. Biol. 2001;11:1288. doi: 10.1016/s0960-9822(01)00394-3. [DOI] [PubMed] [Google Scholar]
- [19].Lenhart J, Ling X, Gandhi R, Guo T, Gerk P, Burnzell D, Zhang S. J. Med. Chem. 2010;53:6198. doi: 10.1021/jm100601q. [DOI] [PubMed] [Google Scholar]
- [20].a) Andrau D, et al. J. Biol. Chem. 2003;278:25859. doi: 10.1074/jbc.M302622200. [DOI] [PubMed] [Google Scholar]; b) Ermolieff J, Loy J, Koelsch G, Tang J. Biochem. 2000;39:12450. doi: 10.1021/bi001494f. [DOI] [PubMed] [Google Scholar]
- [21].Wilcox KC, Lacor PN, Pitt J, Klein WL. Cell. Mol. Neurobiol. 2011;31:939. doi: 10.1007/s10571-011-9691-4. [DOI] [PMC free article] [PubMed] [Google Scholar]
Associated Data
This section collects any data citations, data availability statements, or supplementary materials included in this article.


