

Abstract
Vestibulodynia, the most common type of chronic vulvovaginal pain, impairs the psychological, physical health of nearly 10% of women at some point in their lifetime. The aim of this investigation was to establish reliable standardized methodologies for assessment of pain sensitivity in vulvar mucosa and pelvic musculature. We enrolled 34 women with vestibulodynia and 21 pain-free controls. The participants underwent a nuanced exam that consisted of palpation of precisely located vulvar mucosal and pelvic muscle sites. These measurements remained highly stable when participants were reexamined after two weeks, with high within-examiner correlation. Vestibulodynia patients reported greater sensitivity than pain-free controls at the majority of examination sites, particularly at mucosal sites on the lower vestibule. The pain threshold measures at the lower mucosal sites were also associated with the participants’ self-reported pain levels during intercourse. These mucosal pain threshold measurements were used to discriminate between vestibulodynia cases and controls with high sensitivity and specificity. This data supports the feasibility of contemporaneous assessment of vulvar mucosa and underlying musculature in the pelvic region, offering the hope of a more precise case definition for vestibulodynia and related disorders.
Keywords: Pelvic Pain, Musculoskeletal Pain, Reliability, Vulvodynia
Introduction
Vestibulodynia, the most common type of chronic vulvovaginal pain (vulvodynia), impairs the physical, reproductive, and psychological health of nearly 1 in 10 women at some point in their lifetime.7 Because little is known about the etiology and optimal management of this disorder, most sufferers are left disillusioned.13 Historically, vestibulodynia has been viewed as a localized disorder of the vulvar mucosa and surrounding region (specifically, underlying musculature). However, over the past decade, a growing body of literature provides evidence in support of vestibulodynia as an idiopathic pain disorder (akin to fibromyalgia and temporomandibular pain disorder) with abnormalities in both peripheral and central nervous system processes.2, 19
The clinical diagnostic criteria for vestibulodynia dates back to Friedrich’s case series of 86 patients published in 1987.5 He proposed the following three clinical criteria (known as Friedrich criteria) for establishing the diagnosis of the elusive condition he called “Vulvar Vestibulitis Syndrome”: 1) entry dyspareunia (painful intercourse), 2) tenderness to pressure within the vestibule, and 3) physical findings limited to erythema without other obvious pathology.5 Over the past decade, the body of literature on vestibulodynia has expanded. However, revised criteria (based on elements of the history and an objective clinical exam) beyond Friedrich’s initial description has not been formulated.
During clinical examination, the vulvar mucosal tissue is typically assessed by the application of a cotton swab, but the reliability and reproducibility of the patient’s response are generally poor. For example, intra-examiner correlations as high as 0.73 (upper vestibule, fig 1) and as low as 0.38 (lower vestibule, fig 1) have been reported.9 Over the past decade, many researchers have attempted to standardize the exam methodology.12 Pukall et al was the first to standardize the pressure application upon recognizing the challenges of pain assessment in the vulvar region.10, 11 Their group developed 7 spring-loaded syringes capable of applying a wide range of pressures (3 –1000 g). The examiner sequentially applies higher pressure (using the preloaded syringe) until the tactile perception or pain detection threshold is reached.10 However, the stability and reproducibility have not been evaluated, and the anatomical locations of tested sites are not well characterized.
Fig 1.

Anatomical Location of The Tested Mucosal Sites
Unlike mucosa, the spectrum of normal and abnormal tenderness in the pelvic floor and its constituent muscles (e.g. puborectalis muscle) has not been described. For evaluation of pelvic muscle dysfunction, clinicians have utilized various subjective scales and surface electromyography (sEMG) to assess voluntary control as a proxy for normal “tone” and function. The usefulness and generalizability of various scales and sEMG are severely limited by poor methodological design and lack of normative data.8, 16 Aside from these techniques, there is limited data on the assessment of pressure pain sensitivity in pelvic musculature using a mechanical algometer in pain-free women.17
Our overarching hypothesis is that vestibulodynia is a heterogeneous disorder and that mucosal and muscle pain sensitivities can be used to identify distinct subgroups of patients. The purpose of this study was three fold: 1) to develop instrumentation and methodology for the objective assessment of vulvar mucosal and pelvic muscle sensitivities, 2) to establish a standardized clinical approach for assessing pain sensitivity in vulvar mucosa and pelvic musculature, and 3) to relate these measures to patients’ clinical pain reports. We began this work by developing and validating tools capable of standardizing the force applied to the mucosa and muscle, enabling a wide spectrum of pain sensitivities to be quantitatively and reproducibly assessed. We validated these instruments on women who experienced pain since coital debut or attempted tampon use during adolescence.1 These women constitute the most distressed subgroup of vestibulodynia patients.20
Materials and Methods
Participants
Thirty-four women with vestibulodynia and twenty-one pain free controls were recruited through an institutional review board-approved protocol at the University of North Carolina, Chapel Hill between March 2006 and August 2009. This study was nested within a larger study (HD053631, PI DZolnoun) aimed at identifying and characterizing clinical phenotypes of women with complaints of provoked pain in the mucosa of the vulvar vestibule.
A preliminary eligibility assessment of interested participants was conducted via a telephone interview. A positive response to any of the following criteria lead to exclusion: 1) age<21 or age>45, 2) breastfeeding/pregnant, or menopausal, 3) significant medical conditions (e.g. seizure disorder, diabetes, thyroid disorder), and 4) known diagnosis of co-morbid urogenital pain conditions (e.g. non-menstrual daily pain localized to the pelvic region, interstitial cystitis). Upon confirmation of general eligibility (the exclusions above did not apply), potential subjects were queried regarding vulvovaginal symptoms. Women who endorsed unprovoked pain/discomfort (such as burning, itching, knife like shooting pain) with or without concomitant provoked pain upon contact were then excluded. Only women without vulvo-vaginal complaints (potential controls) or isolated complaint of provoked pain with intercourse and/or tampon use (potential cases) were scheduled for the clinical eligibility assessment.
On the day of the clinical eligibility assessment, the research coordinator confirmed the accuracy of the participant’s responses during the initial phone interview, followed by a description of the study and informed consent. Participants were asked to complete a pain questionnaire (the modified Gracely Pain Scale) after which they underwent a screening gynecological exam. Using the Gracely Pain Scale, women rated the lowest, average and maximal pain with intercourse on a scale of 0–100.6, 20 Modified versions of this questionnaire are used by our research program for assessing pain in patients with other idiopathic pain disorders (e.g. temporomandibular disorder and fibromyalgia) in addition to vestibulodynia.
Vestibulodynia was diagnosed based on the subjective report of pain during intercourse (or tampon use) and tenderness to touch upon palpation of the vestibule with a cotton swab during the gynecological exam.10 This diagnosis was rendered only after the examining clinician failed to identify any infectious or dermatological etiologies for the positive responses. In the course of the screening examination, participants with suspected dermatological disorders (e.g. lichen sclerosis, contact dermatitis), and vaginismus were excluded (n=11 for the entire cohort).
Study design
Once eligibility as a case or control was established, participants underwent a nuanced vulvar mucosal and pelvic muscle pain sensitivity assessment. For some subjects the exam was repeated during the same session by a second examiner, or by one or two of the same examiners in a separate session approximately two weeks later. The order of the second examination was reversed such that second examiner in Session 1, was the first examiner in Session 2, etc. Within each session, the second examination (when conducted) was performed following a 5–10 min rest period.
Our nuanced exam consisted of a standardized approach to stimulation of precisely located vulvar mucosal and pelvic muscle sites (described below). This approach was adapted from existing constructs on structured clinical exams in the orofacial region for which a standardized methodology for mucocutaneous and muscle pain sensitivity assessment has long been utilized.3 Six mucosal sites and three muscle sites were examined in a pre-determined order. Pain perception thresholds were collected at each of the six mucosal sites. Pain tolerance measures were not collected at the mucosal sites due to excessive sensitivity of the vestibule in patients with vestibulodynia. Both pain perception threshold and pain tolerance measures were collected from each of the three muscle sites. A prototypical experimental session consisted of assessment of the vestibular mucosal pressure pain perception threshold at each site, followed by the pelvic muscle pressure pain perception threshold and pain tolerance testing at each site, which were conducted in a predetermined order described below.
We first examined the upper vestibular sites (Fig. 1), which are least sensitive clinically, in order to decrease the likelihood of obtaining lower threshold values if the more sensitive lower vestibule were examined first.10, 12 Thus, the examination set yielded a minimum of 18 data points (3 at each of the 6 vestibular mucosa sites) in the course of the mucosal pain perception assessment, and 9 data points (3 per each of the 3 muscle sites), in the course of the muscle pain perception and tolerance testing each, respectively.
Our data include mucosal threshold measurements from 34 vestibulodynia patients and 21 pain-free controls, muscle threshold measurements from 33 vestibulodynia patients and 22 pain-free controls, and muscle tolerance measurements from 31 vestibulodynia patients and 20 pain-free controls. The data from the second visit of two subjects was excluded due to calibration problems with the equipment on the day of these visits. Additionally, the maximal mucosal threshold was set at 4 N. Mucosal measurements of greater than 4 N were very rare, and often represented extreme outliers that could bias our analysis.
Mucosal Pressure Pain Detection Threshold Measurement
The 6 anatomical sites (3 on the upper vestibule and 3 on the lower vestibule) were determined in reference to the conventional “clock face.” Using an imaginary clock, a total of 12 equidistant sites on the vestibule can be described circumferentially, with positions 12 and 6 corresponding to the anterior and posterior position on the midline (in dorsal lithotomy position). Thus, sites 10, 12, and 2 are located in the upper vestibule and sites 5, 6 and 7 are located in the lower vestibule (Fig. 1). Furthermore, we used anatomical landmarks in order to standardize the location of these equidistant vestibular sites between patients. Sites 2 and 10 correspond to the mid-positions on the vestibular mucosa located on an imaginary line through the uretheral meatus and parallel to the horizontal plane. Sites 2 and 10 were examined in sequence, followed by Site 12, which was located equidistant from the glan clitoris and the uretheral meatus (measured vertically). The lower three sites were selected to be the mirror image of the upper three vestibular sites. Thus, 6 o’clock is the most posterior position on the vestibule and equidistant from 5 o’clock position on the right (subject’s left) and 7 o’clock position on the left (subject’s right). Following the examination of the upper vestibular sites (2, 10, and 12), the lower vestibular sites were examined in the following sequence: 5, 7, 6.
In collaboration with the biomedical engineering core at the Center for Neurosensory Disorders at the University of North Carolina in Chapel Hill, we developed an algometer for assessment of pressure pain sensitivity in the vestibule (Fig 2A) and the underlying pelvic musculature (Fig 2B). For the former, we used a digital algometer (Wegner instruments®) affixed to a disposable cotton swab and a custom-built computer interface for real time data acquisition (Fig. 2A). Upon initiation of contact with the vestibular mucosa, the examiner(s) began application of pressure at an approximate rate of 1 N per second. Subjects were instructed to click a computer mouse upon the first sensation of pain, at which point the pressure was immediately terminated and automatically recorded as the “mucosal pressure pain threshold.” Each mucosal site was examined three times with an inter-stimulus interval (ISI) of 2 seconds. A verbal command via a computer interface announced the order of sites, number of repetitions (3 per site), and the interval between the palpations of individual sites and repetitions within each site. For example, a typical exam consisted of a verbal command to start at site 2, and after obtaining three threshold values (with an ISI of 2 seconds) the examiner was prompted to move to sites 10, 12, 5, 7, and 6 sequentially. Technical specifications are described in detail at the following secure website: (https://www.unc.edu/~ogmonbur/ea/wa-docs/wa-info1.html).
Fig 2. Mucosal and Muscle Algometer.

Real time data acquisition was conducted via a computer interface calibrated to A) Wegner Digital algometer® custom fitted with a cotton swab for the purposes of mucosal sensitivity assessment, B) Force Sensing Resistor (FSR) affixed on plastic thimble to examine pelvic muscles
Muscle Pressure Pain Detection Threshold and Tolerance Measurements
Our pelvic muscle algometer (Fig 2B) uses a pressure sensor capable of measuring a wide spectrum of force (<100g to >10kg or <1N to >98N) and allows direct and isolated palpation of the levator muscles (specifically right and left puborectalis) and perineal muscle complex. A computer program similar to the one described for the sensory assessment of the mucosa allows real time data acquisition while standardizing the rate of application, inter-stimulus and intra-stimulus intervals, and the order of examination. Technical specifications are described in detail at the following secure website: (https://www.unc.edu/~ogmonbur/ea-docs/ea-info1B.htm).
The pressure sensor is affixed to a plastic thimble that is worn over the examiner’s right index finger (Fig. 2B). The exam is conducted transvaginally in accordance with conventional clinical practice. However the manner in which the examination was conducted (specifically subject/examiner interaction, verbal cue, and anatomical landmarks) was standardized and scripted for the purposes of this protocol. The examination started with the dorsal surface of the right index finger facing the subject’s right pubic rami. With a bent index finger (approximately 30–60 degrees), the examiner palpates mid-pubic rami, which is the bony landmark for identifying the mid-segment (belly) of puborectalis muscle. After confirming the mid-position placement of the index finger, the examiner palpated the puborectalis muscle, which was immediately adjacent/behind the pubic rami (<0.5 cm). Subsequently, the examiner rotated the index finger downwards (approximate length of 1–1.5 cm) parallel to the length of puborectalis, until the transition point/insertion to superficial muscles (perineal muscle complex) was palpated. This was the point of pressure application for the assessment of pain detection threshold and tolerance on the right and left puborectalis muscle. Following the assessment of the right side, the examiner rotated his/her right hand in order to palpate the left puborectalis as described above. The perineal muscle complex, which is immediately underneath the 6 o’clock mucosal position, was palpated last. These muscle sites are adjacent to the respective lower vestibular mucosal sites (5, 6, and 7)
Participants were instructed to click a mouse at the first sensation of pain (pain perception threshold). However, the examiner terminated the pressure when she was no longer able to apply additional force to reach the participant’s threshold. Both the amount of force and the person who terminated the application (examiner versus subject) were recorded by the computer. Following the completion of threshold testing, participants were given the option to either proceed or opt out of the tolerance testing. Tolerance testing was performed (47/51= 92% of participants) after a 5-minute rest period. Participants were instructed to click the mouse when they were no longer able or willing to tolerate the pressure.
Statistical Analysis
Analysis of the mucosal/muscle algometer pain sensitivity measures presents special challenges due to the nature of the data. At least three replicate measurements were collected from each patient at each site, but for some patients, data was also collected on two different visits and/or from two different examiners. Also, in some cases, the examiner was unable to exert sufficient force to reach the subject’s threshold and terminated the measurement procedure before the patient experienced pain, resulting in a measurement that is right-censored. Nearly 50% of the muscle tolerance measures in the control group were terminated by the examiner in this manner.
Failure to account for censoring mechanism has the potential to bias the results of any comparison between cases and controls. Thus, to test the null hypothesis of no association between these measurements and vestibulodynia case status, we fit a Cox proportional hazards model to predict each algometer measurement based on a 0/1 dummy variable for case status. We treated all measurements that were terminated by the examiner as censored. To account for repeated measures for each patient, we treated the effect of each patient as a Gaussian random effect (frailty). See Ripatti and Palmgren14 or Therneau et al.15 for a more detailed description of this procedure. Each visit was also modeled as a random effect within the random effect for the subjects. To test the null hypothesis of no association between a given measure and vestibulodynia case status, we used a score test to test the null hypothesis that the coefficient for the case status dummy variable was equal to 0. The effect size of case status (and other covariates) was expressed as a hazard ratio, which is the relative likelihood that a subject will terminate the procedure at any given force level compared to the baseline risk group. In other words, if the hazard ratio for vestibulodynia case status is 2, then a given patient with vestibulodynia is twice as likely as a pain-free participant to terminate the procedure at any given force level.
Results
Demographics
Our cohort (n=55) consisted primarily of educated, white women in their late 20’s. Demographic characteristics of women with vestibulodynia did not differ significantly from the pain-free comparison group on: age (26.6 vs 27.7 yrs), ethnicity (80% vs 66.7% non-hispanic white), education (77.1% vs 50% college educated), and marital status (42.9% vs 22.2% married)
Reproducibility
To establish reproducibility of the threshold measurement, the first measurement collected for each subject at each site was compared to the third measurement collected by the same experimenter at the same site (which was collected approximately 4 seconds later). All subjects in the study (34 vestibulodynia patients and 21 healthy controls) were included in this analysis. To assess reproducibility of the pain threshold over time, the results of the first visit were compared to those of the second visit among subjects with two visits. Sixteen women participated in two different visits, including 6 pain-free and 10 women with vestibulodynia. Similarly, when two examiners collected measurements on the same subject at the same visit, we compared the measurements of the two examiners to assess inter-examiner reproducibility. There were 16 participants for whom we collected measurements from two examiners at the same visit, including 4 pain-free and 12 women with vestibulodynia. The mean difference (and associated standard errors) and the Pearson correlation coefficients between each pair of measurements are shown in Table 1. The correlation between the first and third measurement is very high for all three types of pain threshold measurements at all sites; all such correlations except for one were 0.8 or greater. The mean differences between the first and third measurements are small (ranging from 0.018 N and 0.151 N) for the mucosal measurements. However, the third muscle measurement (for both threshold and tolerance) was consistently lower than the first measurement (the mean differences ranged between 0.55 N and 1.82 N), suggesting that sensitivity increased with repetitive stimulation. The visit 1/visit 2 correlation is very high for both mucosal and muscle measurements at all examination sites: The correlations ranged from 0.547 to 0.871 for the mucosal data and from 0.748 to 0.85 for the muscle data. The mean visit 1/visit 2 differences were modest for both mucosal and muscle measurements (ranging between 0.008 N and 0.15 N for the mucosal measurements and 0.03 N and 1.68N for the muscle measurements). The experimenter 1/experimenter 2 correlations were lower (ranging from 0.107 to 0.577), and the mean experimenter 1/experimenter 2 differences were larger (ranging from 0.071 N to 0.43 N for the mucosal measurements and 0.17 N to 3.9 N for the muscle measurements). This is not surprising given the challenges of standardizing the actual conduct of the exam (see Discussion).
Group Differences in Mucosal and Muscle Pain Sensitivity Measures
Having established the reproducibility of the pain thresholds obtained by our instruments, we evaluated their ability to discriminate between vestibulodynia patients (cases) and pain-free controls. Figure 4 shows Kaplan-Meier plots of the set of mucosal detection thresholds for pain-free controls and patients with vestibulodynia. There is a large difference in the distribution of the mucosal perception thresholds between patients with vestibulodynia and the pain-free comparison group. In all six of the measured mucosal sites, women with vestibulodynia showed significantly lower pressure pain detection thresholds compared to their pain-free counterparts. This was particularly robust at the lower vestibule, corresponding to sites 5, 6, and 7.
Fig 4. Kaplan-Meier Plots for Vulvar Mucosal Pressure Pain Detection Threshold.
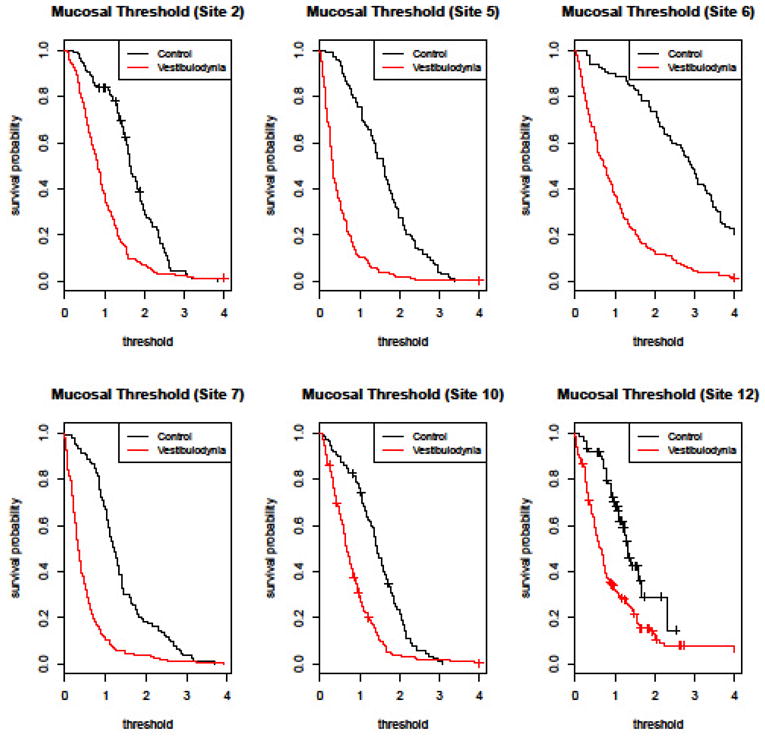
This figure shows the estimated “survival” probabilities (i.e. the probability of terminating the exam prior to a given amount of force) for controls and vestibulodynia patients. The termination pressure threshold (N) is shown on the x-axis, and the probability of surviving to given threshold is shown on the y-axis. For example, the probability that a control will not terminate the examination at site 2 prior to receiving 1 N of force is approximately 0.8. Vestibulodynia patients were more likely than controls to terminate the force at a given pressure at all 6 mucosal sites. The difference was more robust (as noted by a larger area between the two curves) at lower vestibule sites.
Similarly, compared to pain-free participants, patients with vestibulodynia showed lower pelvic muscle pressure pain threshold and tolerance measurements. Figure 5 shows the corresponding Kaplan-Meier plots for the muscle threshold and tolerance measurements at each of the three muscle sites.
Fig 5. Kaplan-Meier Plots for Pelvic Muscle Pressure Pain Threshold and Tolerance.
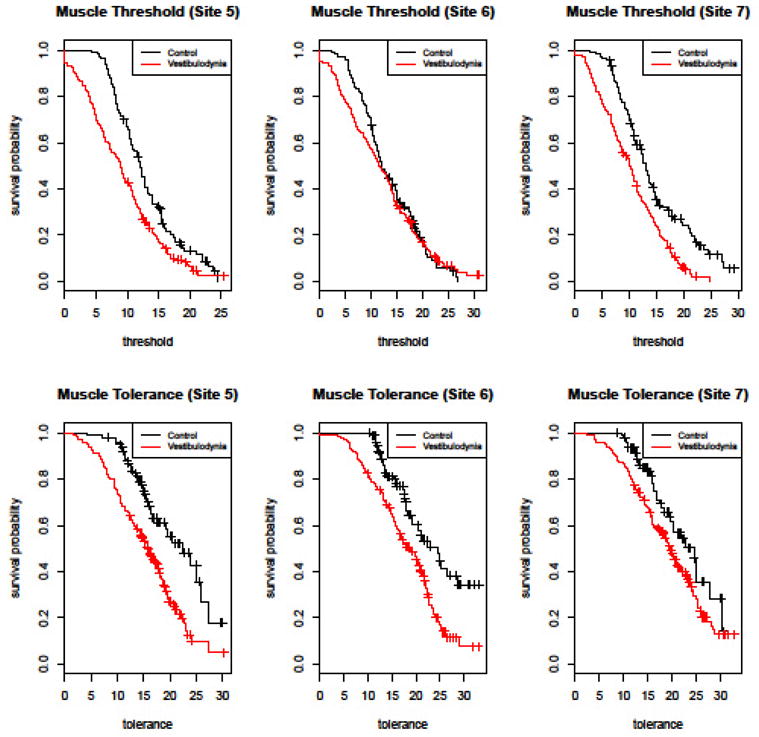
This figure shows the estimated “survival” probabilities (i.e. the probability of terminating the exam prior to a given amount of force) for controls and vestibulodynia patients. The termination pressure threshold/tolerance (N) is shown on the x-axis, and the probability of surviving to given threshold is shown on the y-axis. For example, the probability that a control will not terminate the muscle threshold examination at site 5 prior to receiving 10 N of force is approximately 0.7. Compared to pain-free participants, patients with vestibulodynia show lower pelvic muscle pressure pain threshold (upper panel) and tolerance (lower panel) measurements.
To formally test the null hypothesis of no difference between the mucosal detection thresholds between the two groups, we fit a Cox proportional hazards model to predict a subject’s mucosal threshold based on an indicator variable for case status (see Methods). We also fit a second model that adjusted for several covariates, namely a dummy variable for set (reflecting which examiner went first and second), and an interaction term between set and case status. The effects of other covariates were not significant so they were not included in the final model. These results are summarized in Table 2.
Table 2.
Hazard Ratio For Termination of Pressure Application At Specified Anatomical Sites
| Anatomical Sites | Site 12 | Site 2 | Site 5 | Site 6 | Site 7 | Site 10 |
|---|---|---|---|---|---|---|
| Mucosal Threshold | ||||||
|
| ||||||
| 5.59 (0.03) | 7.68* | 27.57* | 44.04* | 14.11* | 6.72 (0.0006) | |
|
| ||||||
| Muscle Threshold | ||||||
|
| ||||||
| 4.89 (0.003) | 1.80 (0.29) | 9.29* | ||||
|
| ||||||
| Muscle Tolerance | ||||||
|
| ||||||
| 6.31 (0.03) | 4.83 (0.05) | 3.02 (0.09) | ||||
Hazard Ratio is calculated with pain free controls as the reference group. Numerical value under each anatomical site represents the relative likelihood of terminating the pressure application by clicking the computer mouse. Since reference group consists of pain-free controls, numerical values in individual cell represent the magnitude of increase in likelihood of pressure termination by vestibulodynia patient at a given anatomical site.
Unless otherwise indicated in parenthesis, the P-value for relative likelihood of early pressure termination by vestibuloydnia (compared to pain free controls) was less than 0.0001.
The hazard ratio for vulvodynia case status was observed to be approximately 1.41 times the hazard ratio for controls. This difference remained basically unchanged (1.29) after adjustment for possible confounders. The hazard ratio varied from site to site. The ratio was largest at sites 5, 6, and 7 and smallest at site 12 (Table 2). This suggests that sites 5, 6, and 7 may be the most informative sites for discriminating between women with vestibulodynia and pain-free controls. Interestingly, when both examiners collected a set of measurements at the same visit, pain-free participants had a lower hazard ratio during the second set of measurements whereas vestibulodynia patients had a slightly higher hazard ratio. In other words, women without pain were less likely to terminate the procedure at a given force level during the second set than during the first set of measurements; no difference was observed in vestibulodynia patients.
A similar approach tested the null hypothesis that the vestibulodynia patients and pain-free comparison group had equal hazard ratios for the muscle measurements (both pain threshold and tolerance). Once again, we fit two Cox proportional hazards model to predict a subject’s muscle threshold based on case status as vestibulodynia (Table 2). We also fit a second set of Cox models that adjusted for covariates, but none of the coefficients of the covariates were significantly different from 0, so these results are not reported in Table 2.
We observed a significant association between vestibulodynia case status and muscle threshold measures when measurements from all three sites were combined (HR=2.9, p=0.047). Examining each site separately, there is a significant association between vestibulodynia case status and measurements at two of the three measured sites, namely sites 5 (HR=4.89, p=0.003) and 7 (HR=2.23, p<0.0001). There is a similar pattern of association with respect to the muscle tolerance measures: the measurements were associated with vestibulodynia case status across all three sites combined (HR=3.09, p=0.005), as well as at sites 5 (HR=6.31, p=0.034) and 6 (HR=4.83, p=0.049) individually.
Clinical Relevance (Validity) of the Mucosal Pain Threshold as it relates to Subjective Pain Reports
For the purpose of validating our instrument, the association between a patient’s self-reported pain during intercourse and the patient’s mucosal and muscle measurements was evaluated. Each participant was asked to rate her average pain during intercourse on a scale from 0 to 100. To assess the association between mucosal threshold and intercourse-related pain, we fit a Cox proportional hazards model to predict each woman’s mucosal threshold based on her intercourse-related pain level, as described previously. Two models were fit: one with only intercourse-related pain as a predictor, and one with intercourse-related pain adjusted for examiner and measurement set. We observed a statistically significant association between intercourse-related pain and mucosal threshold. The strength of this association varied greatly from site to site. The association was strongest at sites 6 (p=0.009), 5 (p=0.004), and 7 (p= 0.028) and much weaker and non-significant at the upper vestibular sites 2 (p=0.75), 10 (p=0.32), and 12 (p=0.38). For example, at mucosal site 6, a respondent with a mild pain report (VAS=30) has a hazard ratio of 2.46 compared to a respondent with no pain (VAS=0), and a respondent with a moderate pain report (VAS=60) has a hazard ratio of 6.05 compared to a respondent with no pain. There was no statistically significant association between intercourse-related pain and the muscle threshold or muscle tolerance measurements.
Case-Control Classification
We have shown that vestibulodynia patients have lower average mucosal thresholds than pain free controls. This raises the question of whether this result can be used to more accurately diagnose patients with vestibulodynia in a clinical setting. We attempted to answer this question by using a simple procedure to develop a classifier to discriminate between vestibulodynia patients and pain-free controls. Since we previously observed that mucosal measurements at sites 5, 6, and 7 are most strongly associated with intercourse-related pain and case status, we built our classifier using only measurements from these three sites. For each subject, we averaged her first three mucosal threshold measurements at sites 5, 6, and 7. We then averaged these three averages to construct our final classifier. We only considered measurements collected in the first measurement set of the first visit for each patient. Also, we only considered measurements collected from examiner 1, since we observed considerable variation in measurements collected by different examiners, and examiner 1 collected more data than the other examiner.
The ROC curve for predicting case status based on this classifier is shown in Fig. 6. Note that we can obtain both high sensitivity and specificity by choosing an appropriate cutoff for discriminating between cases and controls. In particular, if we classify subjects with an average threshold force of less than 1 N as cases and subjects with an average threshold of greater than 1 N as controls, then we obtain a sensitivity of 85.7% and a specificity of 82.4%. This suggests that our methodology has the potential to help diagnose patients with provoked vestibulodynia.
Fig 6. Receiver Operator Curve For Predicting Case Status.
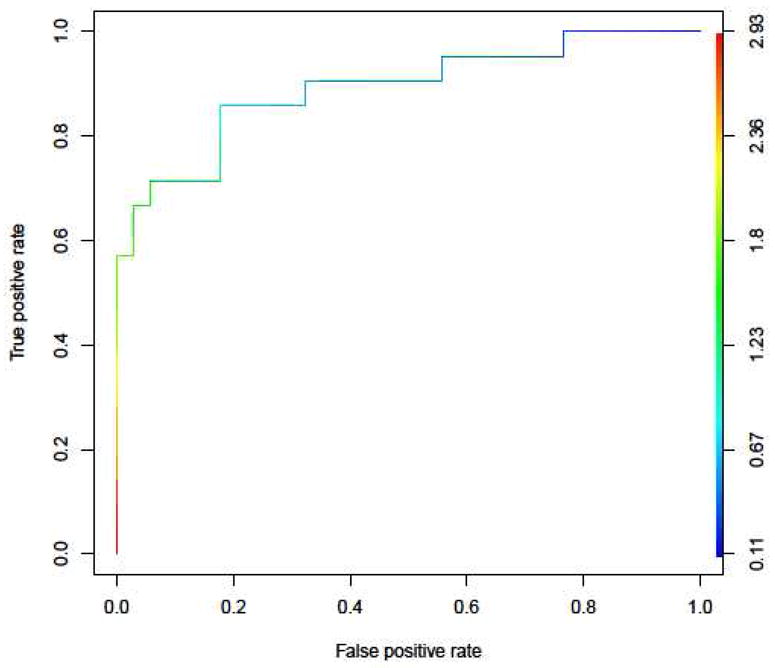
This figure shows the receiver operating characteristics (ROC) curve demonstrating the predictive capability of the average of the three lower vestibular mucosal sites to predict vestibulodynia case status. If we classify subjects with an average threshold of less than 1 N as cases and subjects with an average threshold of greater than 1 N as controls, then we obtain a sensitivity of 85.7% and a specificity of 82.4%.
Discussion
Provision for a reliable and valid system of pain assessment is a necessary first step toward describing the prevalence, natural history and treatment outcomes in vestibulodynia. This is particularly important in light of significant inter-individual variability of sensory thresholds, quintessential to human perception in both diseased and non-diseased states.4 In this study, we demonstrate that standardized methodologies based on psychophysical approaches provide reliable indices of pelvic muscle and mucosal pressure pain sensitivity, and that select indices relate to patients’ clinical pain reports.
The usefulness of examination methods requires both reliability (reproducibility) and validity (accuracy) of the outcome measures. The reliability score is the conceptual sum of four dynamic domains: intra-examiner and inter-examiner reliability, stability of phenomenon being measured over time, and reliability of the participant’s pain report.3 To date, limited work has been conducted on these domains with respect to the clinical measurements of pelvic muscle and mucosal sensitivity. The methods we employed enabled investigation of the joint and independent contribution of these domains (e.g. subject vs. experimenter vs. time) on the reliability of measures of mucosal (threshold) and muscle (threshold & tolerance) pressure pain sensitivity obtained by two examiners as much as two weeks apart.
The measures were found to be temporally stable, as demonstrated by the high correlation between values obtained from subsequent repetitions in the same visit and between values obtained two weeks apart. The correlation between subsequent repetitions in a single exam was excellent (r ≥ 0.8) indicating high reliability within the course of an exam. While the between-visit correlations for the muscle and mucosal measurements were within conventional norms (r ≥ 0.6),3 the mucosal correlations were not consistently over 0.6, being as low as 0.54 at some sites (Table 1). However, upon closer inspection, the relatively lower between-visit correlations (r=0.5–0.6) were consistently associated with upper vestibular sites (Fig 1); whereas between-visit correlations for the lower three mucosal sites were on the order of 0.8 and higher, similar in magnitude to those of the muscle measurements. Meshab9 observed a similar discrepancy, which can be attributed to anatomical challenges. Because of immediate proximity to the pubic bone, urethral meatus, and glan clitoris --- all within a radius of 1 cm from the examined sites --- slight variation in the angle of cotton swab application likely leads to variation in the measured threshold (Fig 1).
Inter-examiner reliability of pain measures
We observed low inter-examiner correlations, particularly for mucosal sites. Only one mucosal site (6 o’clock) reached an acceptable inter-examiner correlation (r=0.577). The six o’clock site was the only site tested for which the perpendicular application of pressure using a cotton swab could be conducted under direct visualization with a high degree of manual accuracy. On average the inter-examiner correlations for muscle were higher than those for the mucosa; the highest correlation for muscle was seen at the 7 o’clock position. This is attributed to the examiner’s ability to apply pressure in an anatomically congruent manner (right handed examination of the patient’s right pelvic muscle). The examiner used the right index finger to sequentially examine the right, left, and mid position. Because muscle tolerance measures are primarily a reflection of examiner’s maximal force, lower correlation between the two examiners was observed for pain tolerance than for pain detection thresholds. The lower inter-examiner reliability, particularly for mucosal assessment, highlights the importance of training and calibrating the examiners.
Validity of pain measures
As eloquently discussed by Dworkin et al.3 “clinical measure may be extremely reliable or repea=, but if a measure does not accurately portray the entity examined, then it provides no useful information for diagnosis.” The construct of validity requires either 1) a “gold standard,” in the form of an “accepted truth” based on empirical data, or 2) a validated instrument that can be compared with the new approach. In our analysis, we used participants’ self-reported pain during intercourse, a clinically meaningful construct, as a proxy for a “gold standard”. Of the tested vestibular sites (six), only three lower vestibular sites (5, 6, and 7) were associated with intercourse-related pain. Measures of muscle pain sensitivity were not associated with participants’ self-reported pain during intercourse, despite being associated with case status as described below.
Usefulness of pain measures in vestibulodynia identification
Compared to pain-free controls, vestibulodynia cases reported lower mucosal and muscle thresholds, suggesting higher sensitivity. This was particularly evident for the lower vestibular sites (5, 6, and 7), suggesting that these sites robustly discriminated cases from controls. ROC analysis further demonstrated that an average threshold of less than 1N provided a cut-off for discriminating between cases and controls with a sensitivity of 85.7% and a specificity of 82.4%. This suggests that our methodology has the potential to help diagnose patients with provoked vestibulodynia.
With respect to the muscle threshold measures, only two (sites 5 and 7) of the three tested sites were significantly associated with case status. The group differences at sites 5 and 7 were notably smaller for muscle tolerance measures. In fact, the hazard ratio for muscle pain tolerance at site 7 did not reach statistical significance (p= 0.09), despite being remarkably robust (p<0.0001) for the muscle pain threshold measure.
Limitations
The extent to which increased sensitivity of the mucosa affected the pain threshold measured for the pelvic musculature remains unclear. Because of the thinness of mucosa (<1 mm), our methodology could have led to termination of pressure during the muscle examination due to the experience of mucosal pain secondary to soft tissue traction. Because gentle pressure (enough to indent the mucosa approximately 1 N) was sufficient for discriminating cases from controls, the higher force used for the muscle examination in cases would be expected to exceed the mucosal pain threshold of these patients.
Regardless of this possibility, our results suggest that transvaginal assessment of muscle without irritating the overlying mucosa is possible. First, all of our participants with vestibulodynia and mucosal pain thresholds of 1–4N completed the muscle threshold and tolerance assessment where pressures as high as 30 N were sometimes delivered to reach the pain threshold. Second, the 6 o’clock mucosal site was one of the most sensitive sites where pressures as low as 1 N led to termination by subjects with vestibulodynia. However, an association between case status and muscle pressure pain threshold (p=0.29) and tolerance (p=0.06) at this position was not observed, suggesting that the two methodologies (mucosal vs muscle) captured different, though arguably related constructs. Taken together, these observations highlight the feasibility of transvaginal assessment of pelvic muscles without irritating the overlying vulvar mucosa.
We strived to standardize various facets of subject/examiner interaction and clinical assessment. The research coordinator and the examiners followed a scripted protocol for interacting with study participants. The coordinator explained the different aspects of the exam and prompted the transition from one segment to another. However training and calibration of examiners was quite limited in scope. In fact, it was during the conduct of the present study that we identified elements of the exam that needed to be standardized. For example, it was only after we began our study that we noticed that a slight deviation of the wrist during mucosal assessment can change the intended location and angle of application and that the anatomical distribution of the vulvar mucosa and muco-cutnaous junction differs among subgroups of women.
The extent to which increased pain sensitivity of the pelvic musculature affected the pain threshold measured at the vulvar mucosa remains unclear. The etiology of muscle involvement in vestibulodynia is commonly viewed as reactive and secondary to overlying mucosal sensitivity. However, we cannot compare the relative merit and directionality of the relationship between muscle and mucosal sensitivity based on the magnitude of HR ratios alone. Unlike mucosa which has a high fidelity input, the musculoskeletal input is characterized by diffuse poorly localized low fidelity input.18 Therefore, it is plausible that muscle may be the primary source of pain and functional aberration in some women, with referral to the overlying mucosa. In other cases the mucosal input is primary with secondary muscle involvement. Our study was not designed to address this question, but this methodology will enable the design and implementation of future studies in order to evaluate the directionality of this relationship (P01 NS045685, currently underway).
To our knowledge the work reported in this paper is the first research aimed at operationalizing a standardize and validated clinical pain examination of the pelvic region. Research into the pathophysiology of chronic pelvic pain in women is in its infancy and is in urgent need of collaborative efforts among clinicians and scientists across a broad range of expertise. Success will be dependent on standardized approaches, and we hope that they are adopted and further developed by other investigators.
Fig 3.

Anatomical Location of The Tested Muscle Sites
Table I.
Correlation Coefficient and Mean Difference (SE) for Mucosal and Muscle Measurements at Specified Anatomical Sites
| Anatomical Sites* | Site 12 | Site 2 | Site 5 | Site 6 | Site 7 | Site 10 |
|---|---|---|---|---|---|---|
| Mucosal Threshold | ||||||
|
| ||||||
| Within Examiner (r) | 0.84 | 0.82 | 0.84 | 0.86 | 0.85 | 0.83 |
| Mean difference (SE) | −0.05 (0.05) | 0.15 (0.05) | 0.02 (0.05) | 0.08 (0.07) | −0.08 (0.04) | −0.06 (0.05) |
| Between Examiner | 0.27 | 0.11 | 0.11 | 0.58 | 0.31 | 0.11 |
| 0.43 (0.16) | 0.20 (0.15) | 0.07 (0.13) | −0.25 (0.12) | 0.07 (0.13) | 0.31 (0.15) | |
| Between Visit | 0.66 | 0.55 | 0.82 | 0.86 | 0.87 | 0.58 |
| −0.08 (0.07) | −0.15 (0.09) | −0.00 (0.08) | −0.23 (0.11) | −0.11 (0.07) | 0.02 (0.08) | |
|
| ||||||
| Muscle Threshold | ||||||
|
| ||||||
| Within Examiner | 0.84 | 0.87 | 0.81 | |||
| 0.86(0.34) | 1.46 (0.36) | 0.76 (0.40) | ||||
| Between Examiner | 0.62 | 0.58 | 0.85 | |||
| −2.38 (0.84) | −2.98 (0.85) | −1.17 (0.67) | ||||
| Between Visit | 0.67 | 0.67 | 0.61 | |||
| −0.96 (0.61) | −1.85 (0.82) | −0.03 (0.70) | ||||
|
| ||||||
| Muscle Tolerance | ||||||
|
| ||||||
| Within Examiner | 0.84 | 0.86 | 0.76 | |||
| 0.951 (0.35) | 0.545 (0.39) | 1.82 (0.48) | ||||
| Between Examiner | −0.11 | −0.28 | 0.20 | |||
| −3.90 (0.92) | −2.97 (1.03) | −3.37 (0.85) | ||||
| Between Visit | 0.56 | 0.67 | 0.45 | |||
| −0.9 (0.82) | −1.68 (0.84) | −0.52 (0.99) | ||||
Perspective.
This study describes performance characteristics of novel methodologies for assessing pelvic muscle and mucosal sensitivity. These pain sensitivity measures were reproducible and associated with subjective pain reports and vestibulodynia case status and represent an important step toward a more precise case definition for vestibulodynia and related disorders.
Acknowledgments
The authors will like to extend their heartfelt gratitude to the clinical and nursing staff at the UNC women’s hospital who volunteered to help with the early stages of the protocol development and provided helpful input on protocol optimization. In addition, we are especially indebted to the following individuals: Ollie Monbureau (engineer and designer), Katie Missett Harper (research associate who developed the protocol), and Alisa Eanes, Caitlin Martin, and Jasmine Lewis for the countless hours spent on data entry and reconciliation.
Footnotes
Disclosures: This research was partly supported by the Department of Obstetrics and Gynecology at the University of North Carolina at Chapel Hill, National Institute of Heath awards HD 053631(Denniz Zolnoun), DE07509 (William Maixner), NS045688 (William Maixner), and UL1RR025747 from the National Center for Research Resources. Authors have no reportable conflict of interest.
Publisher's Disclaimer: This is a PDF file of an unedited manuscript that has been accepted for publication. As a service to our customers we are providing this early version of the manuscript. The manuscript will undergo copyediting, typesetting, and review of the resulting proof before it is published in its final citable form. Please note that during the production process errors may be discovered which could affect the content, and all legal disclaimers that apply to the journal pertain.
References
- 1.Bornstein J, Maman M, Abramovici H. “Primary” versus “secondary” vulvar vestibulitis: one disease, two variants. Am J Obstet Gynecol. 2001;184:28–31. doi: 10.1067/mob.2001.108173. [DOI] [PubMed] [Google Scholar]
- 2.Diatchenko L, Nackley AG, Slade GD, Fillingim RB, Maixner W. Idiopathic pain disorders--pathways of vulnerability. Pain. 2006;123:226–30. doi: 10.1016/j.pain.2006.04.015. [DOI] [PubMed] [Google Scholar]
- 3.Dworkin SF, LeResche L. Research diagnostic criteria for temporomandibular disorders: review, criteria, examinations and specifications, critique. Journal of craniomandibular disorders : facial & oral pain. 1992;6:301–55. [PubMed] [Google Scholar]
- 4.Fagius J, Wahren LK. Variability of sensory threshold determination in clinical use. J Neurol Sci. 1981;51:11–27. doi: 10.1016/0022-510x(81)90056-3. [DOI] [PubMed] [Google Scholar]
- 5.Friedrich EG., Jr Vulvar vestibulitis syndrome. The Journal of reproductive medicine. 1987;32:110–4. [PubMed] [Google Scholar]
- 6.Gracely RH. Evaluation of multi-dimensional pain scales. Pain. 1992;48:297–300. doi: 10.1016/0304-3959(92)90076-N. [DOI] [PubMed] [Google Scholar]
- 7.Harlow BL, Stewart EG. A population-based assessment of chronic unexplained vulvar pain: have we underestimated the prevalence of vulvodynia? Journal of the American Medical Women’s Association (1972) 2003;58:82–8. [PubMed] [Google Scholar]
- 8.Lund JP, Widmer CG. Evaluation of the use of surface electromyography in the diagnosis, documentation, and treatment of dental patients. Journal of craniomandibular disorders : facial & oral pain. 1989;3:125–37. [PubMed] [Google Scholar]
- 9.Masheb RM, Lozano C, Richman S, Minkin MJ, Kerns RD. On the reliability and validity of physician ratings for vulvodynia and the discriminant validity of its subtypes. Pain medicine (Malden, Mass) 2004;5:349–58. doi: 10.1111/j.1526-4637.2004.04060.x. [DOI] [PubMed] [Google Scholar]
- 10.Pukall CF, Binik YM, Khalife S. A new instrument for pain assessment in vulvar vestibulitis syndrome. J Sex Marital Ther. 2004;30:69–78. doi: 10.1080/00926230490275065. [DOI] [PubMed] [Google Scholar]
- 11.Pukall CF, Binik YM, Khalife S, Amsel R, Abbott FV. Vestibular tactile and pain thresholds in women with vulvar vestibulitis syndrome. Pain. 2002;96:163–75. doi: 10.1016/s0304-3959(01)00442-0. [DOI] [PubMed] [Google Scholar]
- 12.Pukall CF, Payne KA, Binik YM, Khalife S. Pain measurement in vulvodynia. J Sex Marital Ther. 2003;29 (Suppl 1):111–20. doi: 10.1080/713847136. [DOI] [PubMed] [Google Scholar]
- 13.Reed BD, Crawford S, Couper M, Cave C, Haefner HK. Pain at the vulvar vestibule: a web-based survey. Journal of lower genital tract disease. 2004;8:48–57. doi: 10.1097/00128360-200401000-00011. [DOI] [PubMed] [Google Scholar]
- 14.Ripatti S, Palmgren J. Estimation of multivariate frailty models using penalized partial likelihood. Biometrics. 2000;56:1016–22. doi: 10.1111/j.0006-341x.2000.01016.x. [DOI] [PubMed] [Google Scholar]
- 15.Therneau TM, Grambsch PM, Pankratz VS. Penalized Survival Models and Frailty. Journal of Computational and Graphical Statistics. 2003;12:156–75. [Google Scholar]
- 16.Tu FF, As-Sanie S, Steege JF. Musculoskeletal causes of chronic pelvic pain: a systematic review of diagnosis: part I. Obstet Gynecol Surv. 2005;60:379–85. doi: 10.1097/01.ogx.0000167831.83619.9f. [DOI] [PubMed] [Google Scholar]
- 17.Tu FF, Fitzgerald CM, Kuiken T, Farrell T, Norman Harden R. Vaginal pressure-pain thresholds: initial validation and reliability assessment in healthy women. Clin J Pain. 2008;24:45–50. doi: 10.1097/AJP.0b013e318156db13. [DOI] [PubMed] [Google Scholar]
- 18.Walder RY, Sluka KA. Bilateral, long lasting hyperalgesia due to repeated excitation of muscle nociceptors: A role of ASIC3. In: Graven-Nielsen T, Arendt-Nielsen L, Mense S, editors. Fundamentals of Musculosketal Pain. Seattle: International Association for the Study of Pain; 2008. pp. 75–86. [Google Scholar]
- 19.Zolnoun D, Hartmann K, Lamvu G, As-Sanie S, Maixner W, Steege J. A conceptual model for the pathophysiology of vulvar vestibulitis syndrome. Obstet Gynecol Surv. 2006;61:395–401. doi: 10.1097/01.ogx.0000219814.40759.38. quiz 23. [DOI] [PubMed] [Google Scholar]
- 20.Zolnoun D, Park EM, Moore CG, Liebert CA, Tu FF, As-Sanie S. Somatization and psychological distress among women with vulvar vestibulitis syndrome. International journal of gynaecology and obstetrics: the official organ of the International Federation of Gynaecology and Obstetrics. 2008;103:38–43. doi: 10.1016/j.ijgo.2008.05.016. [DOI] [PMC free article] [PubMed] [Google Scholar]