

Abstract
It has long been known that human vision is more sensitive to contours at cardinal (horizontal and vertical) orientations, compared with oblique orientations; this is the “oblique effect.” However, the real-world relevance of the oblique effect is not well understood. Experiments here suggest that this effect is linked to scene perception, via a common bias in the image statistics of scenes. This statistical bias for cardinal orientations is found in many “carpentered environments” such as buildings and indoor scenes, and some natural scenes. In Experiment 1, we confirmed the presence of a perceptual oblique effect in a specific set of scene stimuli. Using those scenes, we found that a well known “scene-selective” visual cortical area (the parahippocampal place area; PPA) showed distinctively higher functional magnetic resonance imaging (fMRI) activity to cardinal versus oblique orientations. This fMRI-based oblique effect was not observed in other cortical areas (including scene-selective areas transverse occipital sulcus and retrosplenial cortex), although all three scene-selective areas showed the expected inversion effect to scenes. Experiments 2 and 3 tested for an analogous selectivity for cardinal orientations using computer-generated arrays of simple squares and line segments, respectively. The results confirmed the preference for cardinal orientations in PPA, thus demonstrating that the oblique effect can also be produced in PPA by simple geometrical images, with statistics similar to those in scenes. Thus, PPA shows distinctive fMRI selectivity for cardinal orientations across a broad range of stimuli, which may reflect a perceptual oblique effect.
Introduction
Normal human observers perceive horizontal and vertical contours more accurately, compared with contours at oblique orientations (Appelle, 1972; Orban et al., 1984). Although this “oblique effect” has been known for >150 years (Mach, 1861), it remains unresolved how this orientation bias benefits visual perception, and where the bias arises in the brain.
Because the oblique effect is linked to stimulus orientation, and orientation-selective cells are common in primary visual cortex (V1), prior psychophysical and physiological experiments have often hypothesized a neural correlate of the perceptual oblique effect in lower-level, retinotopic visual cortex (Vogels and Orban, 1985; Furmanski and Engel, 2000). One study (Furmanski and Engel, 2000) reported a stronger functional magnetic resonance imaging (fMRI) response for cardinal (i.e., horizontal and vertical) over oblique orientations in V1. However, recent fMRI studies reported no such V1 activity bias (Swisher et al., 2010; Freeman et al., 2011). In fact, Swisher et al. (2010) found the opposite orientation preference in V1. In any event, none of these studies sampled cortical activity beyond the lower-level retinotopic areas.
Here we tested an alternative possibility, that the oblique effect reflects processing at higher (post-retinotopic) levels of the visual cortex, related to scene perception. Evidence for this possibility arises from image statistics of natural scenes and objects (Olshausen and Field, 2000; Howe and Purves, 2005). Among many image categories tested previously, scenes (including “carpentered environments” such as cityscapes or building interiors) were the only image category that was dominated by contours at cardinal orientations, compared with oblique orientations (Keil and Cristóbal, 2000; Torralba and Oliva, 2003). Thus, scene perception may benefit especially from a higher sensitivity to cardinal orientations. Accordingly, one might expect to find a preference for cardinal orientations within the cortical areas that selectively process scenes, such as the parahippocampal place area (PPA; Epstein and Kanwisher, 1998; Nasr et al., 2011).
Previous behavioral evidence for an oblique effect in scene perception is controversial (for review, see Hansen and Essock, 2004). Therefore, partly as a prerequisite for our main fMRI study, we first confirmed that a perceptual oblique effect can also influence scene perception. Then we tested whether a preference for cardinal orientations can be detected within PPA and other cortical visual areas, using that same set of scenes. To extend that result, we then tested and confirmed that PPA showed a similar cardinal orientation bias in response to two different types of simple geometrical stimuli.
Materials and Methods
Participants
For each experiment, human subjects were selected from a total pool of 27 subjects (17 females) aged 20–36 years. All subjects had normal or corrected-to-normal visual acuity and radiologically normal brains, without history of neuropsychological disorder, and furnished written informed consent. All experimental procedures conformed to NIH guidelines, as approved by Massachusetts General Hospital protocols.
Visual Stimuli
Experiment 1
The test scenes comprised 20 images of indoor and outdoor scenes selected from Google Images. All images in this study were achromatic, and presented at the center of the display screen against a uniform gray background. The psychophysics was based on both raw scenes and spatially filtered versions thereof, in parallel tests (see Fig. 1A,B). Spatial filtering was based on analysis of fast Fourier transforms (FFTs), and band-passing those spectral components in horizontal and vertical orientations (bandwidth = 0.25 cycle/degree).
Figure 1.
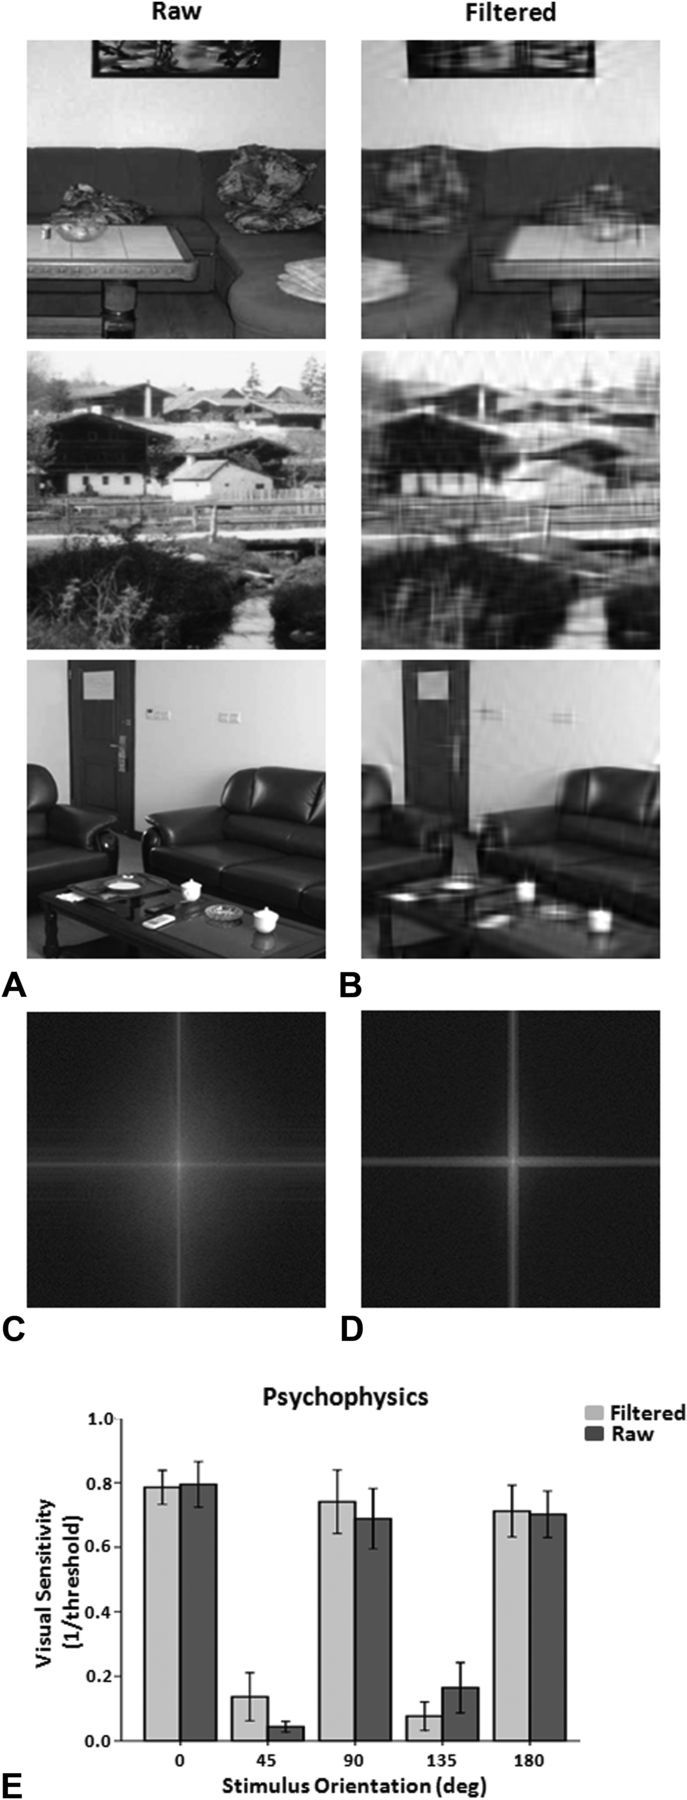
A, B, Examples of scene stimuli, both raw (A) and spatially filtered (B), in Experiment 1. C, D, Fast Fourier transforms averaged across all raw (C) and spatially filtered (D) scenes confirm the dominance of horizontal and vertical orientations in their power spectrum. Stimulus examples and FFTs are illustrated only in the upright orientation; in the actual experiment the stimuli were presented at systematically varied orientations within a circular aperture. E, Perceptual sensitivity (1/threshold) for detecting deviation from cardinal and oblique orientations. As expected from previous studies of the oblique effect, subjects detected such deviations at lower thresholds (i.e., higher sensitivity) for the cardinal orientations, compared with the oblique ones.
For psychophysical tests (Experiment 1), stimuli were presented on a LCD laptop monitor (Dell; 1920 × 1080 pixels resolution, 60 Hz refresh rate). Matlab 7.8 (MathWorks) and Psychophysics Toolbox controlled stimulus presentation. During all fMRI experiments, stimuli were presented via a LCD projector (Sharp XG-P25; 1024 × 768 pixels resolution, 60 Hz) on a rear-projection screen.
Experiment 2
Stimuli were computer-generated arrays of 100 overlapping squares (see Fig. 2A). Square size varied randomly between 0.3 and 3°. Square position varied randomly within a circular aperture (diameter = 20°). These images were unfiltered.
Figure 2.

Group-averaged fMRI activity for scenes shown at cardinal-vs-oblique orientations (Experiment 1). A, B, The map shows a ventral view of the inflated (A) and flattened (B) cortical surfaces. The borders of PPA, TOS, RSC, and V1 are shown using black, green, blue, and white lines respectively. White dashed lines indicate the peripheral visual field representation (3–10° of visual angle), and white asterisks indicate the foveal representation. Activity is based on a random-effects analysis. C, ROI analysis in PPA and V1. Orientation differences were significant only in PPA (*p < 0.05; **p < 0.01; paired t test).
Experiment 3
Stimuli were unfiltered arrays of straight and curved lines (see Fig. 4A,B) presented against a uniform gray background. In each stimulus image, straight and curved lines were presented at either cardinal or oblique orientations (but not both), positioned randomly within a rectangular aperture (20 × 27°). Additional stimulus properties (including total line length, thickness, contrast and mean luminance) were equated across all images.
Figure 4.

Stimulus examples in Experiment 3, based on arrays of straight lines (A, top) or half-circles (B, top) and their corresponding FFTs (bottom). The respective group-averaged fMRI activity maps (random-effects analysis) are shown in C and D. Black lines show the PPA border in the same group of subjects.
Behavioral tasks
Psychophysics
Two otherwise-identical scenes were presented for 2 s, each centered 8.25° from the fixation point, on the left and right sides of the screen. Scenes were presented within a circular aperture (11° diameter). In each trial, the orientation of one image (the reference image) was aligned along either the cardinal (0, ±90 and ±180°) or the oblique (±45 and ±135°) orientations, while the orientation of the other image varied slightly relative to the reference. Via keypad, subjects reported whether they saw a difference between the orientations or not, in a two alternative forced choice. Using a staircase procedure, the size of the orientation difference was adjusted so that subjects detected the difference in 75% of the trials, for each tested orientation. Each subject participated in 600 trials. Based on the measured threshold at 75% detection, sensitivity was defined for each orientation as 1/threshold. Subjects practiced with the stimuli and task before data collection. For all tasks in this study, response accuracy was stressed more than speed. The sequence of trials was selected randomly. Location of the reference image (left vs right) was counterbalanced.
Functional imaging
In all experiments, trials were blocked according to stimulus orientations (block duration = 16 s; 1 s/trial).
Experiment 1.
Subjects participated in 5 runs. Each run contained 10 blocks (2 blocks/orientation). The block sequence was selected semi-randomly. Additional blocks of uniform gray images were included at the beginning and end of each run as a baseline condition. In each experimental trial, one image was centered on the screen, within a circular aperture (radius = 10°), in addition to a partially transparent dot located at unpredictable locations on the display. Subjects reported whether or not they could detect the probe dot, as a dummy task distributing spatial attention across the stimulus display. A staircase method was used to adjust dot contrast, to keep detection accuracy at 75%.
Experiment 2.
Subjects participated in 15 runs. Each run included one block for each stimulus orientation, beginning and ending with additional uniform gray baseline blocks. Because dot detection was more difficult on the square arrays (see Fig. 2A), the dummy attention task used in Experiment 2 was a one-back task. Subjects reported whether each image was the left-right flipped version of the previous image, or not.
Experiment 3.
Subjects participated in 12 runs, each containing 2 stimulus blocks (1 block/orientation). Subjects performed the dummy dot detection task described in Experiment 1.
Imaging procedures and data analysis
All subjects were scanned at 3T (Siemens Tim Trio). Gradient echo EPI sequences were used for all functional imaging (TR 2000 ms, TE 30 ms, flip angle 90°, 3.0 mm isotropic, 33 axial slices) sessions. For most (23 of 27) subjects, the field of view included the whole brain. In the four remaining subjects, this field of view missed the far superior tip of parietal cortex. A 3D MP-RAGE sequence (1.0 mm isotropic) was used to acquire anatomical images from each subject. Functional and anatomical data were preprocessed and analyzed using FreeSurfer and FS-FAST (http://surfer.nmr.mgh.harvard.edu/).
For each subject, inflated and flattened cortical surfaces were reconstructed from the MR-based anatomical images. All functional images were motion corrected, spatially smoothed using a 3D Gaussian kernel (2.5 mm HWHM), and normalized across scans. The hemodynamic response was estimated by a γ function; then the average signal intensity maps were calculated for each condition. Voxelwise statistical tests were conducted by computing contrasts using a univariate general linear model. Finally, the significance levels were projected onto the inflated/flattened cortex after rigid coregistration of functional and anatomical volumes. Functional maps were spatially normalized across sessions and across subjects using a spherical transformation, then averaged using both fixed and random effects models.
Regions of interest analysis
For each individual subject, regions of interest (ROIs) were defined for areas PPA, TOS (transverse occipital sulcus), RSC (retrosplenial cortex), and FFA (fusiform face area), based on independent localizing stimuli (faces vs scenes). A ROI for object-selective LOC (lateral occipital complex) was defined based on presentation of objects versus grid-scrambled objects.
The V1-V2 border was defined based on cytoarchitectonics (myelination). The cortical representation of specific retinotopic isoeccentricities was based on additional scans using radial checkerboard patterns. Within different blocks, a foveal disk (r = 1.5°) and a peripheral annulus (5°-10° radius) were presented. The contrast between these two blocks was used to define the peripheral stimulus borders (see Fig. 2B; Nasr et al., 2011).
In all analysis, fMRI activity for each condition was measured relative to the activity during presentation of uniform gray stimuli (baseline). In Experiment 1, the activity from each subject was also normalized relative to its maximum and minimum levels (normalized activity = (activity − min)/(max − min). This process ensured that the all effects significantly affected the whole pool of subjects.
Results
First, we used psychophysics (n = 13) to confirm that the perceptual oblique effect generalized to a set of scenes, which could then be used in a subsequent fMRI study of the oblique effect. In parallel experiments, a common set of scenes was presented either raw or spatially filtered (Fig. 1A,B). The filtering enhanced the intrinsic bias for cardinal orientations in these scenes (Methods). In both raw and filtered scenes, FFT analysis showed stronger power at cardinal compared with oblique orientations (Fig. 1C,D).
The psychophysical results (Fig. 1E) confirmed higher sensitivity to deviations from cardinal orientations compared with deviations from oblique orientations, as reflected in significantly lower thresholds to the former (two-factors repeated-measures ANOVA; F(4,48) = 46.27, p < 10−5). No significant difference was found between detection sensitivity for raw versus spatially filtered stimuli (F(1,12) = 0.20, p = 0.66), without significant interaction between the two factors (F(4,48) = 0.45, p = 0.84). Post hoc analysis did not yield any significant (Bonferroni; p > 0.78) difference between sensitivity to cardinal orientations (0 vs ±90 vs ±180°) or oblique orientations (±45 vs ±135°), in either set of scenes.
To test for brain correlates of this perceptual oblique effect, we recorded fMRI activity in 13 subjects. To optimize the orientation bias, only spatially filtered stimuli were used for fMRI. To stabilize attention level during scanning, subjects performed an attention-demanding “dummy” task (dot detection), which was irrelevant to the stimulus orientation. We found no difference between dot contrast (at 75% detection threshold) across orientation conditions (repeated-measures ANOVA; F(4,48) = 1.67, p = 0.19). For three subjects we also measured eye movements (EyeLink, SR Research), and the results confirmed that gaze position (Freeman et al., 2011) did not differ across experimental conditions.
Group-averaged whole brain activity maps (random effects, Fig. 2A,B) showed that scenes with dominant power at cardinal orientations evoked a significantly stronger response in PPA, compared with oblique orientations. A ROI analysis confirmed that PPA activity was significantly enhanced to the cardinal (relative to oblique) orientations (F(4,48) = 41.21, p < 10−10; Fig. 2C). In addition, we found that scenes presented at the typical upright orientation generated stronger activity compared with all other orientations (t(12) > 8.88, p < 10−6), including both remaining cardinal orientations (i.e., 90 and 180°). This “inversion effect” for scenes is consistent with reports limited to tests of upright versus inverted scenes (Epstein et al., 2006). To test the possibility that the cardinal orientation bias was due only to the difference between the upright versus remaining orientations, we repeated the analysis after excluding the upright condition. The remaining results still showed a significant bias for cardinal orientations in PPA (F(3,36) = 4.11, p = 0.01): each cardinal condition evoked a stronger response than the adjacent oblique conditions (t(12) > 2.60, p < 0.05), even when the adjacent oblique orientation was nearer to upright.
In contrast to PPA, the other scene-selective areas (TOS and RSC) did not show an oblique effect, although these latter areas did show an effect of scene inversion. Application of the above analysis showed a significant effect of scene rotation in both TOS (F(4,48) = 6.34, p < 0.01) and RSC (F(4,48) = 11.53, p = 10−4). However, in both areas, this effect was not significant after excluding the upright condition (F(4,48) < 1.48, p > 0.20). To directly test whether this difference between the PPA-vs-TOS and PPA-vs-RSC was statistically significant, we used two independent applications of a two-factor repeated-measures ANOVA [area (PPA-vs-TOS or PPA-vs-RSC) and orientation (45 vs 90 vs 135 vs 180)]. In both cases, we found a significant effect of area (F(1,12) > 7.70, p < 0.02), and also a significant interaction between the two independent factors (F(3,36) > 3.18, p < 0.05). Application of the same analysis to RSC-vs-TOS activity did not yield any significant effect of (or interaction between) the independent factors (p > 0.11). Consistent with the group-averaged maps, application of the above ROI analysis in additional areas [including LOC (F(4,48) = 1.71, p = 0.16) and FFA (F(4,48) = 1.94, p = 0.19)] did not show any effect of stimulus orientation on evoked activity—not even a general inversion effect for scenes. Thus among all of these areas, PPA was the only area showing a systematic oblique effect, distinct from the inversion effect.
In the most sensitive maps, we found small patches of weak cardinal orientation bias in area V1 (Fig. 2B). However, application of the above ROI analysis did not yield any significant effect of scene rotation on V1 activity (F(4,48) = 1.36, p = 0.26). Note also that the V1 activity was confined to regularly spaced patches located at a specific peripheral retinotopic representation in V1. Comparison to the retinotopic maps in the same subjects confirmed that the location of these patches corresponded to the representation of the stimulus border in the visual field. Thus, these small patches could arise from an fMRI interaction of the stimulus and its border, rather than an authentic oblique effect (which should extend throughout the activated portion of V1). To distinguish these two possibilities, we subdivided V1 ROIs into the representation of foveal (<1°) and peripheral (3–10°) representations of the visual field (see Materials and Methods) and repeated the original test for each V1 subdivision independently. However, even this more specific test did not show significant activity modulation in either the foveal (F(4,48) = 0.52, p = 0.69) or peripheral (F(4,48) = 1.66, p = 0.19) representations of V1. Thus these small patches in V1 likely do not reflect an oblique effect.
This data result raised a question: does the cardinal orientation bias in PPA require scene stimuli—or does this bias extend to simple geometrical stimuli? To address this, we tested fMRI activity (n = 15) during presentation of arrays of overlapping squares (Fig. 3A). FFT analyses of these arrays confirmed higher spectral power at cardinal (compared with oblique) orientations (Fig. 3B). One advantage of these stimuli is that these squares have no intrinsic “upright” configuration, or other real-world associations. Thus this experiment further tested for an oblique effect, without confounds from the inversion effect or other high-level cognitive factors (e.g., stimulus familiarity). Again, no difference was found between response accuracy across conditions in the dummy task (F(1,14) = 0.23, p = 0.64).
Figure 3.

fMRI-based cardinal orientation bias in response to arrays of squares, in Experiment 2. A, Stimulus examples, shown at vertical/horizontal (left) and oblique (right) orientations. B, Result of FFT analysis averaged across all stimuli, presented at cardinal (left) and oblique (right) orientations. C, Resultant group-averaged fMRI activity maps, based on random-effects analysis. Black lines indicate the group-averaged PPA border in the same group of subjects.
As expected from such simple stimuli, the resultant PPA activity was smaller overall, compared with that produced by real world scenes (Fig. 2A,B). Nevertheless, group-averaged whole brain analysis based on random effects confirmed a cardinal orientation bias in PPA (Fig. 3C,D). Unlike the results due to scenes, these data showed no patches of border-related activity in V1. Similar results were found in ROI analysis: PPA showed stronger activity in response to cardinal rather oblique squares (t(14) = 2.31, p = 0.03), but no such bias was found in V1 (t(14) = 0.77, p = 0.46).
To more specifically probe the feature selectivity underlying this effect, Experiment 3 (n = 14) measured the response to arrays of simple line segments, either straight or curved (Fig. 4). As expected, FFTs confirmed that the straight line arrays showed highest power at two (orthogonal) orientations (Fig. 4A), whereas the curved line arrays produced a power spectrum spread across a wide range of orientations (Fig. 4B). Again, no difference was found between dummy dot contrast values across the experimental conditions, at 75% detection threshold (F(3,39) = 1.87, p = 0.17).
Consistent with our hypothesis, PPA showed a preference for the cardinal orientations (i.e., a fMRI-based oblique effect) in the straight line arrays. These results were confirmed in ROI analyses. PPA (but not V1) showed a significantly stronger response to lines at cardinal orientations rather than oblique ones (PPA: t(13) = 2.24, p = 0.04; V1: t(13) = 1.35, p = 0.20). No such bias was found for the curved lines, which have no definable orientation (Fig. 4C). Similar results were found in the ROI analyses (PPA: t(13) = 1.21, p = 0.25; V1: t(13) = 0.57, p = 0.58).
Discussion
These results reveal a fMRI analog of the perceptual oblique effect (a stronger response to vertical and horizontal compared with oblique orientations) in one main cortical visual area: PPA. Based on other evidence, PPA is considered to be selective for scenes/places (Epstein and Kanwisher, 1998; Nasr et al., 2011). Thus very broadly, this evidence suggests that the oblique effect may be related to scene processing.
This hypothetical link between the oblique effect and scene processing is supported by ecological evidence. Image statistics confirm that many scenes are dominated by cardinal (compared with oblique) orientations (Keil and Cristóbal, 2000; Torralba and Oliva, 2003). Such a bias is present not only in carpentered environments, but also in some natural scenes (Torralba and Oliva, 2003), often due to the orthogonal influences of gravity and/or phototropism. Conversely, alterative non-scene image categories (e.g., faces or body parts) did not show such a cardinal orientation bias (Torralba and Oliva, 2003). Thus, an enhanced response to cardinal orientations may contribute to the amplitude of scene-selective PPA activity, especially for scenes with prominent cardinal orientations.
Some fMRI observations also support this interpretation. PPA responds more strongly to indoor scenes compared with outdoor (less carpentered) scenes (Bar and Aminoff, 2003; Henderson et al., 2007; but see Epstein and Kanwisher, 1998; Kravitz et al., 2011). Other studies showed that upright images of a single building (Levy et al., 2004) or a cube (Rajimehr et al., 2011; both showing higher power at cardinal orientations) evoke robust activity in PPA, even in the absence of a conventionally defined scene (Henderson and Hollingworth, 1999). Experiments 2 and 3 directly demonstrated that the PPA bias for cardinal orientations extends to a wide range of non-scene stimuli, including simple geometrical stimuli similar to those typically used in psychophysical tests of the oblique effect (Orban et al., 1984; Furmanski and Engel, 2000).
However, the current findings do not indicate that PPA processes only cardinal orientations, regardless of other visual features. Especially at the gross level of fMRI, a given visual area can respond selectively and independently to multiple stimulus features. In PPA, such additional features include spatial frequency (Rajimehr et al., 2011), stimulus size (Yue and Tootell, 2011), and higher-level influences such as spatial context (Bar and Aminoff, 2003) and/or familiarity (Epstein et al., 2007).
Similarly, the current demonstration of an orientation bias in PPA does not necessarily mean that this area solely mediates orientation discrimination. For instance, orientation-biased activity within PPA likely feeds into higher level association areas for further perceptual decision making (Heekeren et al., 2004), including orientation discrimination.
The oblique effect reported here is not likely due to attentional (top-down) modulation. First, we showed that this oblique effect is mainly confined to PPA, whereas attention-driven modulation often activates extensive brain regions beyond PPA. Second, we found equivalent PPA sensitivity to stimulus orientation even though subjects performed two widely differing control tasks (i.e., 1-back and dot detection tasks). Moreover, in all experiments the subjects' behavior did not vary across experimental conditions, which suggests balanced attention levels across conditions.
Although our results did not reveal a V1 correlate for the oblique effect, this negative result may reflect technical factors, such as the averaging of activity within multiple orientation columns (Swisher et al., 2010; Freeman et al., 2011). Thus, more sensitive approaches (e.g., multiple pattern voxel analysis) plus smaller voxel size might show a stronger representation for cardinal rather than oblique orientations in V1.
At least three different scene-selective areas (PPA, TOS and RSC) have been reported in human visual cortex, and all three of these areas were strongly labeled by our standard face-vs-scene localizer (Fig. 2B). However, only PPA responded selectively to cardinal orientations. This selective activation of PPA here extends previous reports of functional differences between these three areas (Epstein et al., 2007; Park and Chun, 2009).
Footnotes
This study was supported by NIH Grants R01 MH67529 and R01 EY017081 to R.B.H.T., the Martinos Center for Biomedical Imaging, the National Center for Research Resources, the MIND Institute, and the NIMH Intramural Research Program. We thank Ali Amin-Mansour for help with data collection, and Dr. Dara Manoach for support measuring eye movements.
References
- Appelle S. Perception and discrimination as a function of stimulus orientation: the oblique effect in man and animals. Psychol Bull. 1972;78:266–278. doi: 10.1037/h0033117. [DOI] [PubMed] [Google Scholar]
- Bar M, Aminoff E. Cortical analysis of visual context. Neuron. 2003;38:347–358. doi: 10.1016/s0896-6273(03)00167-3. [DOI] [PubMed] [Google Scholar]
- Epstein R, Kanwisher N. A cortical representation of the local visual environment. Nature. 1998;392:598–601. doi: 10.1038/33402. [DOI] [PubMed] [Google Scholar]
- Epstein RA, Higgins JS, Parker W, Aguirre GK, Cooperman S. Cortical correlates of face and scene inversion: a comparison. Neuropsychologia. 2006;44:1145–1158. doi: 10.1016/j.neuropsychologia.2005.10.009. [DOI] [PubMed] [Google Scholar]
- Epstein RA, Parker WE, Feiler AM. Where am I now? Distinct roles for parahippocampal and retrosplenial cortices in place recognition. J Neurosci. 2007;27:6141–6149. doi: 10.1523/JNEUROSCI.0799-07.2007. [DOI] [PMC free article] [PubMed] [Google Scholar]
- Freeman J, Brouwer GJ, Heeger DJ, Merriam EP. Orientation decoding depends on maps, not columns. J Neurosci. 2011;31:4792–4804. doi: 10.1523/JNEUROSCI.5160-10.2011. [DOI] [PMC free article] [PubMed] [Google Scholar]
- Furmanski CS, Engel SA. An oblique effect in human primary visual cortex. Nat Neurosci. 2000;3:535–536. doi: 10.1038/75702. [DOI] [PubMed] [Google Scholar]
- Hansen BC, Essock EA. A horizontal bias in human visual processing of orientation and its correspondence to the structural components of natural scenes. J Vis. 2004;4:1044–1060. doi: 10.1167/4.12.5. [DOI] [PubMed] [Google Scholar]
- Heekeren HR, Marrett S, Bandettini PA, Ungerleider LG. A general mechanism for perceptual decision-making in the human brain. Nature. 2004;431:859–862. doi: 10.1038/nature02966. [DOI] [PubMed] [Google Scholar]
- Henderson JM, Hollingworth A. High-level scene perception. Annu Rev Psychol. 1999;50:243–271. doi: 10.1146/annurev.psych.50.1.243. [DOI] [PubMed] [Google Scholar]
- Henderson JM, Larson CL, Zhu DC. Cortical activation to indoor versus outdoor scenes: an fMRI study. Exp Brain Res. 2007;179:75–84. doi: 10.1007/s00221-006-0766-2. [DOI] [PubMed] [Google Scholar]
- Howe CQ, Purves D. Perceiving geometry: geometrical illusions explained by natural scene statistics. New York: Springer; 2005. [Google Scholar]
- Keil MS, Cristóbal G. Separating the chaff from the wheat: possible origins of the oblique effect. J Opt Soc Am. 2000;17:697–710. doi: 10.1364/josaa.17.000697. [DOI] [PubMed] [Google Scholar]
- Kravitz DJ, Peng CS, Baker CI. Real-world scene representations in high-level visual cortex: It's the space more than places. J Neurosci. 2011;31:7322–7333. doi: 10.1523/JNEUROSCI.4588-10.2011. [DOI] [PMC free article] [PubMed] [Google Scholar]
- Levy I, Hasson U, Harel M, Malach R. Functional analysis of the periphery effect in human building related areas. Hum Brain Mapp. 2004;22:15–26. doi: 10.1002/hbm.20010. [DOI] [PMC free article] [PubMed] [Google Scholar]
- Mach E. Über das Sehen von Lagen und Winkeln durch die Bewegung des Auges. Sitzungsberichte der Kaiserlichen Akademie der Wissenschaften. 1861;43:215–224. [Google Scholar]
- Nasr S, Liu N, Devaney KJ, Yue X, Rajimehr R, Ungerleider LG, Tootell RBH. Scene-selective cortical regions in human and non-human primates. J Neurosci. 2011;31:13771–13785. doi: 10.1523/JNEUROSCI.2792-11.2011. [DOI] [PMC free article] [PubMed] [Google Scholar]
- Olshausen BA, Field DJ. Vision and the coding of natural images. Am Sci. 2000;88:238–245. [Google Scholar]
- Orban GA, Vandenbussche E, Vogels R. Human orientation discrimination tested with long stimuli. Vis Res. 1984;24:121–128. doi: 10.1016/0042-6989(84)90097-x. [DOI] [PubMed] [Google Scholar]
- Park S, Chun MM. Different roles of the parahippocampal place area (PPA) and retrosplenial cortex (RSC) in panoramic scene perception. Neuroimage. 2009;47:1747–1756. doi: 10.1016/j.neuroimage.2009.04.058. [DOI] [PMC free article] [PubMed] [Google Scholar]
- Rajimehr R, Devaney KJ, Bilenko NY, Young JC, Tootell RBH. The parahippocampal place area responds preferentially to high spatial frequencies in humans and monkeys. PLoS Biol. 2011;9:e1000608. doi: 10.1371/journal.pbio.1000608. [DOI] [PMC free article] [PubMed] [Google Scholar]
- Swisher JD, Gatenby JC, Gore JC, Wolfe BA, Moon CH, Kim SG, Tong F. Multiscale pattern analysis of orientation-selective activity in the primary visual cortex. J Neurosci. 2010;30:325–330. doi: 10.1523/JNEUROSCI.4811-09.2010. [DOI] [PMC free article] [PubMed] [Google Scholar]
- Torralba A, Oliva A. Statistics of natural image categories. Network. 2003;14:391–412. [PubMed] [Google Scholar]
- Vogels R, Orban GA. The effect of practice on the oblique effect in line orientation judgments. Vision Res. 1985;25:1679–1687. doi: 10.1016/0042-6989(85)90140-3. [DOI] [PubMed] [Google Scholar]
- Yue X, Tootell RBH. Spatial processing in the parahippocampal place area. Soc Neurosci Abstr. 2011;38:125.09. [Google Scholar]