

Abstract
Tumor proteases and inhibitors have been associated with paradoxical effects on tumor progression in preclinical and clinical settings. We previously reported that urokinase (uPA) overexpression delays tumor progression in mammary cancer. This study aimed to determine the role of plasminogen activator inhibitor-1 (PAI-1) on uPA’s paradoxical in vivo effects. Using syngeneic murine models, we found that stable uPA overexpression promoted in vivo growth of colon tumors (MC-38) naturally expressing high PAI-1, while growth inhibition was observed in renal tumors (RENCA) expressing lower PAI-1 levels. In murine mammary carcinoma (4T1), uPA overexpression shifted the uPA/PAI-1 balance in favor of the protease, resulting in significantly reduced tumor growth and metastases in vivo. Conversely, increased tumor progression was observed in stable PAI-1 overexpressing 4T1 tumors, compared to uPA overexpressing and control tumors. These effects were associated with down regulation of metastases promoting genes in uPA overexpressing tumors, such as metalloproteinases, CXCL-1, c-Fos, integrin α-5, VEGF-A, PDGF-α and IL-1β. In PAI-1 overexpressing tumors, many of the above genes were upregulated. PAI-1 overexpressing tumors had increased total and new tumor microvessels, and increased tumor cell proliferation, while the opposite effects were found in uPA overexpressing tumors. Finally, PAI-1 down-regulation led to significant inhibition of 4T1 tumor growth and metastases in vivo. In conclusion, uPA’s dual effects on tumor progression occur in the context of its interactions with endogenous PAI-1 expression. Our studies uncover novel mechanisms of in vivo tumor control by modulation of the balance between tumor proteases and inhibitors, which may be exploited therapeutically.
INTRODUCTION
Tumor proteases have long been associated with tumor invasion, angiogenesis and metastases (1, 2). It is widely accepted that urokinase (uPA), a member of the plasminogen activator (PA) system, is tumor promoting and associated with an aggressive tumor phenotype (1, 3). Tumor uPA expression is associated with shorter disease free and overall survival in patients with early stage breast cancer (4-7), and has been proposed as a potential target for antitumor strategies (1, 3, 8-10). Paradoxically, overexpression of plasminogen activator inhibitor-1 (PAI-1), the endogenous inhibitor of uPA, is a clinically validated negative prognostic factor in breast and other cancers (6, 11, 12). PAI-1 has been shown to be essential for angiogenesis and tumor progression (13-15). PAI-1 promotes angiogenesis through interaction with vitronectin (16) and by direct inhibition of proteases (14).
We have previously reported that PAs induce antiangiogenic effects in vitro and in vivo (17). We also demonstrated that overexpression of uPA paradoxically delayed tumor growth, metastases, and improved survival in a syngeneic, immunocompetent mammary cancer model, (18). Urokinase’s tumor delaying effects were due to its protease activity, as tumors overexpressing proteolytically inactive uPA mutants were not associated with antitumor effects. On the other hand, several matrix metalloproteinases are associated with protective –rather than promoting-effects on in vivo tumor models (19). Proteases have been implicated in the generation of antiangiogenic peptides, such as angiostatin, endostatin and tumstatin (20-22).
The above observations suggest that urokinase can be both tumor promoting and protective and further support the notion that non-specific inhibition of proteases may not necessarily prevent tumor progression (14, 19, 23). They also underscore the need to re-evaluate current concepts on the role of uPA in cancer progression. The mechanisms of uPA mediated tumor growth delay have not yet been characterized.
In this report, we provide experimental evidence that the tumor promoting or delaying effects of urokinase depend on its dynamic balance with tumor PAI-1. We also provide insight into the in vivo molecular changes that may mediate uPA’s tumor delaying effects, and demonstrate the antitumor and antimetastatic effects of in vivo PAI-1 inhibition.
MATERIALS AND METHODS
Cell culture
Murine mammary carcinoma 4T1 cell line, colon carcinoma MC38 cell line, renal cancer RENCA cell line, and 293T were obtained from ATCC (Manassas, VA). Cells were grown in DMEM medium containing 10% FBS at 37°C and 5% CO2.
Generation of stable uPA and PAI-1 overexpressing cell lines
cDNA encoding murine uPA [obtained from (18)] and PAI-1 (gift from Foidart Jean-Michel, University of Liege) were subcloned into the BamHI-NotI site of the lentiviral vector pHR-SIN-CSGWd1NotI (a gift of Y. Ikeda, Mayo Clinic, Rochester, MN), from pcDNA3.1(+)- muPA and pBS-mPAI-1 respectively, and the cDNA sequence was verified. Lentiviral packaging was performed by cotransfection of the vector plasmid with pCMV-Gag-Pol vector and pCMV-VSVG-poly-A vector into 293T cells using CaCl2 transfection kit (Promega, Madison, WI). After 48 hours, lentivirus-containing supernatant was harvested, and stored at -80°C. MC38 and RENCA cells were transduced with uPA expressing lentiviral vector or empty vector (EV), respectively. Lentiviral constructs containing uPA, PAI-1 or an EV control were transduced into 4T1 cells. Approximately 8-10 clones of each stable cell lines expressing uPA, PAI-1 or controls were isolated, and protein expression was assessed.
Generation of stable PAI-1 knock down 4T1 cell lines
Lentiviral vectors (pGIPZ) containing shRNA against murine PAI-1 and non-silencing controls were purchased from OpenBiosystems (Huntsville, AL). Lentiviral packaging and transduction into 4T1 cells were performed following the manufacturer’s recommendations. Ninety-six hours after transduction, stable PAI-1 shRNA expressing cells were selected in 10 μg/ml puromycin (Sigma-Aldrich, St. Louis, MO). PAI-1 known down was confirmed by real time PCR and determination of protein levels by ELISA.
Western Blot
Constructs for uPA wild type and empty vector were transiently transfected into 293T cells as described above. After 48h, the maintenance culture medium was replaced with Opti-Medium. After 48 h of continued incubation, the conditioned medium was collected and subsequently concentrated using the Centricon-10 filter units (Amicon, Bedford, MA). Protein concentrations were determined by using the BCA Protein Assay Kit (Pierce, Rockford, IL). Proteins were separated by SDS–polyacrylamide gel electrophoresis on 10% gels (Bio-Rad, Hercules, CA) under nonreducing and reducing conditions, transferred to nitrocellulose membrane (Amersham Biosciences, Piscataway, NJ), and immunoblotted with a monoclonal antibody against mouse uPA (sc-59727 Santa Cruz Biotechnology, Santa Cruz, CA) at 1:1000 dilution). After the blots were washed by TBST, HRP conjugated anti-mouse second antibody at 1:2000 dilution (Cell signaling, Danvers, MA) was applied, and the peroxidase activity was revealed with the enhanced chemiluminescence system (Amersham Bioscience, Piscataway, NJ) according to the manufacturer’s instructions.
Quantification of uPA and PAI-1
Murine uPA and PAI-1 total protein and levels of active protein were determined in the conditioned medium (48 hours) of RENCA, MC38 and 4T1 clones by using a total or active murine uPA and PAI-1 ELISA kit, following the manufacturer’s recommendations (Molecular Innovations, Novi, MI). uPA proteolytic activity was assessed using a colorimetric urokinase activity kit (Chemicon, Tremecula, CA), as previously reported (18).
In vitro proliferation assay
One thousand cells per well were plated in 96-well plates in complete medium and incubated at 37 °C. Cell proliferation was determined by WST-1 proliferation reagent (Roche, Indianapolis, IN), as previously reported (18).
Soft agar assay
Soft agar assay was performed using cell transformation detection kit (Millipore, Billerica, MA) as previously described (24). Briefly, 4T1 cells (2500 cells per well) were plated in DMEM plus 10% FBS in 0.4% agar on top of a 0.8% base agar layer in 6 well plate. After 2 weeks, colony formation was quantified with a cell quantification solution (Millipore, Billerica, MA) for 3 hours at 37°C, followed by spectrophotometer reading at OD490.
Cell migration and invasion
Cell migration and invasion assays were separately performed using QCM cell migration and cell invasion (96 well) assay kits (Millipore), following the manufacturer’s recommendations. Briefly, cells were harvested, suspended in serum-free medium, and plated at 5×10⁴ cells per well onto the upper chamber in the presence of DMEM with 10% FBS in the bottom chamber. After 12 h of incubation, the upper chamber was removed and placed in the additional 96-well tray containing cell detachment buffer with calcein-AM solution. Fluorescence in the migrated cells was measured at OD490. For cell invasion assay, 5×10⁴ cells were plated in the top chamber which had previously been coated with matrigel. After 12 h of incubation, the upper chamber was removed and fluorescence in the lower chamber was measured at OD490.
Flow cytometry
Surface uPA receptor was detected by flow cytometry, using a Phycoerythrin (PE)-conjugated rat monoclonal anti-mouse uPAR (R&D systems, Minneapolis, MN), as previously described by us (25). Relative changes in cell surface uPAR expression levels were determined by quantitative assessment of fluorescence shifts (from flow cytometry data) using WinMDI 2.9 software (J. Trotter, Scripps Research Institute) and expressed as fold changes of the mean fluorescence index, as described (25).
In vivo studies
Animal studies were approved by Institutional Animal Care and Use Committee of University of Miami and the Mayo Clinic. MC38 and RENCA (5×10⁵ in 50 μl PBS) cells were inoculated into the flank of C57BL/6 (n=6-7 per group) and BALB/C (n=8-10 per group) mice, respectively. 4T1 cells (105 cells) were implanted into the fifth mammary fat pad of 8-10 weeks old female BALB/c mice (5 mice per group), as described (18). Tumor volume was measured every 3 days and calculated using the standard formula (width2 × length × 0.52). In the experiments involving 4T1 tumors, mice were followed until day 34 when they were sacrificed. Lungs were removed and fixed in Bouin’s solution, and surface lung metastases were analyzed (26). In an additional experiment, 4T1 cells (105 cells) were implanted into BALB/c mice (12 mice per group). Tumor volume was measured as above until day 21, when tumors were resected and mice continued to be followed. At day 42, they were sacrificed and lungs were resected (randomly) from five mice per group. Lungs were fixed (10% neutral-buffered formalin), embedded in paraffin, sectioned (5-μm slices, 400 μm apart), and stained with hematoxylin and eosin. Magnified (×20) lung nodules were counted.
Isolation of tumor cells from primary tumor tissues
uPA overexpressing 4T1 cells were stably transfected with a lentiviral vector expressing GFP (pHR-SIN-GFP). GFP positive 4T1 cellswere implanted BALB/c mice as above (n=3). At day 7 after inoculation, freshly isolated tumor was treated with 10 mg/ml collagenase I (Sigma, St. Louis, MO). The cell suspension was filtered through 70 μm nylon mesh and washed in HBSS. GFP positive and negative cells were separated by FACS (BD FACS Aria-I, Franklin Lakes, NJ).
RNA purification and gene expression array
Total RNA was extracted from tumor samples (triplicate) using Qiagen total RNA isolation kit. The Illumina MouseWG-6 v2.0 Expression BeadChip (Illumina, Wallingford, CT) was used for gene expression. The mi-croarray data have been deposited in NCBIs Gene Expression Omnibus (GEO, accession number GSE38346). The raw data from the fluorescence intensity measurements of each array experiment was processed using GeneSpringGX v.11.0 software (Agilent, Santa Clara, CA). Statistical analysis, fold change calculations, and hierarchical clustering of the data were also performed in GeneSpring software. Genes that expressed significantly differently with more than 1.5-fold change and a p-value of <0.05 with respect to controls were taken into consideration. Gene expression data were further validated by qRT-PCR analysis. Pathway analysis was performed by MetaCore software (GeneGo, Inc, St. Joseph, MI).
Real time PCR analysis
The assay was performed from RNA tumor samples (n=3 per group) using Taqman one-step PCR master mix reagents kit and Applied Biosystems 7300 qPCR system. Premade primers and probes were purchased from Applied Biosystems (Carlsbad, CA): GAPDH, MMP-9, MMP-10, MMP-12, MMP-13, CXCL1, JAG-1, endothelin 1 (Edn1), ADAMTS12, c-Fos, PDGFα, integrin α-5 (Itgα5), VEGF-A, interleukin 1 beta (IL-1 β). Each measurement was carried out in triplicate. Differences in gene expression, expressed as fold-change, were calculated using the 2− ΔΔCt method using GAPDH as the internal control.
Immunohistochemistry/Immunofluorescence studies
Tumor samples were frozen in OCT and sectioned (8 μm). Slides were fixed with cold acetone for 5 minutes. Total and neovessels were detected with Alexa Fluor 488 conjugated lectin (1:1000 dilution; Invitrogen, Carlsbad, CA) and Alexa Fluor 488 conjugated CD105 (Abcam, Cambridge, MA), respectively, as previously described (27, 28). Cell nuclei were stained with DAPI, (1:5000; Invitrogen). Tumor microvessels were assessed with a photomicroscope (Nikon, NE2000, Melville, NY). Pictures were taken at 400× magnification. Tumor cell proliferation was assessed by Ki-67 staining, as follows: cryostat sections were fixed in cold acetone for 10 min and endogenous peroxidase activity was quenched with 0.3% H2O2 for 10 min at room temperature. The slides were washed in phosphate-buffered saline (PBS) and incubated with rabbit anti-Ki67 antibody (Millipore) for 30 min at 37°C. After washing in PBS, the slides were developed with VECTASTAIN ABC (avidin–biotin complex) peroxidase kit (Vector Laboratories, Burlingame, CA) and a 3, 3, 9-diaminobenzidine (DAB) peroxidase substrate kit (Vector Laboratories) according to the manufacturer’s instructions.
Statistical Analysis
Data are presented as means +/− SD or SEM. In vitro experiments were performed in triplicate and repeated twice, unless otherwise specified. Differences in means from the in vitro experiments were compared by using the Student’s t test and Wilcoxon rank-sum test. Differences were considered statistically significant at P<.05. Differences of in vivo tumor growth and lung metastases among three or more groups were analyzed by one-way analysis of variance. Pairwise comparisons were performed using the Tukey–Kramer method. All statistical tests were two-sided.
RESULTS
Urokinase overexpression is associated with tumor promoting or suppressing effects in different syngeneic models: role of endogenous PAI-1 expression
We have previously reported that uPA overexpression delays in vivo tumor progression in a syngeneic mammary cancer model (18). To extend the above findings, we generated stably uPA overexpressing murine renal cancer (RENCA-uPA) and murine colon cancer (MC-38-uPA) cell lines using lentiviral vector technology, as in materials and methods. Transduction of cells with the lentiviral vector induces expression of high molecular weight uPA, with a migration pattern similar to active two-chain mouse HMW urokinase used as positive control Fig. S.1.A, B). Significant uPA overexpression was confirmed in the conditioned medium (CM) from stable RENCA (Fig. 1. A) and MC-38 (Fig. 1. B) cells, compared to controls. Levels of active uPA were increased in RENCA-uPA cells (Fig. 1. A); however, in the CM of MC-38-uPA cells, levels of active uPA were significantly lower than their RENCA counterparts (p < 0.0001; fig. 1. B). This was associated with higher uPA proteolytic activity (chromogenic assay) in the RENCA uPA CM compared to MC-38-uPA CM (Fig. S.1. C, E).
Figure 1. In vitro and in vivo characterization of stably uPA over expressing murine renal and colon cancer cell lines.
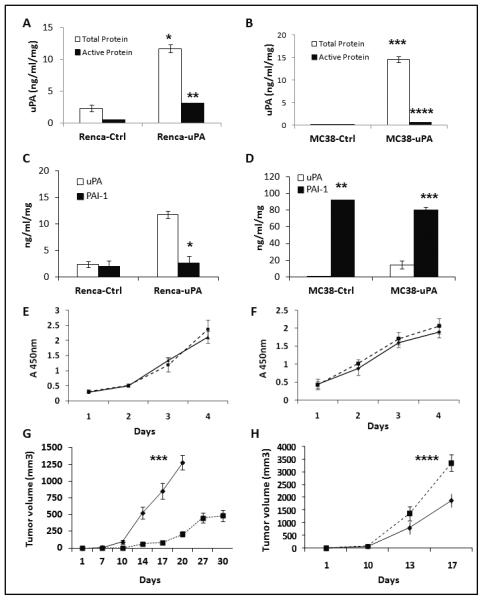
Murine (total and active) uPA concentration (ng/ml/mg: ng/ml per milligram of total protein in the conditioned medium) was determined from conditioned media obtained from stable RENCA (A) and MC-38 (B) cell lines. * p =0.0003, RENCA-uPA vs. control; *** p= 0.0001, MC-38 uPA vs. control. Active uPA in RENCA-uPA (black bars) cells was significantly higher than RENCA controls (** p < 0.0001) and MC-38-uPA cells (fig. 1.B.: **** p < 0.0001). (C). Total PAI-1 and uPA protein levels in RENCA stable clones. *p <0.0001, uPA vs. PAI-1 levels in RENCA uPA. Data are representative of two independent experiments. (D). Total PAI-1 and uPA protein levels in MC-38 stable clones. **p=0.0002, PAI-1 vs. uPA in MC-38 controls; ***p= 0,0006, PAI-1 vs. uPA in MC-38-uPA cells. Data are representative of experiments done in triplicate. (E). No significant differences on in vitro proliferation were observed between controls and uPA overexpressing RENCA (E) and MC-38 (F) cells. (EV, triangles; uPA, closed squares). Results are displayed as average +/− SD of triplicate experiments, repeated at least twice. In vivo growth patterns of RENCA (G) and MC-38 (H) tumors. RENCA-uPA tumors were associated with significant delay in tumor growth (*** p <0.0001, RENCA-uPA vs. controls at day 20; n=8-10/group), while MC-38-uPA tumors grew more than controls (**** p=0.06, MC-38 uPA vs. controls, day 17; n=6-7/group). Control tumors: diamonds. uPA overexpressing tumors: closed squares. Data are presented as average tumor volume +/− SEM.
This suggested that uPA’s activity in MC-38-uPA was inhibited by a factor in the CM. Because PAI-1 is the most relevant endogenous uPA inhibitor (1), levels of the inhibitor were measured in RENCA-uPA and MC-38-uPA’s CM. PAI-1 expression in MC 38 cells was significantly higher (~ 45-fold), compared to RENCA (Fig. 1. D, vs. 1. C; p= 0.0003).
Levels of uPA receptor were assessed in the uPA overexpressing RENCA and MC-38 cells, and were not found to be significantly changed, compared to controls (Fig. S. 1. D, F). In vitro growth rate was not different between uPA overexpressing RENCA (Fig. 1. E) and MC-38 cells (Fig. 1. F), compared to their respective controls. However, when implanted in immunocompetent mice, growth patterns in RENCA and MC-38 uPA overexpressing tumors were different. While RENCA-uPA tumors had significantly reduced tumor growth (207 mm3 vs. 1280 mm3 -in controls- at day 20 after implantation; fig. 1. G), MC-38-uPA tumors grew faster (3359 mm3 vs. 1887 mm3 at day 17) compared to controls (Fig. 1. H).
Changes in tumor uPA/PAI-1 balance regulate in vivo mammary carcinoma pro-gression
The above observations suggest that uPA overexpression may promote or suppress in vivo tumor growth, depending on its relative balance with tumor PAI-1. To test this hypothesis in a single model, we generated and characterized the following stable 4T1 clones with different levels of uPA/PAI-1 expression: 1) 4T1-control; 2) 4T1-uPA-overexpression (4T1-uPA); and 3) 4T1-PAI-1 overexpression (4T1-PAI-1). In 4T1-control (EV) cells, total and active PAI-1 levels predominated over uPA (Fig. 2. A, B). In 4T1-uPA cells, levels of urokinase predominated over PAI-1 (Fig. 2. A, B) -similar to RENCA-uPA tumors-. Conversely, in 4T1-PAI-1 cells, levels of total and active PAI-1 were significantly increased (Fig. 2. A, B), further shifting the balance towards the inhibitor, a condition similar to MC-38-uPA tumors. uPA proteolytic activity (chromogenic assay) was noticeable increased in the uPA overexpressing, but decreased in the PAI-1 overexpressing tumors, compared to controls (Fig. S. 2. A).
Figure 2. In vitro characterization of uPA and PAI-1 overexpressing 4T1 cells.

Levels of total (A) and active (B) uPA and PAI-1 were determined from 4T1 CM as in materials and methods. *p= 0.0018, uPA concentration in 4T1-uPA vs. other groups. ** p= 0.0004, PAI-1 concentration in 4T1-PAI-1 vs. other groups, ***p= < 0.0001 active uPA in 4T1-uPA vs. other groups; ****p= 0.0001 active PAI-1 in 4T1-PAI-1 vs. other groups. (C) In vitro proliferation of stable clones was similar among the three groups (p= NS). Cell migration (D) and invasion (E) assay. 4T1-uPA cells showed increased, while 4T1 PAI-1 cells were associated with decreased migration and invasion, compared to controls ( *p < 0.0001). (F) Growth in soft agar was comparable among the three groups (p= NS). Results are presented as average +/− SD of triplicate experiments.
In vitro growth was comparable in both uPA and PAI-1 overexpressing cells, compared to controls (p= NS; Fig. 2. C). PAI-1 overexpression significantly inhibited cell migration (Fig. 2. D) and invasion (Fig. 2. E), while uPA overexpression significantly increased migration and invasion in vitro, in agreement with previous reports (29, 30). Anchorage independent cell growth in both uPA and PAI-1 4T1 cells was similar to control cells (Fig. 2. F). Levels of uPA receptor were not significantly changed in the uPA over-expressing 4T1 cells, compared to controls (Fig. S. 2. B).
The above 4T1 clones were orthotopically implanted in BALB/C mice for assessment of tumor progression phenotypes. uPA overexpressing 4T1 tumors had decreased tumor growth, while 4T1-PAI-1 tumor growth was significantly higher, compared to controls (Fig. 3. A), with a significant difference in tumor weight (day 34) between the uPA and PAI-1 overexpressing tumors (Fig. 3.B; p=0.01). At this time point, mice bearing 4T1-uPA tumors had significantly decreased (p=0.016), while 4T1-PAI-1 tumors had significantly increased (p< 0.0001) lung metastases compared to controls.
Figure 3. Effects of uPA or PAI-1 overexpression on in vivo murine mammary cancer.
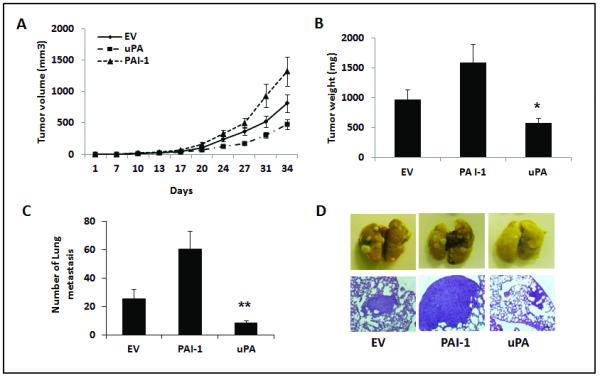
Stable 4T1 cells were orthotopically implanted in BALB/C mice (n=5/group) and tumors were followed for 34 days. (A) and (B). 4T1-uPA tumors were associated with decreased tumor growth (A) and weight (B), compared to 4T1-PAI-1 or control tumors. p= 0.01 tumor weight at day 34, 4T1-uPA vs. 4T1-PAI-1. Data are presented as average tumor volume (A), or averaged tumor weight (B) +/− SEM. (C), Significant inhibition of surface lung metastases at day 34 was observed in 4T1-uPA tumors, compared to the other groups. **p= 0.016, 4T1 uPA vs. controls; p=0.0001, 4T1 uPA vs. 4T1-PAI-1. (D). Representative pictures of lung metastases in the controls (EV), PAI-1 and uPA overexpressing groups. Scale bar= 500 μm.
To further investigate the anti-metastatic effects of uPA or PAI-1 overexpression in the absence of a primary tumor, additional tumor bearing mice had their mammary tumors removed at day 21 after implantation and were followed until day 42, when analysis of lung metastases was conducted. Again, mice in the 4T1-uPA group had significantly less metastatic nodules (Fig. S. 2.D), compared to the 4T1-PAI-1 group, even in the absence of primary tumors. Primary tumor growth (day 21) was also decreased in the 4T1-uPA group than in tumors overexpressing PAI-1 (Fig. S. 2.C).
Correlation between tumor progression phenotypes and changes in gene expression in vivo
To gain insight into the molecular mechanisms of uPA’s in vivo antitumor effects, total RNA was isolated from additional (3 per group) 4T1-uPA tumors and controls at day 7-8 after implantation, for analysis of gene expression. Significantly regulated genes were analyzed in the context of their involvement with pathways relevant for tumor progression and metastases. Urokinase overexpressing tumors had a statistically significant down regulation of genes involved in pathways related to extracellular matrix remodeling, adhesion, VEGF-A, WNT, TGF-β, hypoxia, and EMT, compared to controls (Table I).
TABLE 1.
Pathway analysis by gene microarray of uPA overexpressing tumors.
| Pathway | Gene Title | Gene Symbol |
Fold change1 |
P value |
|---|---|---|---|---|
|
| ||||
| ECM remodeling | laminin, alpha 3 | Lama3 | −3.503 | 0.00033 |
| laminin, beta 3 | Lamb3 | −3.803 | 0.00022 | |
| Laminin, gamma-2 | Lamc2 | −2.628 | 0.00024 | |
| Collagenase 3 | Mmp13 | −5.062 | 0.00003 | |
| Macrophage metalloelastase | Mmp12 | −4.129 | 0.00563 | |
| matrix metallopeptidase 10 | Mmp10 | −7.216 | 0.00061 | |
| Matrix metalloproteinase-9 | Mmp9 | −3.401 | 0.00182 | |
| Stromelysin-1 | Mmp3 | −2.331 | 0.00016 | |
| Tissue inhibitor of metalloproteinase 1 | Timp1 | −1.529 | 0.00052 | |
| Insulin-like growth factor 1 | Igf1 | 1.649 | 0.000009 | |
| CD44 antigen | CD44 | −1.744 | 0.00002 | |
| Moesin | Msn | −1.691 | 0.000004 | |
|
| ||||
| Cell adhesion_Gap junctions |
Cingulin | Cgn | −1.738 | 1.157E-0 |
| Gap junction beta-3 protein | Gjb3 | −1.609 | 0.000677 | |
| Protein kinase C beta type | Prkcb | 1.587 | 0.004651 | |
| Tight junction protein ZO-2 | Tjp2 | −1.553 | 0.000018 | |
|
| ||||
| VEGF-family signaling |
placental growth factor | Pgf | −1.886 | 0.001945 |
| integrin alpha 5 (fibronectin receptor alpha) | Itga5 | −1.796 | 0.001957 | |
| vascular endothelial growth factor A | Vegfa | −1.763 | 0.008977 | |
| inositol 1,4,5-triphosphate receptor 3 | Itpr3 | −1.662 | 1.02E-05 | |
|
| ||||
| WNT signaling pathway |
wingless-related MMTV integration site 5A | Wnt5a | −2.152 | 0.0008358 |
| wingless related MMTV integration site 10a | Wnt10a | −1.988 | 0.0000096 | |
| wingless related MMTV integration site 7a | Wnt7a | −2.144 | 0.0000057 | |
|
| ||||
| TGF-beta- mediated regulation of cell proliferation |
TGF-beta receptor type-2 | Tgfbr2 | 1.575 | 0.005002 |
| Mitogen-activated protein kinase 13 | Mapk13 | −1.588 | 0.000018 | |
| FBJ murine osteosarcoma viral oncogene homolog |
Fos | −1.703 | 0.004 | |
|
| ||||
| Regulation of epithelial-to- mesenchymal transition (EMT) |
Cadherin-1 | Cdh1 | −1.647 | 0.000003 |
| Endothelin-1 | Edn1 | −1.590 | 0.000151 | |
| Interleukin-1 beta | Il1b | −1.593 | 0.001891 | |
| Protein jagged-1 | Jag1 | −1.620 | 0.000411 | |
| Basic fibroblast growth factor receptor 1 | Fgfr1 | −1.527 | 0.000505 | |
| Neurogenic locus notch homolog protein 3 | Notch3 | −1.504 | 0.001174 | |
| Platelet-derived growth factor subunit A | Pdgfa | −1.642 | 0.001159 | |
| Platelet-derived growth factor subunit B | Pdgfb | −1.791 | 0.000258 | |
|
| ||||
| Hypoxia induced HIF-1 activation |
Heat shock 70 kDa protein 1 | Hspa1 | −1.852 | 0.000121 |
| 3-phosphoinositide-dependent protein kinase 1 | Pdpk1 | −1.538 | 0.000020 | |
| Phosphoglycerate kinase 1 | Pgk1 | −1.628 | 0.000019 | |
| Solute carrier family 2, facilitated glucose transporter member 1 |
Glut1 | −2.216 | 0.000167 | |
Compared to controls
To validate the above findings, qRT-PCR analysis of selected genes was performed. In addition, total RNA from 4T1-PAI-1 (7-8 days old) tumors was isolated, for comparative analysis. Analysis demonstrated that many tumor promoting genes (MMP-12, CXCL-1, JAG-1, endothelin-1, ADAMTS12, c-Fos, integrin alpha-5, VEGF-A and IL-1β) were down regulated in the uPA overexpressing tumors, while they were upregulated or unchanged in the PAI-1 group, (Fig. 4). MMP-9, MMP-10 and MMP-13 were down-regulated in both the uPA and PAI-1 overexpressing groups, albeit down-regulation was more pronounced in the 4T1-uPA compared to the 4T1-PAI-1 groups (Fig. 4).
Figure 4. In vivo gene expression analysis.

Differential expression of pro-metastatic genes in uPA and PAI-1 overexpressing tumors. qRT-PCR analysis of MMP-9, MMP-10, MMP-12, MMP-13, CXCL1, JAG-1, Edn1, ADAMTS12, c-Fos, PDGF-α, Itga5, VEGF-A, and IL-1 β RNA was performed in 4T1-uPA cells (grey bars), 4T1-uPA tumors (black bars) and 4T1-PAI-1 tumors (white bars) extracted 7-8 days after implantation. Bars represent fold change in expression compared to control tumors. Experiments were performed in triplicate.
Urokinase mediated gene downregulation occurs in vivo but not in vitro
Next, we compared -by qRT-PCR-expression of the above genes in tumor cells in vitro vs. tumors in vivo. Interestingly, the majority of genes that were down-regulated in the 4T1-uPA tumors in vivo (MMP-9, 10, 12, 13, ADAMTS12, CXCL-1, c-Fos, JAG-1, PDGF-α, integrin α-5, VEGF-A, IL-1β) were significantly upregulated in the 4T1-uPA cells in vitro (Fig. 4, B). Endothelin-1 was down regulated both in vitro and in vivo. To verify that gene downregulation in uPA overexpressing tumors derives from 4T1 cells, additional experiments were performed, where GFP-expressing 4T1-uPA (or control) cells were generated and implanted in mice. After tumor resection (day 7-8 after implantation), GFP (+) tumor cells were separated by flow cytometry (Fig. S.3. A), and RNA extracted for qRT-PCR analysis. Higher expression of tumor cell uPA was verified in GFP (+) 4T1-uPA cells, compared to controls. (Fig. S3. B). Importantly, levels of VEGF-A, Endothelin-1, CXCL1, and IL-1β were decreased in 4T1-uPA cells, compared to non-uPA overexpressing 4T1 controls (Fig. S3. C).
Immunohistochemistry Studies
To further characterize the biological relevance of changes in expression of angiogenesis related genes in the uPA and PAI-1 overexpressing tumors, we assessed total and new vasculature in the primary tumors at days 8-10 after implantation. A reduction in new (CD 105, Fig. 5.A, C) and total (lectin, Fig. 5. A, D) vessel staining was observed in the uPA overexpressing tumors, while it was increased in tumors overexpressing PAI-1, compared to controls. Tumor cell proliferation was assessed by Ki-67 staining, and was increased in the PAI-1 tumors compared to uPA over-expressing tumors and controls (Fig. 5.A, B).
Figure 5. Characterization of tumor proliferation and angiogenesis in uPA and PAI-1 overexpressing tumors.
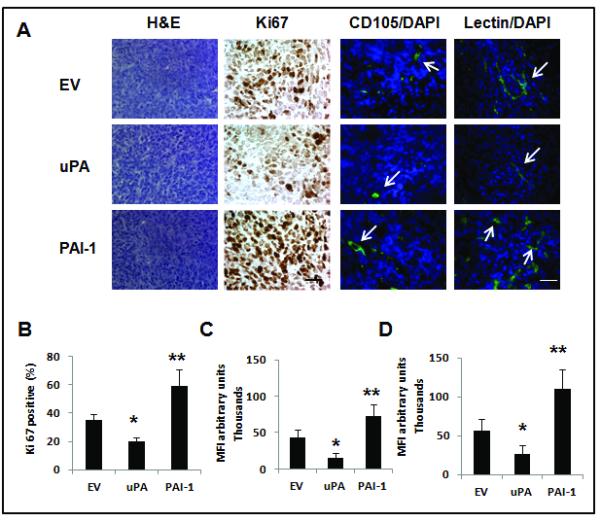
(A). Tumors were removed 1–2 weeks after inoculation for analysis of tumor cell proliferation marker (anti-Ki67), total microvessels (lectin staining) and newly formed microvessels (CD105 staining). Representative pictures Ki67 expression, as well as total (lectin) and new (CD 105) tumor microvessels in the uPA and PAI-1 groups and in the EV control (n= 3 tumors per group). Arrowheads represent stained microvessels. Pictures shown correspond to representative areas of viable tumor tissue. Scale bar = 50 μm. (B). Quantitative analysis of Ki67-positive nuclei in 4 microscopic fields per section per sample (displayed as percent of positive/total nuclei) (n=3 per group). *p= 0.002, 4T1 uPA vs. control; **p< 0.0001, 4T1 PAI-1 vs. 4T1 uPA. (C) Quantitaive analysis of CD105 staining. *p <0.0001, 4T1-uPA vs. control; **p<0.0001, 4T1-PAI-1 vs. 4T1-uPA. (D). Quantitative analysis of lectin staining. For C and D, quantitative analysis was done in a minimum of two high power fields (viable areas) per tumor section (n=3 mice per group). * p=0.004, 4T1-uPA vs. control; **p<0.0001, 4T1 PAI-1 vs. 4T1-uPA. MFI = mean fluorescence intensity.
PAI-1 down-regulation inhibits in vivo primary tumor growth and metastases
Next, we investigated the effects of PAI-1 inhibition on in vivo tumor progression. PAI-1 k/d 4T1 cell lines were generated, and down-regulation of (total and active) PAI-1 was confirmed (Fig. 6. A, B). PAI-1 inhibition led to an increase in active uPA levels (Fig. 6. A, B). While in vitro proliferation (not shown) and anchorage independent growth was unchanged (Fig. 6. D), PAI-1 down-regulation led to enhanced migration and invasion, compared to controls (Fig. 6. C). After implantation of the stable cell lines into BALB/C mice, we observed that PAI-1 k/d tumors were associated with a significant inhibition of primary tumor growth (Fig. 6. E), as well as lung metastases at day 34 (Fig. 6. F).
Figure 6. In vitro characterization of murine 4T1 mammary cancer cell clones with PAI-1 down-regulation and in vivo effects of PAI-1 knockdown on murine mammary tumor progression.

Cells were stably transduced with lentiviral vector expressing shRNA against murine PAI-1. Levels of total (A) and active (B) uPA and PAI-1 were determined in the CM (48 hours) of stable 4T1 cells by ELISA. *p= 0.005, PAI-1 concentration in 4T1-PAI-1 k/d vs. controls. **p= 0.002, active uPA in 4T1-PAI-1 k/d vs. controls. ***p= 0.008, active PAI-1 in 4T1-PAI-1 k/d vs. controls. (C) Cell migration and invasion assay were performed. PAI-1 knockdown cells showed increased migration and invasion (*p < 0.0001). (D) Growth in soft agar of 4T1 cells was comparable among the five groups (p= NS). Data are representative of triplicate experiments. PAI-1 knockdown 4T1 cells were orthotopically implanted in BALB/C mice (n=5/group) and tumor volume was measured, until day 34 when tumors and lungs were resected, and metastases quantitated. (E), 4T1 PAI-1 knock down tumors were associated with decreased primary tumor growth compared to controls (p=0.003) (F). Significant inhibition of lung metastases was observed in 4T1 PAI-1 knock down tumors, compared to control (**p=0.0002).
DISCUSSION
The understanding of the role of tumor proteases and inhibitors in cancer biology is evolving. Contrary to the established paradigm that proteases are exclusively tumor promoters, we and others have demonstrated that they can negatively regulate tumor progression (18, 19, 31, 32). In this report, we provide experimental evidence supporting the concept that uPA’s pro-or antitumorigenic effects occur in the context of its balance with PAI-1. Using different syngeneic, immunocompetent cancer models, we demonstrated that modulating the uPA/PAI-1 balance in favor of the protease, by uPA overexpression - in the setting of low endogenous PAI-1 expression- or by PAI-1 down regulation, led to decreased tumor growth and metastases. This was demonstrated in the RENCA-uPA, 4T1-uPA overexpressing, and 4T1 PAI-1 k/d tumors. On the other hand, progression was promoted in tumors where the balance favored PAI-1 (MC-38 model, 4T1-control and 4T1-PAI-1 tumors). Observations from the 4T1 mammary cancer model indicate that changes in the uPA/PAI-1 balance may influence metastases formation more significantly than primary tumor growth (Fig. 3 and S.2).
We have previously demonstrated that the protease activity of uPA is required for its in vivo tumor delaying effects, as only tumors overexpressing proteolytically active, but not proteolytically inactive (receptor binding or non-binding) urokinase mutants, were associated with in vivo tumor delaying effects. (18) The molecular studies in 4T1 uPA and PAI-1 overexpressing tumors provide additional mechanistic insight into how changes in the uPA/PAI-1 balance led to changes on in vivo growth patterns. Suppressive effects in 4T1-uPA tumors were associated with downregulation of genes involved in the metastatic and angiogenesis process (Table 1, and Fig. 4), and occurred in vivo only, but not in vitro. On the other hand, PAI-1 overexpressing tumors were associated with opposite effects on gene expression compared to tumors were uPA predominated. These observations are important, and strongly suggest that shifting the proteolytic balance in favor of uPA modulates tumor-stromal interactions, leading to inhibition of genes that mediate angiogenesis and metastases. The mechanisms by which uPA induces down-regulation of metastases related genes are currently under investigation, and may include protease dependent and independent events. Increased protease activity of uPA (and activation of downstream proteases) may disrupt the tumor stroma, leading to generation of peptides that may directly or indirectly regulate tumor and/or stromal gene expression.
Changes in the uPA/PAI-1 balance may regulate cell signaling in a protease independent manner. Webb et al. demonstrated that PAI-1 acts as a urokinase response modifier at the level of cell signaling. In this report, the authors found that PAI-1 is required for uPA to induce prolonged ERK activation and turn uPA into a mitogen in breast cancer cells (33). Modulation of tumor cell adhesion and detachment mediated by changes in the uPA/PAI-1 balance may be another mechanism explaining the observed in vivo findings. Deng et al. reported that the balance between cell adhesion and detachment is governed by PAI-1 (34). Specifically, PAI-1 was found to dissociate vitronectin from uPAR, leading to detachment of tumor cells from their vitronectin substratum. Conversely, uPA rapidly reversed PAI-1 effects on cell adhesion/detachment (34). Our in vivo findings support this potential mechanism, as switching the balance from a PAI-1 predominant to a uPA pre-dominant state may prevent tumor cell detachment and therefore, delay tumor metastases, a significant effect observed in the mammary carcinoma model.
The above findings have important clinical implications. First, they help reconcile pre-clinical and clinical reports that paradoxically showed both tumor promoting and suppressing effects of uPA and PAI-1 in breast and other cancers (3, 5, 6, 11, 12, 14-16, 18, 35). The demonstration that uPA’s balance with PAI-1, rather than the levels of each factor alone, regulate tumor progression and metastases, provide a biological rationale for this paradox. The above results will promote further investigation to re-evaluate the roles of uPA and PAI-1 in the context of their dynamic interactions, and how changes in their balance affect clinical tumor progression.
Under the therapeutic point of view, our observations bring important insight into the therapeutic potential of manipulating the uPA/PAI-1 balance. We demonstrated that the therapeutic effects of shifting the balance in favor of uPA can be achieved not only by uPA overxpression, but importantly, by down regulation of tumor PAI-1 (Fig. 6). Even though induction of uPA overexpression is a potentially testable strategy, this may not be enough to inhibit tumor growth, but may even promote it, if endogenous tumor PAI-1 levels are significantly increased, as shown in this study. These findings strongly suggest that genetic or pharmacologic PAI-1 inhibition represents a more feasible antimetastatic strategy that warrants further investigation.
In conclusion, our data demonstrate that urokinase’s in vivo tumor promoting or suppressing effects depend on its balance with tumor plasminogen activator inhibitor-1. The tumor promoting and suppressive effects mediated by changes in the uPA/PAI-1 balance are mediated by changes in gene expression that regulate metastases, angiogenesis and proliferation in vivo. Further characterization of the molecular mechanisms of uPA/PAI-1 induced modulation of tumor-stromal interactions, and evaluation of PAI-1 blockade as an antimetastatic strategy are underway.
Supplementary Material
ACKNOWLEDGEMENTS
We thank Suzanne Greiner (Mayo Clinic) for her technical assistance. This work was supported by the Braman Family Breast Cancer Institute of the University of Miami, Sylvester Comprehensive Cancer Center, Bankhead Coley Breast Cancer Pre-SPORE grant, and NCI grant 1R01CA149659-01 (to JRM).
Footnotes
Compared to controls
REFERENCES
- 1.Choong PF, Nadesapillai AP. Urokinase plasminogen activator system: a multifunctional role in tumor progression and metastasis. Clin Orthop Relat Res. 2003 Oct;415(Suppl):S46–58. doi: 10.1097/01.blo.0000093845.72468.bd. [DOI] [PubMed] [Google Scholar]
- 2.Deryugina EI, Quigley JP. Matrix metalloproteinases and tumor metastasis. Cancer Metastasis Rev. 2006 Mar;25(1):9–34. doi: 10.1007/s10555-006-7886-9. [DOI] [PubMed] [Google Scholar]
- 3.Andreasen PA, Kjoller L, Christensen L, Duffy MJ. The urokinase-type plasminogen activator system in cancer metastasis: a review. Int J Cancer. 1997 Jul 3;72(1):1–22. doi: 10.1002/(sici)1097-0215(19970703)72:1<1::aid-ijc1>3.0.co;2-z. [DOI] [PubMed] [Google Scholar]
- 4.Chappuis PO, Dieterich B, Sciretta V, Lohse C, Bonnefoi H, Remadi S, et al. Functional evaluation of plasmin formation in primary breast cancer. J Clin Oncol. 2001 May 15;19(10):2731–8. doi: 10.1200/JCO.2001.19.10.2731. [DOI] [PubMed] [Google Scholar]
- 5.Cufer T, Borstnar S, Vrhovec I. Prognostic and predictive value of the urokinase-type plasminogen activator (uPA) and its inhibitors PAI-1 and PAI-2 in operable breast cancer. Int J Biol Markers. 2003 Apr-Jun;18(2):106–15. doi: 10.1177/172460080301800203. [DOI] [PubMed] [Google Scholar]
- 6.Cufer T, Vrhovec I, Borstnar S. Prognostic significance of plasminogen activator inhibitor-1 in breast cancer, with special emphasis on locoregional recurrence-free survival. Int J Biol Markers. 2002 Jan-Mar;17(1):33–41. doi: 10.1177/172460080201700104. [DOI] [PubMed] [Google Scholar]
- 7.Look MP, van Putten WL, Duffy MJ, Harbeck N, Christensen IJ, Thomssen C, et al. Pooled analysis of prognostic impact of urokinase-type plasminogen activator and its inhibitor PAI-1 in 8377 breast cancer patients. J Natl Cancer Inst. 2002 Jan 16;94(2):116–28. doi: 10.1093/jnci/94.2.116. [DOI] [PubMed] [Google Scholar]
- 8.Henneke I, Greschus S, Savai R, Korfei M, Markart P, Mahavadi P, et al. Inhibition of urokinase activity reduces primary tumor growth and metastasis formation in a murine lung carcinoma model. Am J Respir Crit Care Med. 2010 Mar 15;181(6):611–9. doi: 10.1164/rccm.200903-0342OC. [Research Support, Non-U.S. Gov’t] [DOI] [PubMed] [Google Scholar]
- 9.Nguyen DH, Webb DJ, Catling AD, Song Q, Dhakephalkar A, Weber MJ, et al. Urokinase-type plasminogen activator stimulates the Ras/Extracellular signal-regulated kinase (ERK) signaling pathway and MCF-7 cell migration by a mechanism that requires focal adhesion kinase, Src, and Shc. Rapid dissociation of GRB2/Sps-Shc complex is associated with the transient phosphorylation of ERK in urokinase-treated cells. J Biol Chem. 2000 Jun 23;275(25):19382–8. doi: 10.1074/jbc.M909575199. [DOI] [PubMed] [Google Scholar]
- 10.Ulisse S, Baldini E, Sorrenti S, D’Armiento M. The urokinase plasminogen activator system: a target for anti-cancer therapy. Curr Cancer Drug Targets. 2009 Feb;9(1):32–71. doi: 10.2174/156800909787314002. [Research Support, Non-U.S. Gov’t Review] [DOI] [PubMed] [Google Scholar]
- 11.Nekarda H, Schmitt M, Ulm K, Wenninger A, Vogelsang H, Becker K, et al. Prognostic impact of urokinase-type plasminogen activator and its inhibitor PAI-1 in completely resected gastric cancer. Cancer Res. 1994 Jun 1;54(11):2900–7. [PubMed] [Google Scholar]
- 12.Nekarda H, Siewert JR, Schmitt M, Ulm K. Tumour-associated proteolytic factors uPA and PAI-1 and survival in totally resected gastric cancer. Lancet. 1994 Jan 8;343(8889):117. doi: 10.1016/s0140-6736(94)90845-1. [DOI] [PubMed] [Google Scholar]
- 13.Bajou K, Devy L, Masson V, Albert V, Frankenne F, Noel A, et al. Role of plasminogen activator inhibitor type 1 in tumor angiogenesis. Therapie. 2001 Sep-Oct;56(5):465–72. [PubMed] [Google Scholar]
- 14.Bajou K, Masson V, Gerard RD, Schmitt PM, Albert V, Praus M, et al. The plasminogen activator inhibitor PAI-1 controls in vivo tumor vascularization by interaction with proteases, not vitronectin. Implications for antiangiogenic strategies. J Cell Biol. 2001 Feb 19;152(4):777–84. doi: 10.1083/jcb.152.4.777. [DOI] [PMC free article] [PubMed] [Google Scholar]
- 15.Bajou K, Noel A, Gerard RD, Masson V, Brunner N, Holst-Hansen C, et al. Absence of host plasminogen activator inhibitor 1 prevents cancer invasion and vascularization. Nat Med. 1998 Aug;4(8):923–8. doi: 10.1038/nm0898-923. [DOI] [PubMed] [Google Scholar]
- 16.McMahon GA, Petitclerc E, Stefansson S, Smith E, Wong MK, Westrick RJ, et al. Plasminogen activator inhibitor-1 regulates tumor growth and angiogenesis. J Biol Chem. 2001 Sep 7;276(36):33964–8. doi: 10.1074/jbc.M105980200. [DOI] [PubMed] [Google Scholar]
- 17.Merchan JR, Chan B, Kale S, Schnipper LE, Sukhatme VP. In vitro and in vivo induction of antiangiogenic activity by plasminogen activators and captopril. J Natl Cancer Inst. 2003 Mar 5;95(5):388–99. doi: 10.1093/jnci/95.5.388. [DOI] [PubMed] [Google Scholar]
- 18.Merchan JR, Tang J, Hu G, Lin Y, Mutter W, Tong C, et al. Protease activity of urokinase and tumor progression in a syngeneic mammary cancer model. J Natl Cancer Inst. 2006 Jun 7;98(11):756–64. doi: 10.1093/jnci/djj208. [DOI] [PubMed] [Google Scholar]
- 19.Martin MD, Matrisian LM. The other side of MMPs: protective roles in tumor progression. Cancer Metastasis Rev. 2007 Dec;26(3-4):717–24. doi: 10.1007/s10555-007-9089-4. [DOI] [PubMed] [Google Scholar]
- 20.Gately S, Twardowski P, Stack MS, Cundiff DL, Grella D, Castellino FJ, et al. The mechanism of cancer-mediated conversion of plasminogen to the angiogenesis inhibitor angiostatin. Proc Natl Acad Sci U S A. 1997 Sep 30;94(20):10868–72. doi: 10.1073/pnas.94.20.10868. [DOI] [PMC free article] [PubMed] [Google Scholar]
- 21.Hamano Y, Zeisberg M, Sugimoto H, Lively JC, Maeshima Y, Yang C, et al. Physiological levels of tumstatin, a fragment of collagen IV alpha3 chain, are generated by MMP-9 proteolysis and suppress angiogenesis via alphaV beta3 integrin. Cancer Cell. 2003 Jun;3(6):589–601. doi: 10.1016/s1535-6108(03)00133-8. [DOI] [PMC free article] [PubMed] [Google Scholar]
- 22.Wen W, Moses MA, Wiederschain D, Arbiser JL, Folkman J. The generation of endostatin is mediated by elastase. Cancer Res. 1999 Dec 15;59(24):6052–6. [PubMed] [Google Scholar]
- 23.Overall CM, Kleifeld O. Tumour microenvironment - opinion: validating matrix metalloproteinases as drug targets and anti-targets for cancer therapy. Nat Rev Cancer. 2006 Mar;6(3):227–39. doi: 10.1038/nrc1821. [DOI] [PubMed] [Google Scholar]
- 24.Prickett TD, Brautigan DL. Cytokine activation of p38 mitogen-activated protein kinase and apoptosis is opposed by alpha-4 targeting of protein phosphatase 2A for site-specific dephosphorylation of MEK3. Mol Cell Biol. 2007 Jun;27(12):4217–27. doi: 10.1128/MCB.00067-07. [DOI] [PMC free article] [PubMed] [Google Scholar]
- 25.Jing Y, Tong C, Zhang J, Nakamura T, Iankov I, Russell SJ, et al. Tumor and vascular targeting of a novel oncolytic measles virus retargeted against the urokinase receptor. Cancer research. 2009 Feb 15;69(4):1459–68. doi: 10.1158/0008-5472.CAN-08-2628. [Research Support, N.I.H., Extramural Research Support, Non-U.S. Gov’t] [DOI] [PMC free article] [PubMed] [Google Scholar]
- 26.Fayard B, Bianchi F, Dey J, Moreno E, Djaffer S, Hynes NE, et al. The serine protease inhibitor protease nexin-1 controls mammary cancer metastasis through LRP-1-mediated MMP-9 expression. Cancer Res. 2009 Jul 15;69(14):5690–8. doi: 10.1158/0008-5472.CAN-08-4573. [DOI] [PubMed] [Google Scholar]
- 27.Merchan JR, Kovacs K, Railsback JW, Kurtoglu M, Jing Y, Pina Y, et al. Antiangiogenic activity of 2-deoxy-D-glucose. PLoS One. 2010;5(10):e13699. doi: 10.1371/journal.pone.0013699. [DOI] [PMC free article] [PubMed] [Google Scholar]
- 28.Jockovich ME, Bajenaru ML, Pina Y, Suarez F, Feuer W, Fini ME, et al. Retinoblastoma tumor vessel maturation impacts efficacy of vessel targeting in the LH(BETA)T(AG) mouse model. Invest Ophthalmol Vis Sci. 2007 Jun;48(6):2476–82. doi: 10.1167/iovs.06-1397. [DOI] [PubMed] [Google Scholar]
- 29.Huang HY, Jiang ZF, Li QX, Liu JY, Wang T, Zhang R, et al. Inhibition of human breast cancer cell invasion by siRNA against urokinase-type plasminogen activator. Cancer Invest. 2010 Aug;28(7):689–97. doi: 10.3109/07357901003735642. [DOI] [PubMed] [Google Scholar]
- 30.Nguyen DH, Webb DJ, Catling AD, Song Q, Dhakephalkar A, Weber MJ, et al. Urokinase-type plasminogen activator stimulates the Ras/Extracellular signal-regulated kinase (ERK) signaling pathway and MCF-7 cell migration by a mechanism that requires focal adhesion kinase, Src, and Shc. Rapid dissociation of GRB2/Sps-Shc complex is associated with the transient phosphorylation of ERK in urokinase-treated cells. The Journal of biological chemistry. 2000 Jun 23;275(25):19382–8. doi: 10.1074/jbc.M909575199. [Research Support, U.S. Gov’t, P.H.S.] [DOI] [PubMed] [Google Scholar]
- 31.Acuff HB, Sinnamon M, Fingleton B, Boone B, Levy SE, Chen X, et al. Analysis of host- and tumor-derived proteinases using a custom dual species microarray reveals a protective role for stromal matrix metalloproteinase-12 in non-small cell lung cancer. Cancer Res. 2006 Aug 15;66(16):7968–75. doi: 10.1158/0008-5472.CAN-05-4279. [DOI] [PubMed] [Google Scholar]
- 32.McCawley LJ, Crawford HC, King LE, Jr., Mudgett J, Matrisian LM. A protective role for matrix metalloproteinase-3 in squamous cell carcinoma. Cancer Res. 2004 Oct 1;64(19):6965–72. doi: 10.1158/0008-5472.CAN-04-0910. [DOI] [PubMed] [Google Scholar]
- 33.Webb DJ, Thomas KS, Gonias SL. Plasminogen activator inhibitor 1 functions as a urokinase response modifier at the level of cell signaling and thereby promotes MCF-7 cell growth. J Cell Biol. 2001 Feb 19;152(4):741–52. doi: 10.1083/jcb.152.4.741. [Research Support, Non-U.S. Gov’t Research Support, U.S. Gov’t, P.H.S.] [DOI] [PMC free article] [PubMed] [Google Scholar]
- 34.Deng G, Curriden SA, Wang S, Rosenberg S, Loskutoff DJ. Is plasminogen activator inhibitor-1 the molecular switch that governs urokinase receptor-mediated cell adhesion and release? J Cell Biol. 1996 Sep;134(6):1563–71. doi: 10.1083/jcb.134.6.1563. [Research Support, U.S. Gov’t, P.H.S.] [DOI] [PMC free article] [PubMed] [Google Scholar]
- 35.Swiercz R, Wolfe JD, Zaher A, Jankun J. Expression of the plasminogen activation system in kidney cancer correlates with its aggressive phenotype. Clin Cancer Res. 1998 Apr;4(4):869–77. [PubMed] [Google Scholar]
Associated Data
This section collects any data citations, data availability statements, or supplementary materials included in this article.