

Abstract
Bacterial small RNAs (sRNAs) are a class of structural RNAs that often regulate mRNA targets via post-transcriptional base pair interactions. We determined features that discriminate functional from non-functional interactions and assessed the influence of these features on genome-wide target predictions. For this purpose, we compiled a set of 71 experimentally verified sRNA–target pairs from Escherichia coli and Salmonella enterica. Furthermore, we collected full-length 5′ untranslated regions by using genome-wide experimentally verified transcription start sites.
Only interaction sites in sRNAs, but not in targets, show significant sequence conservation. In addition to this observation, we found that the base pairing between sRNAs and their targets is not conserved in general across more distantly related species. A closer inspection of RybB and RyhB sRNAs and their targets revealed that the base pairing complementarity is only conserved in a small subset of the targets. In contrast to conservation, accessibility of functional interaction sites is significantly higher in both sRNAs and targets in comparison to non-functional sites. Based on the above observations, we successfully used the following constraints to improve the specificity of genome-wide target predictions: the region of interaction initiation must be located in (1) highly accessible regions in both interaction partners or (2) unstructured conserved sRNA regions derived from reliability profiles of multiple sRNA alignments.
Aligned sequences of homologous sRNAs, functional and non-functional targets, and a sup document with sup tables, figures and references are available at www.bioinf.uni-freiburg.de/Supplements/srna-interact-feat/.
Keywords: IntaRNA, RNA–RNA interaction, accessibility, bacteria, conservation, sRNA, target prediction
Introduction
In recent years small regulatory RNAs (sRNAs) in bacteria have received rapidly growing attention. The largest and most extensively studied group of sRNAs bind to trans-encoded target mRNAs to post-transcriptionally regulate their translation or alter their stability. Therefore, these sRNAs can be considered as functional analogs to eukaryotic microRNAs (miRNAs).1 Unlike miRNAs, sRNAs are heterogeneous in size (typically 50–250 nt) and structure. Examples exist, however, where a conserved 5′ sRNA domain is used to regulate multiple targets in analogy to miRNA seed pairing.2
A key task in the functional characterization of base pairing sRNAs is the identification of their interaction partners. Experimental transcriptomics and proteomics approaches for target identification3 are complemented by several in silico methods for the prediction of sRNA targets and sRNA–target interactions.4 The computational approaches range from alignment-like scoring5 and machine learning6 over energy-based models incorporating interaction site accessibility7-9 to complex joint secondary structure prediction models.10-14 All methods, however, still suffer from a high false positive rate, which demands a more in-depth understanding of the mechanisms and principles underlying sRNA–target interactions to improve target identification.
The pairing between sRNAs and their targets usually involves a core interaction of six to eight contiguous base pairs, which is denoted as seed region in the following.15 The seed feature is employed by some sRNA target prediction methods.5,7 The sRNAs typically utilize well-accessible regions, i.e., hairpin loops or extended single-stranded sequence stretches, to recognize their targets.16 Therefore, some RNA–RNA interaction prediction approaches account for the structure of the interaction partners via interaction site accessibility.7-9,13 A recent study by Peer and Margalit17 showed for a set of sRNAs from Escherichia coli K-12 (E. coli) that the target-binding regions in the sRNAs exhibit characteristically high accessibility and conservation. Previously, these features were already used successfully in the cyanobacterium Prochlorococcus MED4 to reduce the number of predicted sRNA target candidates for subsequent experimental validation.18 Little investigation, however, has been made on features associated with the binding sites of mRNAs that are targeted by sRNAs.
In this study, we explored to which extent accessibility and sequence conservation are general features of interaction sites in sRNAs and their target mRNAs. To this end, we compiled a comprehensive set of 74 interactions from E. coli and Salmonella enterica serovar Typhimurium LT2 (Salmonella), and generated an appropriate data set of non-functional interactions. By comparison between functional and non-functional interactions, we found that true interaction sites are significantly more accessible and that interaction sites in sRNAs show high sequence conservation. Against our expectations, the conservation of target regulation is rather limited. Comparative sRNA target prediction approaches using target conservation information can therefore only predict a minor subclass of interactions that display broad evolutionary conservation. Due to the conservation, these target genes might be of high functional importance. An analysis of the nucleotide composition of interaction sites and flanking regions showed an enrichment of putative binding sites of Hfq, which is an RNA-binding protein that facilitates base pairing between sRNAs and their targets.19 Finally, we combined our findings with the target prediction tool IntaRNA to improve the specificity of genome-wide sRNA target searches.
Results
Data set of sRNA–mRNA interactions
This analysis uses a data set of 71 sRNA–target pairs involving 19 distinct sRNAs from the two bacterial model organisms E. coli and Salmonella (see Fig. 1A; Tables S1 and S2). These two species were selected due to the availability of a high number of validated interactions. Three of the 71 sRNA–mRNA pairs each include two separate interaction regions: GcvB sRNA uses redundant regions to pair its target cycA,21 RybB sRNA can pair two alternative sites within its target ompD,22 whereas OxyS sRNA forms two kissing hairpin interactions with fhlA mRNA.23 Thus, there are a total of 74 interactions in our data set. All interactions were experimentally verified by in vitro (structural) probing or mutational studies at the interaction sites (see Tables S1 and S2 for references). The interaction seed lengths, which are defined by the length of the longest continuously pairing region, range from 5 to 19 base pairs (bp). The interaction sites in the targets are located between positions -131 and +78, relative to the translation start. For the analysis of conservation, sequences from 21 enterobacterial species were included (see Fig. 1B and Table S4).

Figure 1. Overview of data used in this study. (A) The positive data set (orange) consists of experimentally validated sRNA–mRNA interactions from literature and the negative data set (blue) consists of predicted non-functional interactions that closely resemble the positive data. (B) Phylogenetic tree of the 21 enterobacterial species used for conservation analysis. Distances are based on 16S rRNA genes. Positive data was verified experimentally in E. coli and Salmonella, which are highlighted in bold. The tree was generated using the integrated microbial genomes system (IMG).20
The accurate calculation of structural RNA properties such as thermodynamic stability or accessibility requires the precise definition of transcripts, but transcription start sites (TSSs) are currently not part of the gene annotation in genome databases. Therefore, we compiled a set of all mRNAs with accurate 5′ untranslated regions (5′ UTRs). The 5′ UTR lengths were obtained from two genome-wide studies that experimentally determined TSSs in E. coli by high-throughput sequencing and directed mapping.24,25 In total, the 5′ UTR lengths of 2,313 different E. coli genes, which is about 56 percent of all annotated genes, were obtained. The lengths of the 5′ UTRs and the positions of the target interaction sites relative to the translation start site show a modest negative correlation (Spearman's correlation coefficient ρ = -0.54 with p-value of 1.3 × 10⁻⁶, Fig. S1). By definition, an interaction site can only be located far upstream of the start codon if the 5′ UTR is sufficiently long (compare, e.g., DsrA–rpoS and Spot42–gltA). A long 5′ UTR, however, does not necessarily imply that the interaction site is located upstream and in large distance to the translation start (compare, e.g., Spot42–nanC and RybB–ompA).
Interaction site features of the experimentally validated sRNA–mRNA interactions were evaluated by comparison to a negative data set. Since we wanted to investigate interaction site features independent of RNA–RNA hybridization patterns, we took great care to generate a negative data set in which each non-functional interaction closely resembles the intermolecular base pairing and hybridization free energy of the respective functional interaction. Ideally, the precise form of the hybridization duplex is maintained and only the associated sequences are exchanged, which was possible for about half of the interactions. In the other cases, we resorted to the next best option, namely preserving the number of interaction base pairs. Furthermore, each non-functional interaction was required to involve another sRNA site and mRNA gene than the respective validated interaction (see Figure 1A and Materials and Methods for more details). The data set of non-functional interactions is given in Table S3
Interaction sites are significantly accessible
The accessibility of an interaction site was assessed by its probability of being unpaired (denoted PU for probability unpaired), which can be calculated from the ensemble free energy needed to open the region.8 This measure has the advantage to account for all secondary structures that can be formed by a particular RNA sequence, i.e., the whole thermodynamic ensemble of structures is considered instead of a specific minimum free energy structure. Since the length of interaction sites varies for each sRNA–target pair and the expected PU values decrease with length, PU values can only be compared for regions of equal length. Therefore, we used the PU values to compute the expected fraction of unpaired bases at each interaction site (denoted EF),26 which is a length-independent measure. The accessibilities, i.e., EF values, of the interacting regions in sRNAs and mRNAs were then compared between the experimentally verified interactions and the non-functional interactions.
As shown in Figure 2A, the interaction sites of the experimentally verified interactions are more accessible than the corresponding sites in the non-functional set. This difference in accessibility is statistically significant both for sRNAs and targets (p-value of 5.7 × 10⁻¹⁴ and 2.1 × 10- 7 for sRNAs and targets, respectively, calculated by Wilcoxon rank sum test).

Figure 2. Comparison of interaction site features between functional (orange) and non-functional (blue) interactions. The plots show the (A) interaction site accessibility, (B) interaction site sequence conservation and (C) average number of different interaction base pairings, respectively. Interaction sites both in sRNAs and targets are significantly more accessible in functional than in non-functional interactions. In contrast, only sRNA interaction sites show significant evolutionary conservation. The average number of intermolecular base pair combinations is significantly smaller in the functional interactions. All p-values were calculated by Wilcoxon rank sum test.
To ensure that the observed high target site accessibility is not just an artifact from negative data construction, we compared the overall structuredness of functional and non-functional targets in terms of expected fraction of unpaired bases in the full 5′ UTR and 150 nt coding sequence (CDS). We observed that the functional targets are slightly more accessible over the whole sequence (Fig. S2A). For this set of non-functional interactions, we aimed for finding non-functional targets that share as many features as possible with the functional targets. The functional targets showed, however, a slightly larger overall accessibility than the non-functional ones. Therefore, we additionally created a second set of non-functional interactions, in which we selected each non-target to have an overall accessibility as close as possible to the corresponding true target. The overall accessibilities of these non-functional targets do not differ significantly from the functional targets (Fig. S2A, p = 0.389 by Wilcoxon rank sum test). For both negative data sets, the differences in median and mean accessibility between functional and non-functional targets are much larger for the interaction sites only than for the whole sequence (more than 5-fold and 10-fold increase for original and second negative data set, respectively, see Fig. S2). In summary, the higher accessibility of the functional target sites cannot be explained by differences in the structuredness of the compared mRNA data sets alone.
The results on interaction site accessibility in both sRNA and target motivated us to explore the accessibility information of the interacting RNAs in greater detail. Based on the observation that two short well-accessible regions often form the initial interaction,27 we examined the accessibility of all putative seed regions defined by perfectly matching sub-interactions (allowing Watson–Crick and G-U wobble base pairs) of length two to ten. We assessed whether the accessibility information of two interacting RNAs can be combined into a single feature by computing the joint probability of being unpaired (PU*) for these seed regions. When comparing true interactions and non-functional interactions, the PU*of the former is significantly higher for all analyzed seed lengths (Fig. S3, p < 4.8 × 10⁻¹⁹ by Wilcoxon rank sum test). Consequently, the accessibility of interaction seed regions, which is represented by the single feature PU*, can be used to discriminate functional from non-functional interactions.
Interaction sites are only significantly conserved in sRNAs
An analysis of evolutionary conservation was performed on alignments of homologous sRNAs and mRNAs per interaction site. The sequence conservation of each interacting region was assessed by the average information content of the alignment columns corresponding to the known interaction site in E. coli or Salmonella, respectively. The information content allows a comparison between alignments that differ in the number of included species. We used an extended expression of this measure that also incorporates scoring of gaps in the alignment.28 The sequence conservation of all functional sRNA and mRNA interaction sites was then evaluated by comparison to the sequence conservation of the sites involved in the non-functional interactions.
Figure 2B shows that true sRNA interaction sites are significantly more conserved than non-functional interaction sites (p = 1.5 × 10⁻⁶ by Wilcoxon rank sum test). Intriguingly, the target sites exhibit no significant difference in sequence conservation (p = 0.39 by Wilcoxon rank sum test).
The missing sequence conservation in the targets, in contrast to the sRNAs, indicates that conservation of sRNA-mRNA interactions among related bacterial species might not be a general feature. It may, however, be that, despite lack of target sequence conservation, intermolecular base pairings are still preserved by consistent mutations in the target. In consistent mutations, only one of the two pairing bases changes, e.g., A-U mutates to G-U.29 To examine to which extent consistent or compensatory mutations occurred, we counted the number of base pair types (out of the possible combinations C-G, G-C, A-U, U-A, G-U and U-G) per interaction position in the alignments. The functional set utilized the interactions experimentally validated in E. coli or Salmonella and the non-functional set utilized the hybridizations predicted for the E. coli or Salmonella sequences. An example is given in Figure S4. The results in Figure 2C show that the number of different base pair types is smaller in the confirmed interactions than in the non-functional interactions (p = 9.0 × 10⁻⁵ by Wilcoxon rank sum test). Hence, we can conclude that interactions between sRNAs and their targets are not structurally conserved in general.
Sequence composition of interaction sites and flanking regions
To analyze whether functional interaction sites are characterized by specific sequence compositions, mononucleotide frequencies were determined at interaction sites and their flanking regions of at most 20 nt both for sRNAs and their target mRNAs. Bacterial sRNAs commonly possess a short poly(U) tail at their 3′ end, which forms, together with the preceding stem-loop structure, the Rho-independent transcription terminator. In the following analysis these poly(U) tails were disregarded to avoid a bias in the sequence composition.
Figure 3 shows a comparison of mononucleotide frequencies of interaction sites and flanks between experimentally verified functional data and non-functional data. We found that the true interaction sites in sRNAs contain significantly more U nucleotides than the corresponding regions in the non-functional data, while the target sites contain significantly more A and less G (p-values of 0.0002, 3.4 × 10⁻⁶ and 0.001, respectively, by Wilcoxon rank sum test). The mutual enrichment of Us and As in sRNAs and targets, respectively, ensures base pair complementarity between the two interacting RNAs. As both A and G are complementary to U, but alleviated G frequency was observed at target sites, A–U interaction base pairs might be favored over less stable non-Watson–Crick G–U base pairs in sRNA–mRNA duplexes. Moreover, not only the true sRNA interaction site, but also their 3′ flanking regions have a significantly higher frequency of U than the non-functional data (p-value of 0.0003 by Wilcoxon rank sum test). Likewise, the regions flanking the target sites in both directions also show significantly higher A frequencies (p-values of 3.6 × 10⁻⁵ and 0.001 for 5′ and 3′ flanks, respectively, by Wilcoxon rank sum test). Low G content was found for the 3′ flanks of the target sites (p-value of 3.7 × 10⁻⁵ by Wilcoxon rank sum test). Noteworthy, the nucleotide pattern observed here is consistent with the binding preference of the RNA chaperone Hfq toward A/U-rich regions.19
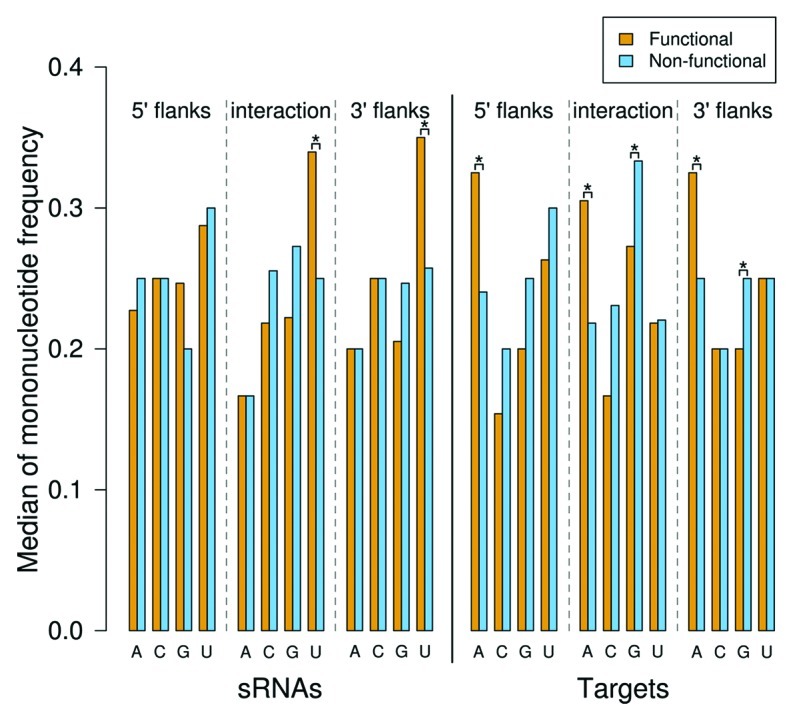
Figure 3. Comparison of the mononucleotide frequencies at interaction sites and 20 nt flanking regions between functional (orange) and non-functional (blue) interactions. The short poly(U) tails at the sRNA 3′ ends were excluded from the analysis. p-values were calculated by Wilcoxon rank sum test; bars are marked by '*' if the differences in the mononucleotide frequencies are significant at the 0.01 level.
Conservation of sRNA–target base pairing complementarity is limited
Many sRNAs of our data set directly regulate multiple targets by binding via a single interaction site (although some sRNAs also use more than one site to interact with their targets, e.g., FnrS, GcvB and Spot42). To gain further insight into the relationship between interaction site conservation in sRNAs and their targets, we selected two sRNAs with multiple targets, RyhB and RybB, and investigated the conservation of their target regulation in detail. For each target mRNA of these sRNAs, we analyzed to which degree the base pairing between the two RNAs is conserved in related species by manual inspection of the multiple sRNA and mRNA sequence alignments. We distinguished between preserved complementarity of the full interaction and of a core interaction of at least six consecutive base pairs. Both consistent and compensatory mutations in the intermolecular pairing were considered.
The sequence of the first analyzed sRNA, RyhB, was found to be conserved in 19 out of the 21 enterobacterial species considered here. Five RyhB targets have been experimentally verified in E. coli to date, of which shiA is translationally activated and the other four are subject to translational repression.30-34 The target-binding site of RyhB is located between sequence positions 34 to 76. All interaction seeds are located in the highly conserved RyhB region between positions 34 to 55. Among the RyhB targets, the interaction with cysE is conserved in 17 out of 19 species when requiring a core interaction of at least six consecutive bp (see Table 1). The full interaction is preserved in six species. For the target sodB, the interaction site is fully conserved in 12 out of the 16 species, in which an ortholog of sodB was identified. A conserved core interaction was additionally found in one species. The remaining three species with sodB ortholog carry a single mismatch within the 9 bp interaction. In both cysE and sodB, the RyhB target site is located around the start codon. The lowest interaction conservation was found for the targets fur and shiA, each with a preserved complementarity in only six species.
Table 1. Conservation of interactions between RyhB sRNA and its target mRNAs in 19 enterobacterial species.
| Interaction conservation | |||||
|---|---|---|---|---|---|
| Organism |
cysE |
fur |
iscS |
shiA |
sodB |
|
Escherichia coli K-12 |
X |
X |
X |
X |
X |
|
Shigella dysenteriae |
X |
X |
X |
X |
X |
|
Escherichia fergusonii |
X |
X |
X |
x |
X |
|
Shigella sonnei |
X |
X |
X |
- |
X |
|
Shigella flexneri |
X |
x |
X |
- |
X |
|
Shigella boydii |
X# |
X |
X |
- |
X |
|
Salmonella Typhi |
- |
- |
x |
n/a |
X |
|
Salmonella Typhimurium |
- |
- |
X |
- |
X |
|
Citrobacter koseri |
x |
- |
x |
x# |
X |
|
Citrobacter rodentium |
x |
- |
x |
x# |
X |
|
Klebsiella pneumoniae |
x |
- |
X |
- |
X |
|
Enterobacter sp 638 |
x |
- |
x |
x |
X |
|
Pectobacterium carotovorum |
x |
- |
X# |
- |
n/a |
|
Yersinia pestis |
x# |
- |
- |
n/a |
- |
|
Yersinia pseudotuberculosis |
x# |
- |
- |
n/a |
- |
|
Yersinia enterocolitica |
x |
- |
- |
n/a |
- |
|
Sodalis glossinidius |
x# |
- |
- |
n/a |
n/a |
|
Proteus mirabilis |
x* |
- |
x# |
n/a |
x |
|
Photorhabdus luminescens |
x |
- |
- |
n/a |
n/a |
| Conserved interactions | 0.89 | 0.32 | 0.74 | 0.32 | 0.68 |
Orthologs of target genes were identified with OrthoMCL and by gene annotations. The last row gives the fraction of species in which interaction conservation was found. 'X' indicates full interaction conservation, 'x' indicates conservation of a core interaction (i.e., at least 6 consecutive bps), and '-' indicates no interaction conservation. 'n/a' indicates that no target ortholog was found. '#' and '*' mark interactions that contain consistent and compensatory mutations, respectively. Organisms are sorted by evolutionary distance to E. coli based on 16S rRNA genes
The sequence of the second analyzed sRNA, RybB, is conserved in all 21 species. Its 5′ end sequence is fully conserved up to position 19. In Salmonella, it was shown that this 5′ RybB domain base pairs ten mRNAs, which results in translational repression and mRNA destabilization.2,22,35 The base pairing between RybB and its target ompA is fully conserved in all analyzed species except Shigella dysenteriae, where the target site includes a single mismatch (see Table 2). Among the other nine RybB targets, the lowest degree of interaction conservation was found for ompD and ompS with conserved base pairing in only four and five species, respectively.
Table 2. Conservation of interactions between RybB sRNA and its target mRNAs in 21 enterobacterial species.
| Interaction conservation | ||||||||||
|---|---|---|---|---|---|---|---|---|---|---|
| Organism |
chiP |
fadL |
ompA |
ompC |
ompD |
ompF |
ompN |
ompS |
ompW |
tsx |
|
Salmonella Typhimurium |
X |
X |
X |
X |
X |
X |
X |
X |
X |
X |
|
Salmonella Typhi |
X |
X |
X |
X |
n/a |
X |
X |
X |
X |
X |
|
Citrobacter koseri |
X |
X |
X |
x |
x |
X |
X |
X |
X |
x# |
|
Citrobacter rodentium |
X# |
X |
X |
x |
x |
X |
X |
X |
X |
x |
|
Shigella dysenteriae |
- |
X |
x |
x |
n/a |
- |
n/a |
n/a |
X |
X |
|
Escherichia fergusonii |
X |
X |
X |
X |
- |
X |
X |
n/a |
X |
X |
|
Shigella sonnei |
X |
X |
X |
x |
- |
X |
x |
n/a |
X |
X |
|
Shigella flexneri |
X |
X |
X |
x |
- |
X |
X |
n/a |
X |
X |
|
Escherichia coli K-12 |
X |
X |
X |
x |
n/a |
X |
x |
n/a |
X |
X |
|
Shigella boydii |
n/a |
X# |
X |
x |
n/a |
X |
x |
n/a |
X |
X |
|
Klebsiella pneumoniae |
X |
- |
X |
X |
n/a |
- |
X |
X |
- |
x# |
|
Cronobacter sakazakii |
- |
X |
X |
X# |
n/a |
X |
X |
n/a |
- |
x# |
|
Enterobacter sp 638 |
X# |
X |
X |
X |
x |
X |
X# |
n/a |
X |
X |
|
Pectobacterium carotovorum |
n/a |
X# |
X# |
n/a |
n/a |
X |
n/a |
n/a |
- |
- |
|
Serratia proteamaculans |
- |
X |
X# |
X# |
n/a |
n/a |
- |
n/a |
- |
- |
|
Yersinia pestis |
- |
- |
X# |
X# |
n/a |
X |
n/a |
n/a |
- |
n/a |
|
Yersinia pseudotuberculosis |
- |
- |
X# |
X# |
n/a |
- |
- |
n/a |
- |
n/a |
|
Yersinia enterocolitica |
- |
X |
X# |
X# |
n/a |
X |
n/a |
n/a |
- |
n/a |
|
Sodalis glossinidius |
n/a |
n/a |
X# |
x# |
n/a |
x# |
n/a |
n/a |
n/a |
n/a |
|
Proteus mirabilis |
- |
- |
X# |
n/a |
n/a |
X |
n/a |
n/a |
- |
n/a |
|
Photorhabdus luminescens |
n/a |
X |
X |
n/a |
n/a |
n/a |
- |
n/a |
- |
n/a |
| Conserved interactions | 0.48 | 0.76 | 1.00 | 0.86 | 0.19 | 0.76 | 0.57 | 0.24 | 0.52 | 0.62 |
Orthologs of target genes were identified with OrthoMCL and by gene annotations. The ortholog clusters of the ompF and ompN genes were hand-curated due to an incorrect assignment of evolutionary relationship (as already observed for bacterial porin genes in previous studies36,37). The ompD gene contains two RybB interaction sites, but only the site at positions 18 to 26 is conserved, and thus only this site is included above. Organisms are sorted by evolutionary distance to Salmonella based on 16S rRNA genes. See Table 1 for details on the symbols
Interaction seed constraints improve genome-wide target predictions
In previous results, we showed that high interaction site accessibility and strong sRNA interaction site sequence conservation are common features of bacterial sRNA–mRNA interactions. These observations suggest the following strategy to improve the false positive rate of genome-wide sRNA target predictions: (1) identify complementary regions in sRNA and putative target that are highly accessible, or (2) identify conserved and weakly structured, i.e., accessible, regions in the sRNA that might serve as target-binding region. Subsequently, focus the target search to interactions that include these regions, which can be achieved by, e.g., constraining the position of the interaction seed region.
Interaction seeds were restricted to highly accessible regions in both RNAs by only allowing seeds with a high joint probability of being unpaired (PU*). The background accessibility signal of a particular RNA sequence depends on sequence composition, e.g., GC-content, and folding parameters such as temperature and folding windows. Therefore, to define valid (i.e., accessible) seeds, the PU* cut-off is computed individually for each pair of RNA sequences as the q-quantile of the sequences' background PU* for a user-defined q. The target prediction tool IntaRNA already predicts RNA–RNA interactions starting from an interaction seed. We extended IntaRNA by optionally allowing only interaction seeds with a PU* greater than the q-quantile of the background PU* (which is computed from all subsequences of length equal to the seed). Previously, IntaRNA's interaction scoring already included an overall accessibility term, but did not allow to specifically restrict interaction seeds to highly accessible regions.
Candidate sRNA seeds in weakly structured and conserved regions were obtained from reliability profiles computed with the sequence-structure alignment tool LocARNA-P.38 Positions in the input sequences are matched structurally by LocARNA-P if they are part of conserved base pairs, otherwise positions are matched non-structurally. The former case contributes to the structural reliability. In the latter case, the sequence positions are matched based on their sequence similarity, which contributes to the sequence reliability. Figure 4 gives an example reliability plot for RyhB sRNA; a reliability plot shows the reliabilities for sequence and base pair matches in each alignment column. A stretch of alignment columns with high sequence, but low structure reliability, indicates a region with trustworthy alignment without conserved base pairs, i.e., with conserved unstructuredness. Afterwards, we scored the sequence identity of such regions to identify regions that are conserved on sequence level, but without conserved secondary structure. We then extended IntaRNA to allow for constraining the position of interaction seeds to these regions.

Figure 4. Alignment and reliability profile plot of RyhB sRNA homologs and the conserved and accessible RyhB region derived from them. In the reliability plot on top, the dark and light blue regions represent alignment column-wise structure and sequence reliabilities, respectively, and the blue line shows the combined column reliabilities. Below the alignment, the consensus sequence and the sequence conservation are shown. The RyhB target binding region is boxed with a black dashed line. The region identified as conserved and accessible by comparison to background signals is indicated by the orange line; this region was used as seed constraint in the genome-wide prediction of RyhB targets with IntaRNA. Sequences in the alignment are labeled by the RefSeq genome accession number of each organism. The plots are projected to the E. coli sequence, i.e., columns with gaps in the E. coli sequence are excluded.
To evaluate the above seed constraints, we conducted genome-wide target predictions in E. coli and Salmonella for every sRNA in our data set. Four different IntaRNA settings were used: (1) seed without accessibility and conservation constraints (default), (2) seed constraints derived from sRNA LocARNA-P reliability profile (e.g., orange line, Fig. 4), (3) seed with PU* in 0.8-quantile of background distribution, i.e., highly accessible in both RNAs, and (4) a combination of the seed constraints in (2) and (3). Additionally, we present the prediction results of the widely used sRNA target prediction tool TargetRNA for comparison in Figure 5. Here, the ROC-like plot shows the total number of true positive predictions vs. the number of predicted targets per sRNA for all four IntaRNA settings and for TargetRNA. The best prediction performance was achieved when interaction seeds were restricted to conserved and weakly structured sRNA regions [orange line, setting (2)]. Restricting the seeds to highly accessible regions in both target mRNA and sRNA [dark blue line, setting (3)] resulted in an almost similar performance. A combination of the two constraints did not further improve the results [light blue line, setting (4)]. For all parameter settings including the default method without constraining the seed region [black line, setting (1)], IntaRNA clearly outperformed TargetRNA (gray line). The plot was restricted to the 100 best predictions per sRNA as this is the maximal number of targets reported by TargetRNA.

Figure 5. Genome-wide target predictions for 25 sRNAs to evaluate different constraints on the interaction seeds. The prediction performance of the tool IntaRNA using four different parameter settings is compared with the tool TargetRNA. The ROC-like plot shows the overall number of correctly predicted targets (y-axis) vs. the number of predictions per sRNA (x-axis) sorted by (energy) score. All IntaRNA predictions with constraints on the seed region (orange, light and dark blue lines) achieved a higher sensitivity (true positive rate) than IntaRNA without seed constraints (black line). Independent of the parameter setting used, IntaRNA always clearly outperformed TargetRNA (gray line).
Discussion
Characterizing features of functional interaction sites
In this study, we compiled a set of 71 sRNA–target pairs including 74 experimentally verified interaction sites. By comparing these interactions to a set of non-functional interactions, we found that both sRNA and target interaction sites are highly accessible, and that the interaction sites in the sRNAs are additionally well conserved. The overall interaction site accessibility in the targets was lower than in the sRNAs and the difference to the non-functional interactions was also less pronounced (although still highly significant). There are two possible explanations for this observation: (1) Structural RNAs (e.g., sRNAs), but not mRNAs, generally have lower folding energies than random RNAs of the same dinucleotide frequency.39-41 Consequently, the difference in accessibility between structured and unstructured regions might be higher for structural RNAs than for mRNAs. (2) Although local folding of mRNAs is more accurate than global folding, a sliding window approach introduces a prediction bias by generating artificial sequence boundaries.42 In contrast, the sRNAs are short and have well-defined sequence boundaries, making them suitable for global structure prediction. Therefore, the accessibilities for sRNAs might be more reliable than the accessibilities for mRNAs.
One sRNA often targets multiple mRNAs via the same interaction site (e.g., CyaR, FnrS, GcvB, OmrA/B, RybB and RyhB). As a consequence, the target-binding region in the sRNA is likely to show high sequence conservation since base pairing with multiple targets is expected to constrain the evolution of the sRNA.15 If there was only one target, sRNA and mRNA sequence would presumably have coevolved instead. Conversely, if only a single mRNA target is known for a sRNA with well-conserved interaction site, it seems very likely that there exist several other yet unknown targets. The idea that sRNAs typically target multiple mRNAs is additionally supported by the finding that the number of Hfq-bound mRNAs in Salmonella is considerably larger than the number of sRNAs associated with Hfq.43
When comparing the nucleotide composition in the verified functional interactions to the non-functional interactions, we observed that true sRNA interaction sites and 3′ flanks of 20 nt length are enriched for uridines. In accordance with sequence complementarity, we found an enrichment of adenosines in target interaction sites and 20 nt flanks on either side. Guanosine frequencies were reduced at target interaction sites and 3′ flanks. The pairing of sRNAs with their target mRNAs is commonly facilitated by the RNA-binding protein Hfq, which has been recently reviewed.19 Hfq has two binding surfaces, which preferentially bind single-stranded U-rich sequences and ARN(N) motifs, respectively. These sequence motifs match our observations, which suggests that the majority of the sRNA–target pairs analyzed here can be bound simultaneously by Hfq. In addition, it was previously reported that sRNA target sites have a propensity for a flanking 3′ adenosine,2 which accounts for about two third of the difference in 3′ flank adenosine frequency between functional and non-functional sites.
Genome-wide target predictions and seed constraints
When performing genome-wide prediction of sRNA targets with the two widely used tools IntaRNA and TargetRNA, the former ranked the true targets on average better than the latter. However, it is expected that many of the predicted “false positives” are actually true targets because our data set is not an exhaustive set of interaction pairs. For example, Sharma et al. recently identified 13 additional targets of the GcvB sRNA by gfp reporter gene fusions, but without a mapping of the exact interaction sites;21 thus they were not considered in our analysis. Consequently, both IntaRNA and TargetRNA are likely to perform better in predicting novel targets than in our experiments.
Our observation that sRNA interaction sites show characteristically high accessibility and sequence conservation is in line with a recent study by Peer and Margalit.17 In their study, the authors also suggested for target predictions to narrow down the search space to interactions in conserved and accessible sRNA regions. Here, we required that the interaction seed only is located at an unstructured conserved sRNA region, which successfully increased the sensitivity of genome-wide target predictions with IntaRNA. We found that a similar improvement in sensitivity can be achieved by restricting the target search to interactions that contain a seed region that is highly accessible in both interaction partners. This finding supports the idea that target recognition is mediated by initial annealing of two well-accessible RNA regions, which form a strong duplex due to high sequence complementarity. The overall quality of predictions does not further increase, but also does not decrease, when combining both restrictions. Restricting the interactions seeds to highly accessible regions, but not additionally to unstructured and conserved sRNA regions, has the advantage to require neither the availability of homologous sRNA sequences nor the identification of sRNA candidate seed sites, e.g., by a probabilistic classifier or LocARNA-P reliability plots. Thus, our approach solely based on seed accessibility does not employ machine learning and does not depend on additional parameters apart from a cut-off relative to the background signal. The structure prediction that is required to compute the accessibility of the interacting RNAs is already part of interaction prediction methods as IntaRNA and, thus, does not create any computational overhead.
Conservation of target sites and sRNA–target binding
The comparison between verified interactions and non-functional interactions provided no evidence that interaction sites in target mRNAs are generally conserved (in contrast to interaction sites in sRNAs). Consistently, a survey of the two sRNAs RybB and RyhB and their respective targets revealed that, although the sRNA interaction site is highly conserved, the actual seed base pair complementarity is maintained on average in only 60% of the species. For miRNAs, the functional analogs of sRNAs in eukaryotes, it was also found that a substantial fraction of experimentally verified target sites is non-conserved,44 albeit target site conservation being frequently used to increase the specificity of miRNA target prediction.45,46 Furthermore, our results did not show an enrichment for compensatory or consistent mutations in the interactions.
Taken together, these observations suggest that the base pairing between sRNAs and their targets is not generally conserved across related species. Our results further suggest that comparative methods using covariance scoring will improve target prediction only for a subclass of interactions. The overall paucity of sequence covariation between sRNA and target (which is consistent with our recent findings47) can be explained by high evolutionary conservation of the sRNA interaction site and missing consistent mutations in the target.
The question remains why sRNA interaction sites exhibit a very high sequence conservation when neither interaction sites in the targets are sequentially conserved nor interactions are structurally conserved. A possible explanation is that, for particular sRNAs, regulation of the target could be conserved, but not the interaction site location. Instead, the interaction site has been shifted to another location in the target. As a result, this target site mobility could lead to an interaction site that is conserved in sequence, but found in a different sequence context. Another explanation for missing target site conservation is that, for sRNAs with multiple targets, conservation of regulation does not have to be present for all genes that are found as target in a particular organism. Often, sRNAs regulate multiple targets by binding via the same interaction site. But conservation of this sRNA site does not necessarily imply full conservation of all target genes or of the base pairing even if the genes are conserved.48-50 Instead, regulation of individual targets might have been acquired or lost very recently in evolution. However, for a particular sRNA, one or some particular targets out of multiple targets might be critical for the evolution of this sRNA and, thus, be linked to the evolutionary conservation of the sRNA interaction site.15 For example, the gene ompA is very broadly conserved and its base pairing potential with the 5′ end of RybB sRNA is preserved in all 21 analyzed species; thus, one could speculate that only ompA might have originally constrained the evolution of the RybB interaction site in these species. However, the RybB 5′ end is recently involved in the regulation of several other broadly conserved targets (see Table 2). These other targets beside ompA now pose additional evolutionary constraints to the RybB interaction site, such that the 5′ sequence will be preserved even if ompA is lost as a target.
Materials and Methods
Creating multiple sequence alignments of homologous sRNA and mRNA sequences
To search for homologous sRNA and mRNA sequences, the complete genomes of 21 enterobacterial species were retrieved from NCBI RefSeq database51 (see Fig. 1B; Table S4). Homologs of each E. coli and Salmonella sRNA were identified in these 21 genomes using the semi-global alignment tool GotohScan (E-value cut-off of 0.01).52 Sequence-based alignment methods as GotohScan are appropriate for structural RNAs when the pairwise sequence identity is at least 50–60 percent.53 Therefore, to reduce the number of false positives, sequences identified as homologs were rejected when the sequence identity to the query sequence was less than 60 percent. Each set of homologous sRNA sequences was then structurally aligned with LocARNA-P applying probabilistic consistency transformation.38,54
Groups of homologous (specifically orthologous) mRNA genes were identified with OrthoMCL55 using all annotated mRNAs except pseudo genes as input. 5′ UTR lengths in mRNAs were taken from two studies that experimentally mapped TSSs in E. coli on a genome-scale level.24,25 Since both data sets missed the TSS of two E. coli genes of our interaction data set (dpiB and nanC) and of six further genes, of which the Salmonella ortholog is included in our interaction data set (ompD, ompF, ompN, ompS, STM3216 and STM4351), we determined the 5′ UTR lengths of these genes from the literature that reports the corresponding interaction. 5′ UTR lengths of other Salmonella genes were derived from the length of the corresponding E. coli orthologs. In case of ambiguities, the 5′ UTR length was set to the maximal value found. For each annotated mRNA, the 5′ UTR sequence and 150 nt CDS were extracted from the genomic sequence. If the TSS position was unknown or if the gene was encoded within an operon, 200 nt upstream of the start codon were used instead of the 5′ UTR. A sequence length of 200 nt covers the majority of E. coli 5′ UTRs, which mostly vary from 20 to 40 nt in length.25 The sequences of orthologous genes were then aligned with MAFFT (method E-INS-i for generalized affine gap costs).56
Alignments of homologous sRNA sequences were generated incorporating structural information, which is advisable for structural RNAs to obtain “high quality” alignments. In contrast, homologous mRNA sequences can contain large unalignable regions, especially in the 5′ UTRs, and mRNAs are not expected to fold into a common global structure. Therefore, we resorted to a pure sequence-based alignment method. The use of two different tools could lead to a bias in results on conservation when comparing sRNAs with mRNAs. We only compared, however, functional and non-functional sites in either sRNAs or mRNAs.
Construction of a negative data set
The negative data set with a non-functional interaction for each verified E. coli and Salmonella sRNA-mRNA interaction was created as follows. First, putative hybridizations were predicted between the sRNA and the full 5′ UTR and 150 nt CDS of all genes, for which orthologous genes were identified. The hybridizations were predicted with IntaRNA neglecting accessibility, which typically results in extended stretches of complementary sequences.7 Then, we extracted all sub-hybridizations of these predicted hybridizations, for which the hybridization pattern was equal to the verified interaction. When such a sub-hybridization did not exist, we searched for a sub-hybridization where the number of base pairs (and optionally the interaction length) was equal to the verified interaction. Additionally, the sub-hybridizations had to satisfy the following properties: the mRNA is not the true target, the sRNA interaction site does not overlap the true sRNA interaction site, and the mRNA interaction site is located in the CDS if the same applies to the verified target since protein-coding and non-coding regions are subject to different evolutionary constraints. Finally, the sub-hybridization with the closest hybridization free energy to the validated interaction was selected as the corresponding non-functional interaction. By selecting only one non-functional interaction for every validated interaction, we gained a balanced set of functional and non-functional instances. Alignments of non-functional targets with their homologous genes predicted by OrthoMCL were generated as described above. An overview on the construction of the negative data set is also presented in Figure 1A. In addition, a second negative data set was created using the aforementioned approach except that, in the final step, non-targets were not selected based on the free energy of the sub-hybridization. Instead, the overall accessibility (in terms of EF) of each non-functional target had to be as close as possible to the overall accessibility of the corresponding true target.
The sRNA GcvB is known to directly regulate 21 mRNAs, which is the largest number of validated targets for a single sRNA.21 In total, GcvB alters mRNA expression levels of ~1% of all protein-coding genes in Salmonella. Assuming that each sRNA has a similar number of targets, it is very unlikely that an mRNA randomly selected as a non-target is actually a true target of the sRNA.
Negative data could have also been obtained from the database sRNATarBase, which contains experimentally proven non-functional interactions.57 However, it was not used in this study as it does not contain enough entries to obtain a non-functional interaction for each verified interaction. Furthermore by constraining predicted hybridizations to be as close to the verified interactions as possible, we could concentrate on interaction site features independent of the actual hybridization pattern.
Measuring interaction site accessibility
The probability that nucleotides si…sj in an RNA sequence s are unpaired is defined by
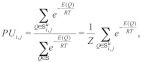 |
Where Q is a particular secondary structure that can be formed by s, S is the set of all structures,  is the set of all structures in which si…sj is unpaired, E(Q) is the free energy of structure Q, Z is the partition function, R is the gas constant and T is the temperature.8
PU values of sRNA sequences were computed by global folding with RNAup.8 As mRNA sequences, in contrast to sRNA sequences, should be folded locally,42
PU values of mRNA sequences were computed with RNAplfold58 using a sliding window approach with a 140 nt folding window and a maximal base pair span of 70.
is the set of all structures in which si…sj is unpaired, E(Q) is the free energy of structure Q, Z is the partition function, R is the gas constant and T is the temperature.8
PU values of sRNA sequences were computed by global folding with RNAup.8 As mRNA sequences, in contrast to sRNA sequences, should be folded locally,42
PU values of mRNA sequences were computed with RNAplfold58 using a sliding window approach with a 140 nt folding window and a maximal base pair span of 70.
The expected fraction of unpaired bases of a subsequence sa…sb of an RNA sequence s is then defined by
Now let s1 and s2 be two RNA sequences where the subsequences  and
and  form an interaction enclosed by base pairs (i,k) and (j,l). We then define the joint probability
  that the interacting subsequences
  and
and  are unpaired by
where PUi,j and PUk,l are the probabilities that the respective subsequences are unpaired. This definition is based on the assumption that both sequences fold independently, i.e., PUi,j and PUk,l are stochastically independent.
Measuring interaction site sequence conservation
The information content Ii of an alignment column Ai is defined by
where A = {A,C,G,U,-} is the set of nucleotides including gaps, qik is the observed frequency of the symbol k ∈ A in alignment column Ai, and pk is the background symbol distribution.28 We set p_ = 1 and assume uniform background nucleotide distribution, i.e., pk= 0.25.
We then define the sequence conservation Ca,b of consecutive alignment columns from Aato Ab by
When calculating the sequence conservation of a particular sRNA and mRNA, we included only sequences of species where homologs of both the sRNA and its target were found.
Determining conserved and accessible sRNA regions
Probabilistic alignment with LocARNA-P gives reliabilities for sequence and base pair matches in each alignment column. These reliability profiles were used together with the corresponding alignment to determine well-conserved regions without conserved secondary structure: given a multiple sRNA alignment A, we first determined the background signals of sequence identity, structure and sequence reliability, which are denoted  ,
,  and
and  , respectively. The background signal is defined as the average sequence identity or reliability over all alignment columns. Then, we identified windows of a fixed length n with an average sequence identity
  , an average structure reliability
  and an average sequence reliability
  . In this study, we used γ = 1.0, δ = 0.9, ε = 1.0 and window length equal to the seed length. The windows satisfying the three conditions were considered as accessible conserved regions.
Genome-wide prediction of sRNA targets
For the final evaluation of the interaction site features analyzed in this study, genome-wide sRNA target predictions were performed with two widely used tools. Predictions with IntaRNA7 used the following settings: minimal seed length of seven consecutive base pairs and local mRNA structure folding with a maximal base pair span of 70 in a folding window of 140 nt. Optionally, the interaction seed was constrained to specific sRNA regions or highly accessible regions in both interacting RNAs. A version of IntaRNA supporting these seed constraints is available for download at www.bioinf.uni-freiburg.de/Software/. Putative interactions were searched in the full 5′ UTR and 150 nt CDS of all genes, for which orthologous genes were identified. Since the target sites of all experimentally confirmed interactions are located between positions -131 to +78 relative to the start codon, we filtered all predictions to be in the range -150 to +100. The list of putative targets was then sorted by the IntaRNA energy score, which is the sum of hybridization energy and opening energy of both interaction sites. Genome-wide target predictions with TargetRNA5 were performed with its default settings, but the search was restricted to the region -150 to +100 relative to the start codon. Furthermore, the p-value threshold was increased to obtain the best 100 target predictions per sRNA, which is the maximal number of targets that the web server returns for each target search. The list of putative targets was sorted by their p-value.
Supplementary Material
Acknowledgments
We thank Sita Lange for inspiring discussions, especially on generation of negative data, and critical reading of the manuscript. We also thank Sebastian Will for discussions on LocARNA-P. We are further thankful to the members of the DFG Priority Program SPP 1258 Sensory and Regulatory RNAs in Prokaryotes for comments on interaction conservation and nucleotide composition during the 2011 project meeting. This work was supported by the German Research Foundation (DFG grants BA 2168/2–2 SPP 1258 and BA 2168/3–1 to R.B.).
Disclosure of Potential Conflicts of Interest
No potential conflicts of interest were disclosed.
Note
Supplemental materials can be found at: http://www.landesbioscience.com/journals/rnabiology/article/20294
Footnotes
Previously published online: www.landesbioscience.com/journals/rnabiology/article/20294
References
- 1.Waters LS, Storz G. Regulatory RNAs in bacteria. Cell. 2009;136:615–28. doi: 10.1016/j.cell.2009.01.043. [DOI] [PMC free article] [PubMed] [Google Scholar]
- 2.Papenfort K, Bouvier M, Mika F, Sharma CM, Vogel J. Evidence for an autonomous 5′ target recognition domain in an Hfq-associated small RNA. Proc Natl Acad Sci U S A. 2010;107:20435–40. doi: 10.1073/pnas.1009784107. [DOI] [PMC free article] [PubMed] [Google Scholar]
- 3.Sharma CM, Vogel J. Experimental approaches for the discovery and characterization of regulatory small RNA. Curr Opin Microbiol. 2009;12:536–46. doi: 10.1016/j.mib.2009.07.006. [DOI] [PubMed] [Google Scholar]
- 4.Backofen R, Hess WR. Computational prediction of sRNAs and their targets in bacteria. RNA Biol. 2010;7:33–42. doi: 10.4161/rna.7.1.10655. [DOI] [PubMed] [Google Scholar]
- 5.Tjaden B, Goodwin SS, Opdyke JA, Guillier M, Fu DX, Gottesman S, et al. Target prediction for small, noncoding RNAs in bacteria. Nucleic Acids Res. 2006;34:2791–802. doi: 10.1093/nar/gkl356. [DOI] [PMC free article] [PubMed] [Google Scholar]
- 6.Cao Y, Zhao Y, Cha L, Ying X, Wang L, Shao N, et al. sRNATarget: a web server for prediction of bacterial sRNA targets. Bioinformation. 2009;3:364–6. doi: 10.6026/97320630003364. [DOI] [PMC free article] [PubMed] [Google Scholar]
- 7.Busch A, Richter AS, Backofen R. IntaRNA: efficient prediction of bacterial sRNA targets incorporating target site accessibility and seed regions. Bioinformatics. 2008;24:2849–56. doi: 10.1093/bioinformatics/btn544. [DOI] [PMC free article] [PubMed] [Google Scholar]
- 8.Mückstein U, Tafer H, Hackermüller J, Bernhart SH, Stadler PF, Hofacker IL. Thermodynamics of RNA-RNA binding. Bioinformatics. 2006;22:1177–82. doi: 10.1093/bioinformatics/btl024. [DOI] [PubMed] [Google Scholar]
- 9.Tafer H, Amman F, Eggenhofer F, Stadler PF, Hofacker IL. Fast accessibility-based prediction of RNA-RNA interactions. Bioinformatics. 2011;27:1934–40. doi: 10.1093/bioinformatics/btr281. [DOI] [PubMed] [Google Scholar]
- 10.Chitsaz H, Salari R, Sahinalp SC, Backofen R. A partition function algorithm for interacting nucleic acid strands. Bioinformatics. 2009;25:i365–73. doi: 10.1093/bioinformatics/btp212. [DOI] [PMC free article] [PubMed] [Google Scholar]
- 11.Huang FWD, Qin J, Reidys CM, Stadler PF. Partition function and base pairing probabilities for RNA-RNA interaction prediction. Bioinformatics. 2009;25:2646–54. doi: 10.1093/bioinformatics/btp481. [DOI] [PubMed] [Google Scholar]
- 12.Salari R, Möhl M, Will S, Sahinalp SC, Backofen R. Time and space efficient RNA–RNA interaction prediction via sparse folding. In: Berger B, ed. Proc. of RECOMB 2010, volume 6044 of Lecture Notes in Computer Science. Springer Berlin / Heidelberg, 2010:473–490. [Google Scholar]
- 13.Salari R, Backofen R, Sahinalp SC. Fast prediction of RNA-RNA interaction. Algorithms Mol Biol. 2010;5:5. doi: 10.1186/1748-7188-5-5. [DOI] [PMC free article] [PubMed] [Google Scholar]
- 14.Seemann SE, Richter AS, Gorodkin J, Backofen R. Hierarchical folding of multiple sequence alignments for the prediction of structures and RNA-RNA interactions. Algorithms Mol Biol. 2010;5:22. doi: 10.1186/1748-7188-5-22. [DOI] [PMC free article] [PubMed] [Google Scholar]
- 15.Gottesman S, Storz G. Bacterial small RNA regulators: versatile roles and rapidly evolving variations. Cold Spring Harb Perspect Biol. 2011;3:pii:a003798. doi: 10.1101/cshperspect.a003798. [DOI] [PMC free article] [PubMed] [Google Scholar]
- 16.Storz G, Vogel J, Wassarman KM. Regulation by small RNAs in bacteria: expanding frontiers. Mol Cell. 2011;43:880–91. doi: 10.1016/j.molcel.2011.08.022. [DOI] [PMC free article] [PubMed] [Google Scholar]
- 17.Peer A, Margalit H. Accessibility and evolutionary conservation mark bacterial small-rna target-binding regions. J Bacteriol. 2011;193:1690–701. doi: 10.1128/JB.01419-10. [DOI] [PMC free article] [PubMed] [Google Scholar]
- 18.Richter AS, Schleberger C, Backofen R, Steglich C. Seed-based INTARNA prediction combined with GFP-reporter system identifies mRNA targets of the small RNA Yfr1. Bioinformatics. 2010;26:1–5. doi: 10.1093/bioinformatics/btp609. [DOI] [PMC free article] [PubMed] [Google Scholar]
- 19.Vogel J, Luisi BF. Hfq and its constellation of RNA. Nat Rev Microbiol. 2011;9:578–89. doi: 10.1038/nrmicro2615. [DOI] [PMC free article] [PubMed] [Google Scholar]
- 20.Markowitz VM, Chen IMA, Palaniappan K, Chu K, Szeto E, Grechkin Y, et al. The integrated microbial genomes system: an expanding comparative analysis resource. Nucleic Acids Res. 2010;38(Database issue):D382–90. doi: 10.1093/nar/gkp887. [DOI] [PMC free article] [PubMed] [Google Scholar]
- 21.Sharma CM, Papenfort K, Pernitzsch SR, Mollenkopf HJ, Hinton JCD, Vogel J. Pervasive post-transcriptional control of genes involved in amino acid metabolism by the Hfq-dependent GcvB small RNA. Mol Microbiol. 2011;81:1144–65. doi: 10.1111/j.1365-2958.2011.07751.x. [DOI] [PubMed] [Google Scholar]
- 22.Balbontín R, Fiorini F, Figueroa-Bossi N, Casadesús J, Bossi L. Recognition of heptameric seed sequence underlies multi-target regulation by RybB small RNA in Salmonella enterica. Mol Microbiol. 2010;78:380–94. doi: 10.1111/j.1365-2958.2010.07342.x. [DOI] [PubMed] [Google Scholar]
- 23.Argaman L, Altuvia S. fhlA repression by OxyS RNA: kissing complex formation at two sites results in a stable antisense-target RNA complex. J Mol Biol. 2000;300:1101–12. doi: 10.1006/jmbi.2000.3942. [DOI] [PubMed] [Google Scholar]
- 24.Cho BK, Zengler K, Qiu Y, Park YS, Knight EM, Barrett CL, et al. The transcription unit architecture of the Escherichia coli genome. Nat Biotechnol. 2009;27:1043–9. doi: 10.1038/nbt.1582. [DOI] [PMC free article] [PubMed] [Google Scholar]
- 25.Mendoza-Vargas A, Olvera L, Olvera M, Grande R, Vega-Alvarado L, Taboada B, et al. Genome-wide identification of transcription start sites, promoters and transcription factor binding sites in E. coli. PLoS One. 2009;4:e7526. doi: 10.1371/journal.pone.0007526. [DOI] [PMC free article] [PubMed] [Google Scholar]
- 26.Hiller M, Pudimat R, Busch A, Backofen R. Using RNA secondary structures to guide sequence motif finding towards single-stranded regions. Nucleic Acids Res. 2006;34:e117. doi: 10.1093/nar/gkl544. [DOI] [PMC free article] [PubMed] [Google Scholar]
- 27.Brunel C, Marquet R, Romby P, Ehresmann C. RNA loop-loop interactions as dynamic functional motifs. Biochimie. 2002;84:925–44. doi: 10.1016/S0300-9084(02)01401-3. [DOI] [PubMed] [Google Scholar]
- 28.Gorodkin J, Heyer LJ, Brunak S, Stormo GD. Displaying the information contents of structural RNA alignments: the structure logos. Comput Appl Biosci. 1997;13:583–6. doi: 10.1093/bioinformatics/13.6.583. [DOI] [PubMed] [Google Scholar]
- 29.Hofacker IL, Fekete M, Stadler PF. Secondary structure prediction for aligned RNA sequences. J Mol Biol. 2002;319:1059–66. doi: 10.1016/S0022-2836(02)00308-X. [DOI] [PubMed] [Google Scholar]
- 30.Desnoyers G, Morissette A, Prévost K, Massé E. Small RNA-induced differential degradation of the polycistronic mRNA iscRSUA. EMBO J. 2009;28:1551–61. doi: 10.1038/emboj.2009.116. [DOI] [PMC free article] [PubMed] [Google Scholar]
- 31.Geissmann TA, Touati D. Hfq, a new chaperoning role: binding to messenger RNA determines access for small RNA regulator. EMBO J. 2004;23:396–405. doi: 10.1038/sj.emboj.7600058. [DOI] [PMC free article] [PubMed] [Google Scholar]
- 32.Prévost K, Salvail H, Desnoyers G, Jacques JF, Phaneuf É, Massé E. The small RNA RyhB activates the translation of shiA mRNA encoding a permease of shikimate, a compound involved in siderophore synthesis. Mol Microbiol. 2007;64:1260–73. doi: 10.1111/j.1365-2958.2007.05733.x. [DOI] [PubMed] [Google Scholar]
- 33.Salvail H, Lanthier-Bourbonnais P, Sobota JM, Caza M, Benjamin JAM, Mendieta MES, et al. A small RNA promotes siderophore production through transcriptional and metabolic remodeling. Proc Natl Acad Sci U S A. 2010;107:15223–8. doi: 10.1073/pnas.1007805107. [DOI] [PMC free article] [PubMed] [Google Scholar]
- 34.Večerek B, Moll I, Bläsi U. Control of Fur synthesis by the non-coding RNA RyhB and iron-responsive decoding. EMBO J. 2007;26:965–75. doi: 10.1038/sj.emboj.7601553. [DOI] [PMC free article] [PubMed] [Google Scholar]
- 35.Bouvier M, Sharma CM, Mika F, Nierhaus KH, Vogel J. Small RNA binding to 5′ mRNA coding region inhibits translational initiation. Mol Cell. 2008;32:827–37. doi: 10.1016/j.molcel.2008.10.027. [DOI] [PubMed] [Google Scholar]
- 36.Delihas N. Annotation and evolutionary relationships of a small regulatory RNA gene micF and its target ompF in Yersinia species. BMC Microbiol. 2003;3:13. doi: 10.1186/1471-2180-3-13. [DOI] [PMC free article] [PubMed] [Google Scholar]
- 37.Nguyen TX, Alegre ER, Kelley ST. Phylogenetic analysis of general bacterial porins: a phylogenomic case study. J Mol Microbiol Biotechnol. 2006;11:291–301. doi: 10.1159/000095631. [DOI] [PubMed] [Google Scholar]
- 38.Will S, Joshi T, Hofacker IL, Stadler PF, Backofen R. LocARNA-P: Accurate boundary prediction and improved detection of structural RNAs. RNA. 2012;18:900–14. doi: 10.1261/rna.029041.111. [DOI] [PMC free article] [PubMed] [Google Scholar]
- 39.Clote P, Ferré F, Kranakis E, Krizanc D. Structural RNA has lower folding energy than random RNA of the same dinucleotide frequency. RNA. 2005;11:578–91. doi: 10.1261/rna.7220505. [DOI] [PMC free article] [PubMed] [Google Scholar]
- 40.Freyhult E, Gardner PP, Moulton V. A comparison of RNA folding measures. BMC Bioinformatics. 2005;6:241. doi: 10.1186/1471-2105-6-241. [DOI] [PMC free article] [PubMed] [Google Scholar]
- 41.Workman C, Krogh A. No evidence that mRNAs have lower folding free energies than random sequences with the same dinucleotide distribution. Nucleic Acids Res. 1999;27:4816–22. doi: 10.1093/nar/27.24.4816. [DOI] [PMC free article] [PubMed] [Google Scholar]
- 42.Lange SJ, Maticzka D, Möhl M, Gagnon JN, Brown CM, Backofen R. Global or local? Predicting secondary structure and accessibility in mRNAs. Nucleic Acids Res. 2012 doi: 10.1093/nar/gks181. [Epub] [DOI] [PMC free article] [PubMed] [Google Scholar]
- 43.Sittka A, Lucchini S, Papenfort K, Sharma CM, Rolle K, Binnewies TT, et al. Deep sequencing analysis of small noncoding RNA and mRNA targets of the global post-transcriptional regulator, Hfq. PLoS Genet. 2008;4:e1000163. doi: 10.1371/journal.pgen.1000163. [DOI] [PMC free article] [PubMed] [Google Scholar]
- 44.Ellwanger DC, Büttner FA, Mewes HW, Stümpflen V. The sufficient minimal set of miRNA seed types. Bioinformatics. 2011;27:1346–50. doi: 10.1093/bioinformatics/btr149. [DOI] [PMC free article] [PubMed] [Google Scholar]
- 45.Lall S, Grün D, Krek A, Chen K, Wang YL, Dewey CN, et al. A genome-wide map of conserved microRNA targets in C. elegans. Curr Biol. 2006;16:460–71. doi: 10.1016/j.cub.2006.01.050. [DOI] [PubMed] [Google Scholar]
- 46.Friedman RC, Farh KKH, Burge CB, Bartel DP. Most mammalian mRNAs are conserved targets of microRNAs. Genome Res. 2009;19:92–105. doi: 10.1101/gr.082701.108. [DOI] [PMC free article] [PubMed] [Google Scholar]
- 47.Seemann SE, Richter AS, Gesell T, Backofen R, Gorodkin J. PETcofold: predicting conserved interactions and structures of two multiple alignments of RNA sequences. Bioinformatics. 2011;27:211–9. doi: 10.1093/bioinformatics/btq634. [DOI] [PMC free article] [PubMed] [Google Scholar]
- 48.Guillier M, Gottesman S. The 5′ end of two redundant sRNAs is involved in the regulation of multiple targets, including their own regulator. Nucleic Acids Res. 2008;36:6781–94. doi: 10.1093/nar/gkn742. [DOI] [PMC free article] [PubMed] [Google Scholar]
- 49.Papenfort K, Said N, Welsink T, Lucchini S, Hinton JCD, Vogel J. Specific and pleiotropic patterns of mRNA regulation by ArcZ, a conserved, Hfq-dependent small RNA. Mol Microbiol. 2009;74:139–58. doi: 10.1111/j.1365-2958.2009.06857.x. [DOI] [PubMed] [Google Scholar]
- 50.Rice JB, Vanderpool CK. The small RNA SgrS controls sugar-phosphate accumulation by regulating multiple PTS genes. Nucleic Acids Res. 2011;39:3806–19. doi: 10.1093/nar/gkq1219. [DOI] [PMC free article] [PubMed] [Google Scholar]
- 51.Pruitt KD, Tatusova T, Klimke W, Maglott DR. NCBI Reference Sequences: current status, policy and new initiatives. Nucleic Acids Res. 2009;37(Database issue):D32–6. doi: 10.1093/nar/gkn721. [DOI] [PMC free article] [PubMed] [Google Scholar]
- 52.Hertel J, de Jong D, Marz M, Rose D, Tafer H, Tanzer A, et al. Non-coding RNA annotation of the genome of Trichoplax adhaerens. Nucleic Acids Res. 2009;37:1602–15. doi: 10.1093/nar/gkn1084. [DOI] [PMC free article] [PubMed] [Google Scholar]
- 53.Gardner PP, Wilm A, Washietl S. A benchmark of multiple sequence alignment programs upon structural RNAs. Nucleic Acids Res. 2005;33:2433–9. doi: 10.1093/nar/gki541. [DOI] [PMC free article] [PubMed] [Google Scholar]
- 54.Will S, Reiche K, Hofacker IL, Stadler PF, Backofen R. Inferring noncoding RNA families and classes by means of genome-scale structure-based clustering. PLoS Comput Biol. 2007;3:e65. doi: 10.1371/journal.pcbi.0030065. [DOI] [PMC free article] [PubMed] [Google Scholar]
- 55.Li L, Stoeckert CJJ, Jr., Roos DS. OrthoMCL: identification of ortholog groups for eukaryotic genomes. Genome Res. 2003;13:2178–89. doi: 10.1101/gr.1224503. [DOI] [PMC free article] [PubMed] [Google Scholar]
- 56.Katoh K, Toh H. Recent developments in the MAFFT multiple sequence alignment program. Brief Bioinform. 2008;9:286–98. doi: 10.1093/bib/bbn013. [DOI] [PubMed] [Google Scholar]
- 57.Cao Y, Wu J, Liu Q, Zhao Y, Ying X, Cha L, et al. sRNATarBase: a comprehensive database of bacterial sRNA targets verified by experiments. RNA. 2010;16:2051–7. doi: 10.1261/rna.2193110. [DOI] [PMC free article] [PubMed] [Google Scholar]
- 58.Bernhart SH, Mückstein U, Hofacker IL. RNA Accessibility in cubic time. Algorithms Mol Biol. 2011;6:3. doi: 10.1186/1748-7188-6-3. [DOI] [PMC free article] [PubMed] [Google Scholar]
Associated Data
This section collects any data citations, data availability statements, or supplementary materials included in this article.