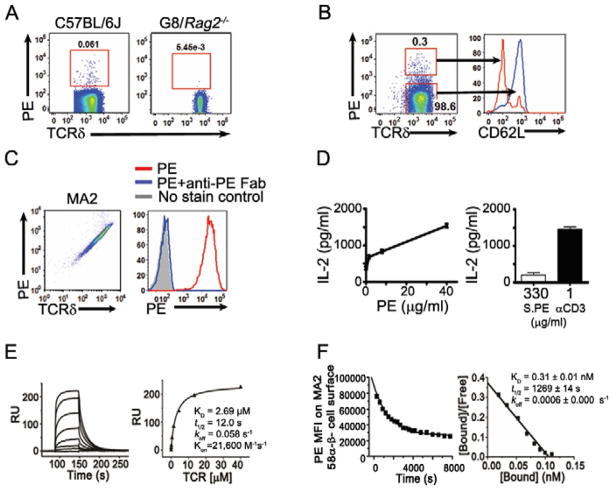
Fig. 1. PE recognition by murine γδ T cells.
FACS analysis of (A) PE staining of murine splenic γδ T cells and (B) PE binding and CD62L expression of splenic γδ T cells stimulated with immobilized PE for six hours; (C) PE staining of MA2 γδ TCR expressing 58α−β− cells (left) and in the presence of anti-PE Fab fragment (right); (D) IL-2 production of MA2-58α−β− cells activated with plate bound PE, anti-CD3 (1μg/ml) or PE in solution for 16 hours; (E) Surface plasmon resonance analysis of a soluble PE-specific γδ TCR (MA2) binding to immobilized PE (left) and the plot of steady state binding value (RU) vs. TCR concentration (right); (F) Kinetics of PE binding to MA2-58α−β− cells. The half-life (t1/2) was determined using real time flow cytometry in the presence of Fab of anti-PE antibody (left); KD was determined from Scatchard analysis, where the absolute number of PE bound per cell was determined using PE-quantum calibration beads (BD Biosciences) as reference (right).

