

Abstract
Background
RECIST (Response Evaluation Criteria in Solid Tumors) is the accepted method for determining tumor progression. However, RECIST may not accurately estimate disease burden because the axial plane often does not produce the actual longest diameter. Volumetric measurements may be an alternative to better determine tumor size. Our aim was to compare volumetric measurements with RECIST in pancreatic ductal adenocarcinomas (PDA) and hepatocellular carcinomas (HCC).
Methods
RECIST and volumetric measurements were determined in 9 patients with metastatic PDA and 17 patients with HCC who subsequently underwent liver transplantation. Gross pathological measurements after hepatectomy were also analyzed for volumes.
Results
3-D diameter in volumetric analysis was 38% and 36% higher than RECIST diameter in PDA and HCC, respectively (p < 0.01). However, RECIST yielded 78% and 23% larger estimated tumor volumes than volumetric analysis in PDA and HCC respectively (p < 0.01). Gross pathological volume in HCC demonstrated a linear correlation with both volumetric analysis (r = 0.95, p < 0.01) and RECIST (r = 0.96, p < 0.01) but RECIST significantly overestimated gross pathological volume by an average of 28% (p < 0.01) while volumetric analysis was similar to gross pathological volume (p = 0.56). In categorizing treatment response in PDA, RECIST and volumetric analysis were in “moderate agreement” (κ = 0.49).
Conclusions
RECIST may significantly overestimate tumor burden compared to volumetric measurements in both PDA and HCC. Volumetric analysis may be the preferred method to detect tumor progression.
Keywords: RECIST, Volumetry, Pancreatic cancer, Hepatocellular carcinoma
INTRODUCTION
The most widely accepted protocol for measuring disease response and guiding therapy decisions in clinical trials is RECIST (Response Evaluation Criteria in Solid Tumors).1 RECIST consists of choosing up to 5 target lesions, measuring the largest diameter for each lesion in the axial plane, and calculating the sum of those diameters. The change in sum of diameters is monitored over time to determine treatment response. Traditionally a greater than 20% increase is considered progression and greater than a 30% decrease is considered a response, with lesser changes classified as stable disease. However, these uni-dimensional measurements may not be acceptable surrogates for classifying change in size of three-dimensional tumors.2 With current imaging technology, longitudinal or oblique measurements can readily be determined, and tumor volumes can be algorithmically computed. Sohaib and colleagues found CT volumetric measurements to be reproducible and accurately predict water displacement volumes of regularly-shaped lymphomas larger than 35 cm3.3 A second study using ellipsoids of known sizes found volumetric measurements to be significantly more accurate than RECIST.4 Taken together, these studies suggest that volumetric measurements may be more accurate in regularly-shaped tumors. Pancreatic ductal adenocarcinomas (PDA) are irregular and typically have length-width ratios of 3-4:1, with the axial plane often not producing the actual longest diameter.5 We hypothesized that volumetry may be optimal compared with RECIST for determining changes in these tumors due to its ability to take into account three dimensions as opposed to a single axial dimension. We aimed to compare RECIST and volumetric measurements in a set of irregularly shaped PDAs, as well as in a set of more regularly shaped hepatocellular carcinomas (HCC), to determine if volumetric measurements may be advantageous compared to RECIST in these tumor types.
METHODS
Patient Selection
The study consisted of a subset of patients with PDA and a subset of patients with HCC. Biopsy-proven, metastatic PDA patients were selected from all patients currently participating in a Phase I clinical trial. Inclusion and exclusion criteria for the phase I study are described at www.clinicaltrials.gov, study identifier NCT01049880. For the present study, all patients were selected who completed a minimum of 2 cycles of therapy and a minimum of one follow-up CT as per the phase I trial protocol. All patients underwent a baseline CT scan and subsequent CT scans every 8 weeks during PDA treatment. A total of 30 CT scans from 9 patients with PDA for a total of 25 unique lesions (including primary and metastatic lesions) were analyzed. HCC patients were selected from a database of patients with histologically confirmed HCC who were treated with trans-arterial chemoembolization procedure (TACE) and subsequent liver transplantation between 2005 and 2010. Patients were excluded from the present study if the most recent MRI prior to transplantation was unavailable, if we could not determine which tumor on MRI corresponded with which tumor on pathologic examination, or if measurements were missing from the pathology report. A total of 17 MRIs from 17 patients who underwent liver transplantation for a total of 24 unique HCC tumors were examined. This study was approved by the University of Iowa Institutional Review Board for Human Subjects on June 14, 2011.
CT Scan analysis
All PDA patients underwent CT scan of the chest, abdomen, and pelvis with intravenous contrast with a Siemens Definition AS scanner with maximum slice thickness 5 mm. CT scans were performed at baseline (≤ 30 days before start of treatment) and every 8 weeks thereafter. Target lesions were chosen at baseline according to modified RECIST criteria1. The same set of lesions was examined for volumetric analysis. All images were analyzed at a syngo® TrueD workstation (Siemens Medical Solutions USA, Inc.). Diameters were measured with a ruler tool, and volumes were measured with a freeform contouring tool (Figure 1). Measurements were made by the same physician throughout the study (JW). Additional measurements were made by two other physicians to assess intra-observer and inter-observer reliability (SB and JB). All HCC patients underwent MRI of the liver with intravenous contrast on a 1.5 Tesla scanner. The majority of MRIs were performed ≤ 60 days prior to transplant. Again, target lesions were chosen according to RECIST and analyzed for maximal axial diameter and volume.
Figure 1. Example of CT tumor measurement of longest axial diameter (top) or of volume (bottom).
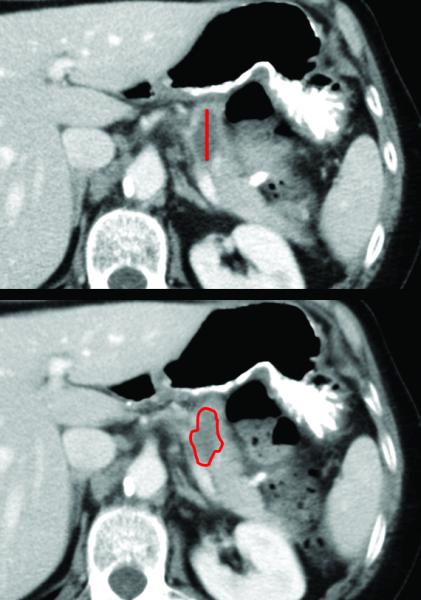
For volumetric measurement, the tumor was circumscribed on each slice with the freeform contouring tool, and then the syngo® TrueD platform computed the volume. The tumor shown is a representative adenocarcinoma of the body of the pancreas measuring 2.5 cm in axial diameter or 2.8 cm3 in volume.
Validation of Imaging by Gross Pathology Comparison
Pathology reports from hepatectomy at the time of liver transplantation were obtained for all of the HCC patients, and tumor measurements were recorded. If there were multiple tumors, the gross anatomic description was reviewed to determine which lesion from the pathology report corresponded with which lesion on MRI. Volumes were computed from tumor dimensions based on the accepted formula for an ellipsoid π/6 × l × w × h.6
Data Analysis
Comparisons were made of axial diameter (RECIST) vs. 3-D maximal diameter and measured volume by contouring vs. RECIST-estimated volume vs. gross pathological volume. Results are reported as mean ± SEM unless otherwise specified. A paired two-sided Student’s t-test with significance level set at α = 0.05 was used to compare differences in PDAs, and a Wilcoxon test was used for the HCCs due to the smaller sample size (n = 68 vs. n = 24) and lack of normality in the data distribution. To evaluate degree of agreement between categorical response classifications made by RECIST vs. volumetry, Kappa statistics were used. With this analysis, κ can range from 0 (less than change agreement) to 0.99 (almost perfect agreement) with κ defined as (PA-PC)/(1-PC) if PA is the overall proportion of agreements and Pc is the overall proportion of agreements expected to agree by chance.7 All statistical analyses were conducted with SAS (v9.2) or R (v2.13).
RESULTS
Comparison of RECIST vs. Volumetry
When comparing RECIST to volumetric measurements in PDA and in HCC, we examined how the maximum axial diameter for each tumor (the diameter that would be chosen by RECIST) related to a maximal computer-generated 3-D diameter after the tumor had been fully contoured. Mean tumor diameter of target lesions was 38% and 36% higher in PDA and HCC respectively for volumetric maximal 3-D diameter than for RECIST chosen axial diameter (3.3 ± 0.3 vs. 2.4 ± 0.2 cm, p < 0.01 for PDA; 3.0 ± 0.2 vs. 2.2 ± 0.2 cm, p < 0.01 for HCC) (Figure 2A). Next we compared the contour-generated volume for each tumor with the respective spherical volume, which is calculated based on the RECIST chosen axial diameter.3 In contrast to the axial diameter measurements, PDA and HCC respective spherical volumes based on RECIST yielded 78% and 23% larger estimated tumor volumes than volumetric analysis (21.7 ± 7.6 vs. 12.2 ± 4.3 cm3, p < 0.01 for PDA and 9.5 ± 2.6 vs. 7.7 ± 2.2 cm3, p = 0.01 for HCC) (Figure 2B).
Figure 2. Comparison of RECIST with volumetry.
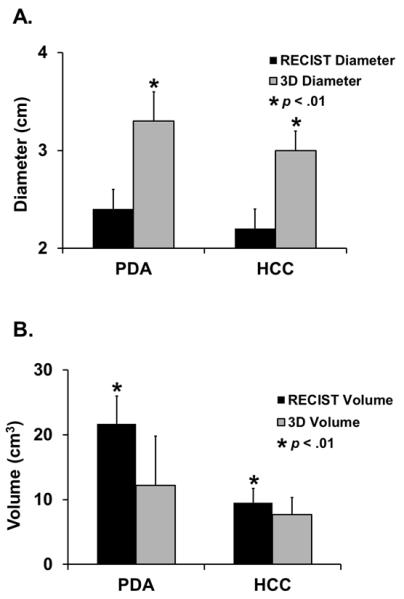
A.) For PDA and HCC, maximal 3-D diameter was significantly greater than maximal axial diameter chosen by RECIST. B.) For PDA and HCC, respective spherical volume calculated from RECIST chosen largest axial diameter was significantly greater than 3-D contoured volume from volumetric analysis.
Accuracy of Volumetry in Predicting Gross Tumor Volume
To examine whether there was a difference in the ability of the different imaging methods to predict actual tumor volume, we compared RECIST-derived respective spherical volumes and contoured volumes from the HCC imaging with volumes calculated from gross tumor measurements of HCC after hepatectomy. As demonstrated in figure 3, both RECIST and volumetric analysis demonstrated a linear correlation with gross pathological volume (r = 0.96, p < 0.01 and r = 0.95, p < 0.01 respectively). However, while gross pathological volume was similar to contoured volume (7.4 ± 2.6 vs. 7.7 ± 2.2 cm3, p = 0.56), respective spherical volume significantly overestimated the actual grossly measured volume an average of 28% (9.5 ± 2.6 vs. 7.4 ± 2.6 cm3, p < 0.01).
Figure 3. Comparison of imaging to gross tumor measurements in HCC.
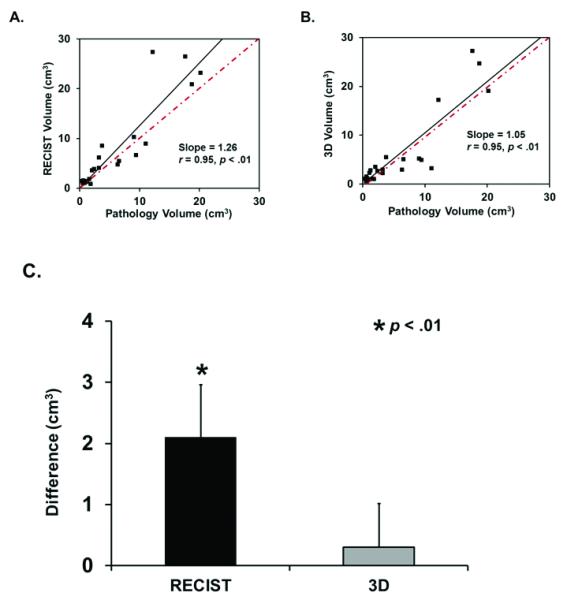
A.) Respective spherical volume calculated from RECIST-chosen diameter demonstrates a linear correlation with gross pathological volume. However, linear regression shows respective spherical volume is 26% larger than gross pathological volume. B) 3-D contoured volume also demonstrates a linear correlation with gross pathological volume, but linear regression reveals 3-D contoured volume is only 5% larger than gross pathological volume. C) RECIST-derived respective spherical volume is significantly different from gross pathological volume, while 3-D contoured volume is similar.
Response Classification Analysis
To determine whether RECIST and volumetric measurements yielded similar classification in regards to treatment response, we examined change in tumor size over time in the 9 PDA subjects. Twenty follow-up CTs were categorized in patients that had received 8 or more weeks of treatment as partial response (-30% diameter or -65% volume), stable disease, or disease progression (+20% diameter or +73% volume) and compared the agreement between the two methods when we used either RECIST or volumetric analysis. Criteria for volume classification were based on extrapolation of RECIST criteria to spherical volumes as previously described.5,8-11 For classifying treatment response in PDA, RECIST agreed with volumetry in 15 of 20 measurements yielding a kappa value of 0.49, corresponding to “moderate agreement” between the two methods. We then tried changing the volume thresholds to +20% for progression of disease and -30% for partial response. However, the level of agreement remained similar (κ = 0.48). There were five individual subjects who had disease progression within the time period of the study. Of these, two subjects progressed by volume criteria prior to RECIST criteria, two progressed by RECIST criteria prior to volume criteria and one progressed by both criteria simultaneously. There was no difference in median time to progression in the RECIST vs. volumetric analysis (4 months vs. 4 months). However, decreasing the volumetric criteria for progression down to +20% resulted in a decreased median time to progression of 2 months, suggesting that volumetry may be able to detect progression earlier than RECIST. This may have significant value for cost and efficiency of clinical trials.
Reproducibility of Volumetric Analysis
To determine whether volumetric analysis is clinically feasible, we assessed intra-rater and inter-rater reliability compared to the previously validated RECIST criteria. For intra-rater reliability in HCC, the intra-class correlation coefficients were 0.99 for diameter and 0.99 for volume based on measurements on three separate days. In PDA, the intra-class correlation coefficients for intra-rater reliability were 0.89 for diameter and 0.62 for volume.
For inter-rater reliability in HCC, the intra-class correlation coefficients for diameter and volume were 0.75 and 0.84 respectively based on measurements from three separate raters.12 In PDA, the intra-class correlation coefficients for inter-rater reliability were 0.81 and 0.79 for diameter and volume. Thus, the reproducibility of volumetric analysis is similar to the already accepted RECIST method in both PDA and HCC.. However overall there is less inter- and intra-observer reliability for PDA compared to HCC, likely due to the less well-defined margins of this tumor type.
DISCUSSION
Here we demonstrate some of the difficulties in using RECIST for evaluation of tumor response, specifically the concept of using a uni-dimensional measurement as a surrogate measure for the growth of a three-dimensional tumor. Our study demonstrates that RECIST may significantly overestimate tumor burden compared to volumetric measurements in both PDA and HCC. Our work agrees with Rezai et al. who demonstrated that PDAs are not spherical in shape and their respective spherical volumes calculated from RECIST overestimate contoured volumes.5 Other groups have demonstrated the same findings in patients with liver metastases11 and in studies with phantom ellipsoids 4,10,13. Also, volumetric analysis has been shown to be more accurate in predicting actual tumor size compared with RECIST in these phantom ellipsoid studies.4,5 Our current study complements these studies by demonstrating that volumetry may be more accurate than RECIST in determining actual tumor sizes by being able to validate these imaging measurements with the measurements of the resected tumors. Because RECIST may significantly overestimate tumor burden compared to volumetric measurements in PDA and HCC, volumetry may be the preferred method for detecting tumor progression.
One main limitation of this approach is the difficulty in comparing a diameter with a volume. Mere extrapolation of diameters to their respective spherical volumes poses a problem given that the tumors measured have irregular morphology. Our response category analysis aimed to avoid this problem by comparing response categories rather than directly comparing diameters with volumes to explore whether the implementation of volumetry in PDA imaging may potentially affect outcome in clinical trials. Our results demonstrate only moderate agreement between the two methods. Thus, using volumetry rather than RECIST could potentially alter clinical decision-making since patients may be removed from trial at the time of disease progression based on imaging. Here, we observed decreasing this threshold to +30% led to a possible decrease in median time to progression, suggesting volumetry may be able to detect progression earlier. Nonetheless, we have not determined the optimum volume change threshold for classifying a tumor as partial response or as progressive disease. Merely converting RECIST diameters to their spherical volume equivalent relies on large increases (73%) or decreases (65%) in volume for a classification change. Marten et al. showed that CT can reliably detect a volume change as low as thirty-five percent in pulmonary metastases.14
Another potential limitation in categorizing treatment response with either RECIST or volumetry is limited inter-observer agreement when classifying disease response. Kessel et al. examined inter-observer agreement in categorizing response in colorectal liver metastases and found substantial discordance between observers regardless of whether manual diameter, automated diameter, or automated volume measurements were used.15 Similarly, Skougaard et al. noted substantial discrepancies among observers when determining best overall response by RECIST.16 Work to develop consistent volumes using computer based algorithms may be important in the future to diminish the impact of this issue.
In summary, 3-D diameter in volumetric analysis was higher than RECIST in PDA and HCC; however RECIST yielded larger estimated tumor volumes than volumetric analysis. In categorizing treatment response in PDA, RECIST and volumetric analysis agreed only moderately. Thus, RECIST may significantly overestimate tumor burden compared to volumetric measurements in both PDA and HCC. Volumetric analysis may be the preferred method to detect tumor progression. We acknowledge Dr. John Bayouth for instruction in the syngo® TrueD platform.
Acknowledgments
Supported by NIH grants T32 CA148062 and U01 CA140206 Running title: RECIST vs. volumetry in pancreatic cancer Keywords: RECIST, Volumetry, Pancreatic cancer, Hepatocellular carcinoma
Footnotes
Publisher's Disclaimer: This is a PDF file of an unedited manuscript that has been accepted for publication. As a service to our customers we are providing this early version of the manuscript. The manuscript will undergo copyediting, typesetting, and review of the resulting proof before it is published in its final citable form. Please note that during the production process errors may be discovered which could affect the content, and all legal disclaimers that apply to the journal pertain.
Presented at the 36th annual meeting of the Association of VA Surgeons, Miami, Florida, April 1-3, 2012.
REFERENCES
- 1.Eisenhauer EA, Therasse P, Bogaerts J, et al. New response evaluation criteria in solid tumours: revised RECIST guideline (version 1.1) Eur J Cancer. 2009;45(2):228–47. doi: 10.1016/j.ejca.2008.10.026. [DOI] [PubMed] [Google Scholar]
- 2.Husband JE, Schwartz LH, Spencer J, et al. Evaluation of the response to treatment of solid tumours - a consensus statement of the International Cancer Imaging Society. Br J Cancer. 2004;90(12):2256–60. doi: 10.1038/sj.bjc.6601843. [DOI] [PMC free article] [PubMed] [Google Scholar]
- 3.Sohaib SA, Turner B, Hanson JA, et al. CT assessment of tumour response to treatment: comparison of linear, cross-sectional and volumetric measures of tumour size. Br J Radiol. 2000;73(875):1178–84. doi: 10.1259/bjr.73.875.11144795. [DOI] [PubMed] [Google Scholar]
- 4.Levine ZH, Borchardt BR, Brandenburg NJ, et al. RECIST versus volume measurement in medical CT using ellipsoids of known size. Opt Express. 2010;18(8):8151–9. doi: 10.1364/OE.18.008151. [DOI] [PubMed] [Google Scholar]
- 5.Rezai P, Mulcahy MF, Tochetto SM, et al. Morphological analysis of pancreatic adenocarcinoma on multidetector row computed tomography: implications for treatment response evaluation. Pancreas. 2009;38(7):799–803. doi: 10.1097/MPA.0b013e3181ac7511. [DOI] [PubMed] [Google Scholar]
- 6.Tomayko MM, Reynolds CP. Determination of subcutaneous tumor size in athymic (nude) mice. Cancer Chemother Pharmacol. 1989;24(3):148–54. doi: 10.1007/BF00300234. [DOI] [PubMed] [Google Scholar]
- 7.Cohen J. A Coefficient of Agreement for Nominal Scales. Educ Psychol Meas. 1960;20(1):37–46. [Google Scholar]
- 8.Frauenfelder T, Tutic M, Weder W, et al. Volumetry: an alternative to assess therapy response for malignant pleural mesothelioma? Eur Respir J. 2011;38(1):162–8. doi: 10.1183/09031936.00146110. [DOI] [PubMed] [Google Scholar]
- 9.James K, Eisenhauer E, Christian M, et al. Measuring response in solid tumors: unidimensional versus bidimensional measurement. J Natl Cancer Inst. 1999;91(6):523–8. doi: 10.1093/jnci/91.6.523. [DOI] [PubMed] [Google Scholar]
- 10.Levine ZH, Galloway BR, Peskin AP, et al. Tumor volume measurement errors of RECIST studied with ellipsoids. Med Phys. 2011;38(5):2552–7. doi: 10.1118/1.3577602. [DOI] [PubMed] [Google Scholar]
- 11.Mantatzis M, Kakolyris S, Amarantidis K, et al. Treatment response classification of liver metastatic disease evaluated on imaging. Are RECIST unidimensional measurements accurate? Eur Radiol. 2009;19(7):1809–16. doi: 10.1007/s00330-009-1327-4. [DOI] [PubMed] [Google Scholar]
- 12.Rousson V, Gasser T, Seifert B. Assessing intrarater, interrater and test-retest reliability of continuous measurements. Stat Med. 2002;21(22):3431–46. doi: 10.1002/sim.1253. [DOI] [PubMed] [Google Scholar]
- 13.Rkein AM, Harrigal C, Friedman AC, et al. Comparison of the accuracy of CT volume calculated by circumscription to prolate ellipsoid volume (bidimensional measurement multiplied by coronal long axis) Acad Radiol. 2009;16(2):181–6. doi: 10.1016/j.acra.2008.08.013. [DOI] [PubMed] [Google Scholar]
- 14.Marten K, Auer F, Schmidt S, et al. Automated CT volumetry of pulmonary metastases: the effect of a reduced growth threshold and target lesion number on the reliability of therapy response assessment using RECIST criteria. Eur Radiol. 2007;17(10):2561–71. doi: 10.1007/s00330-007-0642-x. [DOI] [PubMed] [Google Scholar]
- 15.van Kessel CS, van Leeuwen MS, Witteveen PO, et al. Semi-automatic software increases CT measurement accuracy but not response classification of colorectal liver metastases after chemotherapy. Eur J Radiol. 2012 doi: 10.1016/j.ejrad.2011.12.026. [DOI] [PubMed] [Google Scholar]
- 16.Skougaard K, McCullagh MJ, Nielsen D, et al. Observer variability in a phase II trial - assessing consistency in RECIST application. Acta Oncol. 2012 doi: 10.3109/0284186X.2012.667149. [DOI] [PubMed] [Google Scholar]