Summary
Lactose permease of Escherichia coli (LacY) catalyzes symport of a galactopyranoside and an H+ via an alternating access mechanism. The transition from an inward- to an outward-facing conformation of LacY involves sugar-release followed by deprotonation. Because the transition depends intimately upon the dynamics of LacY in a bilayer environment, molecular dynamics (MD) simulations may be the only means of following the accompanying structural changes in atomic detail. We describe here MD simulations of wild-type apo LacY in phosphatidylethanolamine (POPE) lipids that features two protonation states of the critical Glu325. While the protonated system displays configurational stability, deprotonation of Glu325 causes significant structural rearrangements that bring into proximity sidechains important for H+ translocation and sugar binding and closes the internal cavity. Moreover, protonated LacY in phosphatidylcholine (DMPC) lipids shows that the observed dynamics are lipid-dependent. Together, the simulations describe early dynamics of the inward-to-outward transition of LacY that agree well with experimental data.
Keywords: lactose permease, protonation states, protein-lipid interactions, MD simulations
Introduction
Major Facilitator Superfamily (MFS) proteins are a large and diverse family of membrane proteins that transport substrates ranging from ions to peptides and drug molecules (Pao et al., 1998). The translocation process is believed to occur by an alternating access mechanism involving transitions between inward-facing and outward-facing conformations that alternatively expose the interior of the protein to either side of the membrane (Jardetzky, 1966). The coupled translocation of an H+ and a galactopyranoside (lactose/H+ symport) catalyzed by lactose permease (LacY), has become the prototype for MFS transport. A large number of biochemical studies have revealed the basic mechanism of symport and identified the key residues involved (Guan and Kaback, 2006). Nevertheless, the dynamics and structural changes that underlie the transitions between the inward-facing and outward-facing conformations are largely unknown. It seems clear, however, that deprotonation of Glu325 is coupled with conformational events in sugar-free LacY leading to the change from an inward- to outward-facing conformation or the reverse (Guan and Kaback, 2006). To understand the critical role of deprotonating a key amino acid residue, we have used MD simulations to examine how changes in the protonation state of Glu325 may affect the structure and dynamics of LacY in the absence of sugar substrates. Moreover, a common theme amongst MFS transporters seems to be that of a highly flexible protein that is tightly coupled to its bilayer environment (le Coutre et al., 1997; Enkavi and Tajkhorshid, 2010; Baker et al., 2012), meaning that protein-lipid structural dynamics are central to the transport cycle. To characterize the protein-lipid dynamical coupling, MD simulations were performed in two different lipid environments.
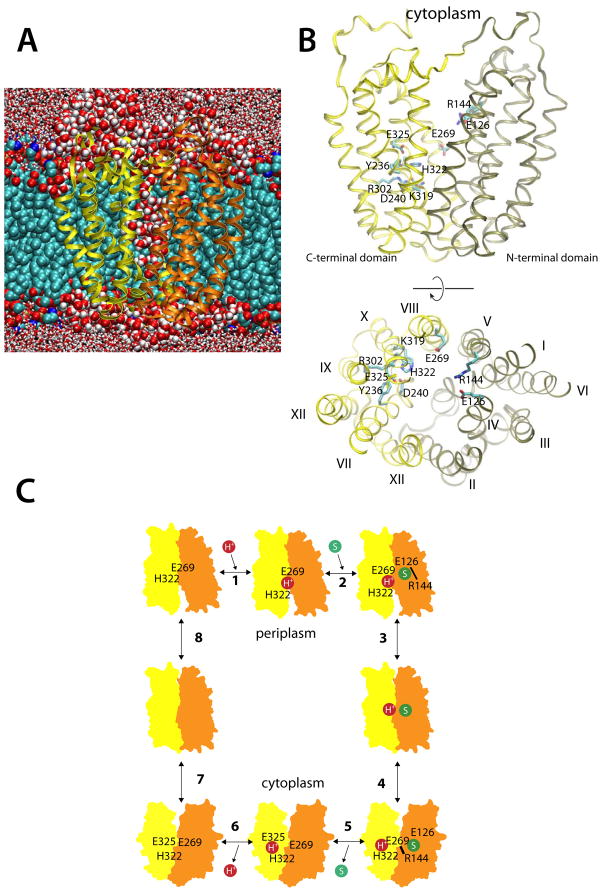
LacY is composed of N- and C-terminal domains, each with six mostly irregular transmembrane helices connected by a long loop between helices VI and VII. Crystal structures so far have captured LacY in an inward-facing conformation only. The structures reveal a large aqueous cavity open to the cytoplasm and tightly closed to the periplasm (Abramson et al., 2003; Mirza et al., 2006; Guan et al., 2007; Chaptal et al., 2011) (Figure 1A) and are consistent with the structure of LacY in the membrane (Nie and Kaback, 2010). This water-filled cavity separates the substrate-binding site (located largely in the N-terminal domain) from the H+-translocating site in the C-terminal domain by ~7 Å (Figure 1B). However, because the sidechains involved in H+ translocation also affect sugar affinity (Smirnova et al., 2009), structural rearrangements in an intermediate conformation may lead to direct interaction between the two sites (Smirnova et al., 2007).
Figure 1.
Simulating LacY and the sites of H+ translocation and sugar binding. (A) A representative snapshot of the simulation cell. Here, LacY is shown inserted into a POPE bilayer; carbons (cyan), oxygens (red) and phosphates (brown) are represented by van der Waals spheres. The protein N- and C-terminal domains are colored tan and yellow, respectively. Water molecules within 5 Å are depicted as red and white van der Waals spheres, while water beyond this limit are licorice representations. (B) Side-view and top-view of the crystal structure of inward-facing wild-type apo LacY (PDB ID 2V8N), colored according the scheme in (A). Amino acid residues participating in H+ translocation and sugar binding are displayed as cyan licorice representations. (C) The eight-step LacY reaction scheme, where a proton (step 1) and a substrate molecule (step 2) binds to the outward-facing LacY state, which undergoes conformational change to face the cell interior (step 3–4). Substrate release (step 5) and deprotonation (step 6) then trigger the inward-to-outward transition (step 7–8). See also Figure S1.
A simple reaction cycle for lactose/H+ symport (Figure 1C) has been proposed based on extensive studies of partial reactions (efflux, equilibrium exchange, and entrance counter-flow) catalyzed by LacY and site-directed mutants defective in the symport mechanism [see Kaback et al. (2001)]. Beginning with an outward-facing conformation, step 1 represents protonation of LacY [the apparent pKa for sugar binding is ~10.5 (Smirnova et al., 2009)]. The H+ is thought to reside in the vicinity of Glu269 (helix VIII) and His322 (helix X), both of which are part of an extensive salt-bridge/H-bond network that defines the H+-translocation site in the C-terminal domain. Glu269 and His322 may interact closely in this initial protonated state (Jung et al., 1993; Jung et al., 1994; Jung et al., 1995; He and Kaback, 1997), despite the ~7 Å separation observed in the inward-facing crystal structure. In addition to participating in H+ translocation, Glu269 has been identified as critical in sugar binding (Ujwal et al., 1994; Smirnova et al., 2009), and therefore may constitute a link between the H+-translocation site and the sugar-binding site.
Glu126 (helix IV) and Arg144 (helix V) in the N-terminal domain are absolutely required for sugar binding to protonated LacY (Frillingos et al., 1997; Smirnova et al., 2009) (step 2), which initiates the outward-to-inward facing transition of LacY in steps 3–4. The transition is accompanied by disruption of the Arg144-Glu126 salt-bridge and formation of an Arg144-Glu269 salt bridge (Abramson et al., 2003; Mirza et al., 2006). The relocation of Glu269 towards the sugar-binding site is associated with a movement of His322 towards the final H+ acceptor, Glu325 (helix X). Substrate release in step 5 leads to a series of structural rearrangements within the salt-bridge/H-bond network in which rearrangement of Arg302 (helix IX) is associated with deprotonation of Glu325 (Sahin-Tóth and Kaback, 2001) (step 6). The details of the dynamics are unclear, but they involve a complex salt bridge/H-bond network composed of Lys319 (helix X), Tyr236, and Asp240 (helix VII), in addition to Arg302 (Abramson et al., 2003). After releasing an H+ to the cytoplasm, LacY assumes an outward-facing conformation (steps 7–8). During this transition, His322 again forms an H-bond with Glu269 and the reaction cycle starts again.
MD simulations can be used to reconcile static crystal structure information with the dynamical nature of a reaction scheme derived from biochemical experiments. Two triggers are conveniently incorporated in the LacY reaction cycle: (a) binding of a galactopyranoside to a protonated state of LacY (outward-to-inward transition; Figure 1C, steps 3–4) and (b) substrate release and subsequent deprotonation of LacY (inward-to-outward transition; Figure 1C, steps 7–8) (Guan and Kaback, 2006). LacY’s inward-to-outward transition was first addressed in an MD study where partial closing of the cytoplasmic cavity in LacY was observed in a 10 ns simulation of a sugar-bound LacY state where Glu325 and Glu269 were deprotonated and protonated, respectively (Yin et al., 2006). However, no significant conformational changes were observed when changing protonation states in the apo protein. In a more recent simulation, the inward-to-outward transition was studied by deprotonating Glu325 in an apo state of LacY (Holyoake and Sansom, 2007), much like the approach used here. Partial closure of the cytoplasmic side was observed, which involved helices IV, V and X, XI of the N- and C-terminal domains, respectively. However, closing the cytoplasmic cavity was independent of the Glu325 protonation state, which is contrary to the hypothesis that deprotonation of Glu325 following dissociation of sugar triggers a conformational change in apo LacY (Guan and Kaback, 2006). The lack of dependence might be related to the simulation setup; in both studies the C154G mutant structure, which is severely restricted conformationally and does not transport H+ (Smirnova and Kaback, 2003; Garcia-Celma et al., 2009), was used as starting structure. Furthermore, dimyristoylphospatidylcholine (DMPC) lipids, used in the Holyoake et al. (2007) simulation, have been reported to show lower in vitro LacY transport rates relative to PE lipids (Bogdanov et al., 2002; Bogdanov et al., 2010). Other simulations have addressed the outward-to-inward transition using a hybrid approach that combined implicit and explicit membrane MD simulations (Pendse et al., 2010).
Our simulations of a substrate-free protein provide insights into the protonation-coupled dynamical interplay between salt-bridge/H-bond side-chain networks and global protein conformations by studying the consequences of deprotonating a critical amino acid residue Glu325 (Figure 1C, step 6), which represents the step in the reaction cycle immediately preceding the inward-to-outward transition (Figure 1C, step 7–8). The wild-type LacY structure (Guan et al., 2007) was used as starting coordinates rather than the conformationally restricted C154G mutant (Abramson et al., 2003). In addition, the protein was embedded into both optimal palmitoyloleoylphosphatidylethanolamine (POPE) and non-optimal dimyristoylphosphatidylcholine (DMPC) lipids. Our basic strategy was to contrast two simulation systems that differed either in protonation state of Glu325 or the nature of the surrounding lipids. In POPE lipids, two very different dynamic patterns emerged that depended strongly on the Glu325 protonation state. In the deprotonated state, the cytoplasmic cavity closed. Therefore, deprotonation of the final H+ acceptor in the apo protein likely destabilizes the inward-facing conformation and induces the transition to an outward-facing state. Furthermore, the H+- and sugar-binding sites (represented by His322 and Glu269, respectively), which are separated in the crystal structure and in the protonated Glu325 simulation, rearranged and interacted in response to deprotonation of Glu325. The observed sidechain rearrangements suggest a mechanism in which structural communication between the sites involved in H+ translocation and sugar binding occurs. In DMPC lipids, we found deprotonated LacY to be detached from lipid headgroups and to be deficient in both cytoplasmic cleft closure and any significant sidechain rearrangements.
Results
MD simulations (Table 1) were performed with wild-type LacY (PDB ID 2V8N) inserted into POPE or DMPC lipid bilayers in excess water (Figure 1A); sugar substrate was absent in all cases. The POPE systems contained 613 lipids and 30,418 water molecules, while the corresponding numbers for DMPC were 576 and 44,889. In POPE lipids, we performed one simulation of protonated LacY [E325(H)] and three of deprotonated LacY [E325(−) 1–3]. The corresponding DMPC system contained 576 lipids and 44,889 water molecules and was used to simulate deprotonated LacY [E325(−)/DMPC]. The evolution of the simulation box dimensions (Figure S1) showed that each system reached equilibration after 30 ns.
Table 1.
Summary of LacY MD simulations
| Simulation | E325 protonated | Lipid | Length (ns) |
|---|---|---|---|
| E325(H) | yes | POPE | 85 |
| E325(−) 1 | no | POPE | 85 |
| E325(−) 2 | no | POPE | 83 |
| E325(−) 3 | no | POPE | 53 |
| E325(−)/DMPC | no | DMPC | 100 |
LacY structural dynamics depend on the protonation state of Glu325 and the surrounding lipids
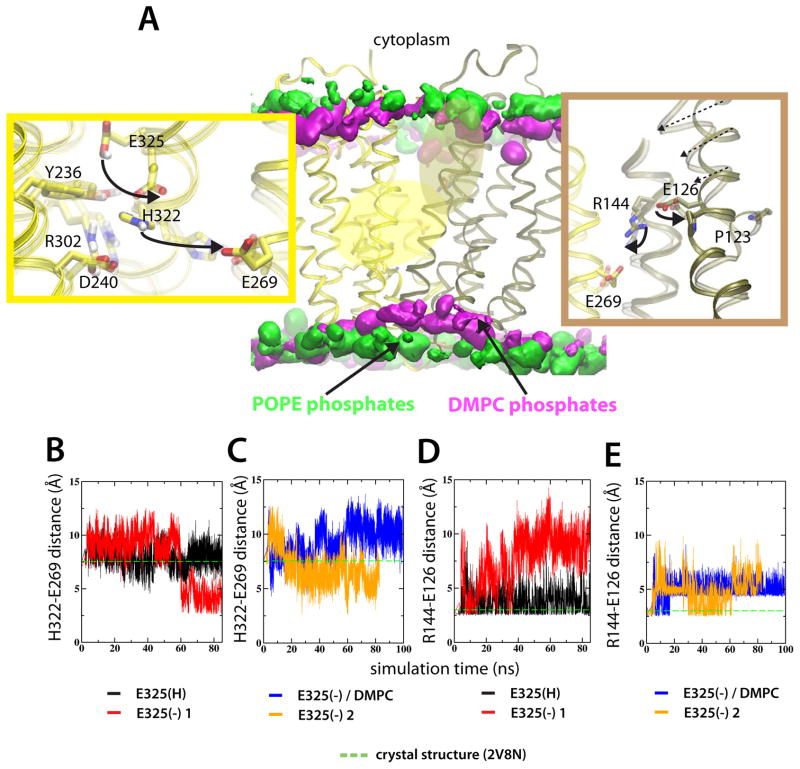
The major side-chain rearrangements in the simulations of LacY, identified by comparing the E325(H) and E325(−) simulations in POPE lipids, were observed in the vicinity of the sites of H+ translocation and sugar binding (Figure 2A). In the E325(H) simulation, the locations of residues important for H+ translocation were similar to the crystal structure (Figure 2B,D). In contrast, upon deprotonating Glu325, significant rearrangements occurred within this complex salt-bridge/H-bond network (Figure 2). To ensure the reproducibility of these rearrangements, three independent E325(−) simulations were performed [E325(−) 1–3, see Table I]. Each simulation was initiated from identical coordinates, but with different (random) initial velocities. The most prominent feature in the E325(−) simulations, was a shift of His322, up to 5 Å, from its starting position, close to Glu325 and Tyr236, towards Glu269 (Figure 2A–C). Because Glu269 participates in sugar binding (Ujwal et al., 1994), the His322 movement apparently constitutes a means of structural communication between the H+ translocating and sugar binding sites. The His322-Glu269 interaction was not observed when an identical deprotonated state of LacY was inserted into DMPC lipids [E325(−)/DMPC] (Figure 2C).
Figure 2.
Structural side-chain rearrangements in LacY are protonation-state dependent. (A) The middle panel shows LacY embedded in two different lipid environments. Lipid phosphates of the POPE and DMPC bilayers are represented by 5% isodensity surfaces in green and silver, respectively. The 5% occupancies correspond to the common surface in 5% of the simulation frames. Two high-dynamic regions are colored according to the closest domain; H+ translocating site and the sugar binding site is yellow and tan, respectively. Details of the H+ translocating site (left panel) and sugar binding site (right panel) show the average of the last ns of the E325(H) and E325(−) 1 simulations in POPE lipids, respectively. The evolution of the inter-atomic H322-E269 distance for the E325(H) and E325(−) 1 simulations (B) and E325(−) in and E325(−) 2 simulations (C), respectively. The corresponding E126-R134 distances are shown in (D-E). Distances in the crystal structure are represented as green, dashed lines. See also Figure S2–S4.
In the E325(H) simulation, as in the LacY crystal structure, a salt-bridge was present between Arg144 and Glu126 in the sugar-binding site (Figure 2D). Upon deprotonation of Glu325, the interaction between Arg144 and Glu126 was dramatically weakened (Figure 2A,D-E). The degree of weakening of the Arg144-Glu126 salt-bridge was linked to closure of the cytoplasmic cavity; Glu126 is situated on Helix IV of LacY and a disrupted Arg144-Glu126 salt-bridge (E325(−) 1 simulation) was observe to fully close the cytoplasmic cavity, while a weakened, but not fully disrupted interaction (E325(−) 2 simulation), only resulted in an intermediate closing movement of Helix IV (Figure S2A). Moreover, following Arg144-Gu126 disruption, Arg144 became reoriented towards Glu269 (Figure S2B), reflecting how side-chains in the sugar-binding site moved towards the H+ translocation site. Because Arg144 and Glu269 are located in the N- and C-terminal domains, respectively, this interaction suggests an important interaction between the domains of LacY. These rearrangements were much less pronounced in the E325(H) simulation and completely absent in the E325(−)/DMPC simulation, where the distance between Glu269 and Arg144 remained close to the 8.5 Å in the crystal structure (Figure S2B).
Full disruption of the Arg144-Glu126 salt-bridge coincided temporally with the movement of His322 (at ~60 ns, compare Figures 2B and 2D). Thus, by synchronization of structural rearrangements, large-scale conformational changes can be related to the protonation state of Glu325. The structural transition at ~60 ns resulted in significant structural rearrangements extending from Glu325 to the cytoplasmic end of the protein. Hence, by contrasting MD simulations of two protonation states it is possible to identify members of such an interconnected salt-bridge/H-bond complex (e.g. Figure 2B–E) as well as non-members (Figure S3). The observed changes are consistent with the idea that deprotonation of LacY, following release of sugar, is the final event before the inward-to-outward transition (Guan and Kaback, 2006).
Deprotonation of Glu325 induces large-scale conformational changes in POPE but not DMPC lipids
The first crystal structures of LacY were obtained using the conformationally constrained C154G mutant in the presence of a high-affinity lactose homolog (Abramson et al., 2003; Mirza et al., 2006). However, neither the C154G mutant structure nor the wild-type structure (Guan et al., 2007) revealed an unambiguous electron density in the binding site near the apex of the inward-facing cavity, suggesting that the inward-facing conformation of apo LacY represents the lowest energy state in the reaction cycle, a conclusion consistent with site-directed alkylation studies in the native bacterial membrane (Nie and Kaback, 2010). Indeed, the MD simulations of the E325(H) apo protein showed a relatively low backbone root mean square deviation (RMSD) of <2 Å, indicating a stable conformation (Figure S4). Upon Glu325 deprotonation, a considerably more dynamic structure was observed, indicated by an increase of the backbone RMSD (Figure S4).
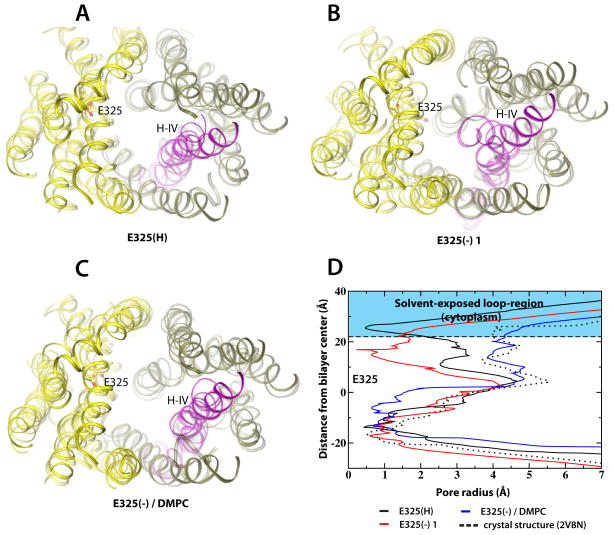
By comparing the LacY crystal structure to averages of the last simulated ns, both visually (Figure 3A–C) and by pore radius analyses (Figure 3D), we concluded that the increased dynamics in the E325(−) simulations were coupled to major conformational changes on the cytoplasmic side involving primarily the N-terminal helix IV. Even though helix IV was observed to be flexible in the E325(H) simulation (Figure 3A), its dynamic nature was significantly enhanced in the E325(−) simulation where helix IV performed a closing movement of the cytoplasmic cleft of LacY (Figure 3B). A mid-membrane proline residue (Pro123) might account for the flexibility of this helix (Figure 2 and S2A). The pore radius analysis showed a full cytoplasmic closure of E325(−) simulation, while E325(H) was closer to the crystal structure (Figure 3D). Because the helix IV movement was closely linked to the destabilization of the Arg144-Glu126 salt-bridge, the degree of cytoplasmic closing movement varied between repeat simulations, although origin and directionality were maintained (Figure S5). The structural dynamics in the E325(−) state of LacY in POPE lipids suggested a set of ordered movements originating from the vicinity of the H+ translocation site, while the same system in DMPC lipids was characterized by the complete lack of cytoplasmic closure (Figure 3C–D).
Figure 3.
Conformational changes in LacY are protonation-state dependent. Structural changes in LacY are displayed by superimposing the starting structure (solid) on the final snapshot from the (A) E325(H), (B) E325(−) 1 and (C) E325(−)/DMPC simulations (transparent helices). Loop regions were removed for clarity. The N- and C-terminal domains colored in tan and yellow, respectively. Helix IV is depicted in magenta. (D) Pore radius analyses extracted using the program HOLE (Smart et al., 1993) of simulations E325(H) (black) and E325(−) 1 (red) and E325(−)/DMPC (blue). The pore radius of the crystal structure is shown for reference (dotted line). See also Figure S5.
We evaluated the direction and magnitude of the helix IV structural changes by comparing distance measurements between neighboring Cα atoms in the simulations to distances obtained from crosslinking (Sorgen et al., 2002; Liu et al., 2010) and from double electron-electron resonance (DEER) studies (Smirnova et al., 2007). By comparing the nature of the experimentally measured conformational changes in the presence of sugar (Figure 1C, step 3–4) to the simulated inward-to-outward transition (i.e. in the absence of sugar, step 7–8 in Figure 1C), we are thus exploring the assumption that both access-alternating directions should be similar. Also, because the simulations range in the 100 ns time-scale, it is likely that the observed structural changes represent initial structural rearrangements in the chain of events that ultimately opens towards the periplasm (Figure 1C, step 7–8).
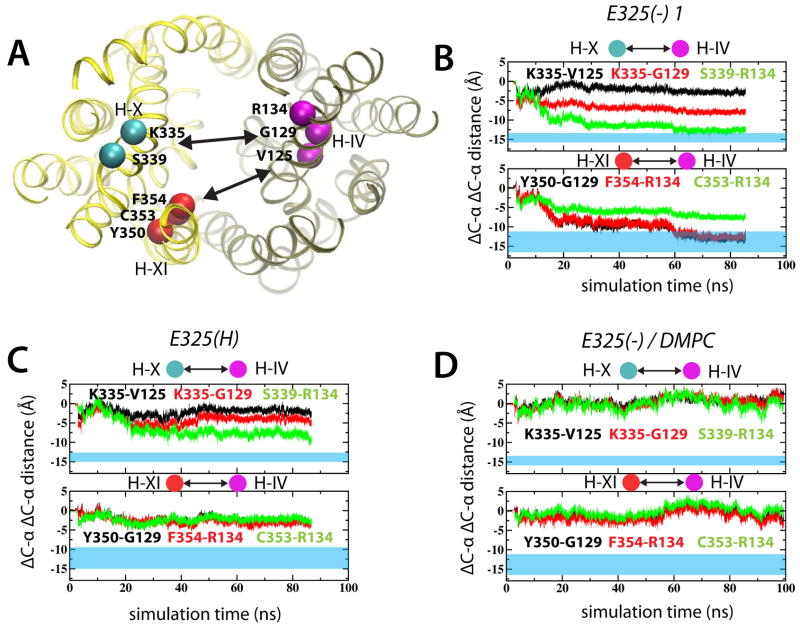
To compare simulated helix movements to thiol crosslinking studies, the anticipated inter-residue distance changes were derived from the crystal structure and the fact that residues crosslink at 9–10 Å (blue sections Figure 4B–D). In the E325(−) 1 simulation, we observed helix X-IV pairs (Lys335-Gly129 and Ser339-Arg134) to display 12.6–7.8 Å distance changes, respectively (Figure 4B, upper plot). The changes in the innermost pair (Lys336-Val125) were significantly smaller, measuring only ~2.9 Å. Additional crosslinking experiments indicated that helix IV also moves towards helix XI, as displayed by pairs F354-R134, C353-R134 and Y350-G129 (Wu et al., 1998). Indeed, these positions underwent significant changes ranging from 7.2–13.3 Å in the E325(−) 1 simulation (Figure 4B, lower plot). The corresponding distance changes in the E325(H) simulation were significantly smaller (Figure 4C). Strikingly, when simulating the E325(−) system in DMPC lipids, no structural changes were observed (Figure 4D).
Figure 4.
Simulated conformational changes in light of experimental crosslinking data. (A) Specific positions used for crosslinking are marked by spheres in the 2V8N crystal structure. The change in distances between Cα in helices IV-X and IV-XI are shown for the E325(−) 1 (B) and E325(H) (C) simulations. (D) The corresponding distances for the E325(−)/DMPC simulation. The blue transparent regions correspond to experimentally measured distances. See also Figure S8.
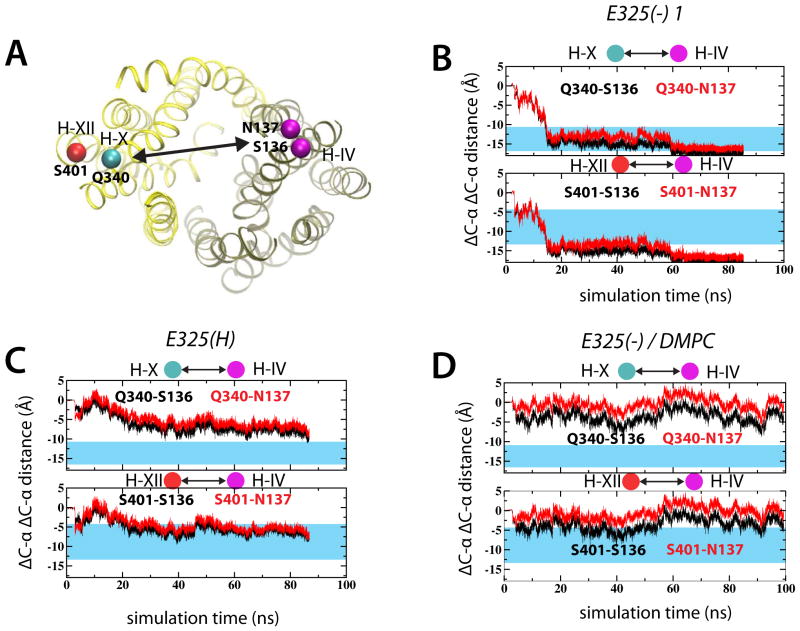
We also compared the closing movement of helix IV with the DEER data (Smirnova et al., 2007), where movements of helix IV (positions 136 and 137) toward helix X (position 340) and XII (position 401) were in the range of 11–18 Å (see blue regions in Figure 5B–D) and involved a counterclockwise rotation. The simulated distances in the E325(H) simulation measured 5.5 to 8.1 Å (Figure 5B), while the E325(−) simulation exhibited distance differences from 16.2 to 17.5 Å (Figure 5C). However, the experimentally observed changes between helix III and either helix X or XII (results not shown), were not present in the simulations, likely because the simulations explore only the early rearrangements in the inward-to-outward transition. It is therefore possible that the motion of helix III would have followed the closing motion of helix IV, given a long enough simulation. Again, simulating E325(−) in DMPC lipids did not result in significant helical movements (Figure 5D).
Figure 5.
Simulated conformational changes in light of experimental DEER data. (A) Specific residues used in the DEER experiments are marked in the 2V8N crystal structure. Changes in Cα-Cα distances between helix IV and either helix X or XII measured from the E325(−) 1 (B) and E325(H) simulations. (D) shows the corresponding distances in the E325(−)/DMPC simulation. See also Figure S9.
Sidechain dynamics triggered by deprotonating Glu325
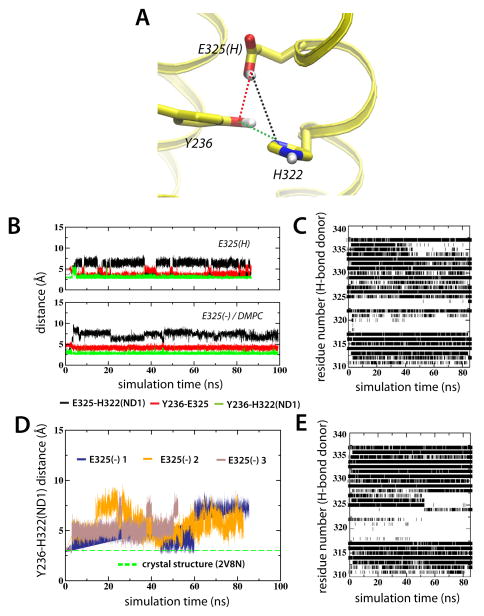
Dynamic structural interactions between residues comprising the H+-translocation and sugar-binding sites following deprotonation of E325 became apparent when the E325(H) and E325(−) simulations were compared. Because Glu269 is involved both in H+ translocation and sugar binding, this residue was taken to represent a boundary between the two sites. In the crystal structures (Abramson et al., 2003; Mirza et al., 2006; Guan et al., 2007), as well as in the E325(H) simulation, these sites are separated by more than 6 Å (His322-Glu269 distance). In the E325(H) trajectory, Tyr236 and Glu325 formed a tight connection to the Nδ1 position of His322 (Figure 6A and B (upper plot)). The Y236-E325-H322 triad was intact throughout the simulation and the interaction of His322 and Glu325, both located one turn from each other in helix X, resulted in the breakage of backbone CO-HN interactions and local unwinding in the region of helix X (Figure 6C).
Figure 6.
Deprotonation of Glu325 affects the solvation shell surrounding His322. (A) Glu325, His322, Tyr236 interactions displayed using the average configuration of the last ns of the E325(H) simulation. (B) The dynamics of Glu325, Tyr236 and His322 are represented as interatomic distances between Glu325-His322 (black), Glu325-Tyr236 (red) and His322-Tyr236 (green). (C) Backbone hydrogen bonding of helix X for the E325(H) simulation. O-HN hydrogen bonds between residue i and i+4 were defined as existing when the O-N distance was within 3.5 Å and the O-H-N angle was greater than 130°. The ev olution of the Y236-H322(ND1) interatomic distance for E325(−) 1, E325(−) 2 and E325 (−) 3 in POPE are shown in (D). (E) corresponds to (C) for the E325(−) 1 simulation.
However, in the E325(−) simulations, we observed structural rearrangements that brought His322 and Glu269 into close proximity. His322 breaking from its original cluster shuttling 5.0 Å towards Glu269, was observed in all three simulations of the E325(−) state in POPE lipids, as illustrated by the increase in Y236-H322 distance (Figure 6D). The E325(−) 1 simulation showed the release of H322 to follow a period of more pronounced local unwinding of helix X (Figure 6E). At ~50 ns, unwinding of helix X spread toward the cytoplasmic end, eventually inducing release of Glu325 at ~60 ns from the solvation shell surrounding His322 (Figure 6D, blue line). The weakened solvation shell enabled the release of H322 to interact with Glu269. The dynamics of this deprotonation event were lipid-dependent since the solvation shell surrounding His322 was intact in the E325(−) system in DMPC lipids.
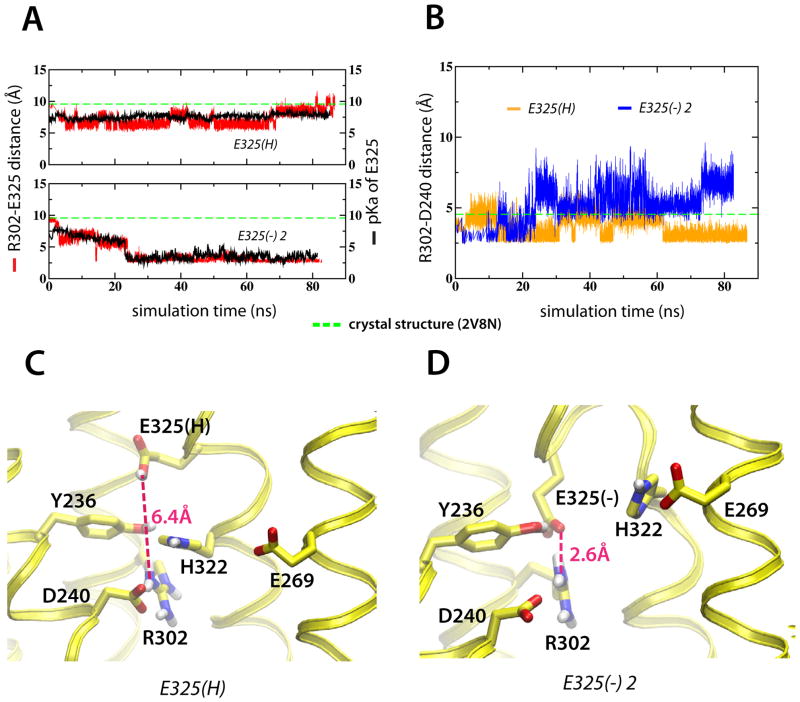
In two of the three E325(−) simulations, the deprotonated Glu325 formed a salt-bridge to Arg302 following disruption of the solvation shell surrounding His322 (Figure 7A and S6A). In the third case [E325(−) 1], Glu325 remained solvated by water molecules and did not interact with Arg302 after disruption of the His322 solvation shell (Figure S6A). This temporal variance is expected because the outcome of MD simulations reflects the stochastic nature protein reaction dynamics. We used an empirical pKa predictor, PROPKA3 (Olsson et al., 2011), to determine the pKa values of Glu325 (Figure 7A) and other crucial residues (Figure S7). The pKa of Glu325 was found to be directly related to the Glu325-Arg302 salt-bridge formation; the last 10 ns of the E325(H) simulation averaged to a pKa of 7.6, while the corresponding pKa in the E325(−) 2 simulation was 3.2 (Figure 7). In order for the Arg302-Glu325 salt-bridge to form, Arg302 must leave its original salt-bridge partner Asp240. Indeed, in two of the E325(−) simulations we find a weakening of the Arg302-Asp240 salt-bridge temporally coinciding with the Arg302-Glu325 salt-bridge formation (Figure 7B and S6B). Hence, a dynamic picture emerges that is dependent on the protonation state of Glu325. A protonated Glu325 coordinates strongly to Tyr236 and His322, and is separated from Arg302 (Figure 7C). The deprotonated Glu325, however, interacts strongly with Arg302 and His322 is forced from its original solvation shell and now interacts with Glu269 of the sugar-binding site (Figure 7D). In contrast to Glu325, the pKa values of all other crucial amino acid residues remain close to the initial values throughout all simulations (Figure S7).
Figure 7.
Structural rearrangements in the H+ translocation site. (A) Inter-atomic distances between Arg302-Glu325 (red) and calculated Glu325 pKa (black) for the E325(H) and E325(−) 1 simulations, respectively. (B) Arg302-Asp240 inter-atomic distances for the E325(H) (orange) and E325(−) 1 (blue) simulations, respectively. (C–D) Structural arrangement in the H+ translocation site visualized by last ns averages from the E325(H) and E325(−) 1 simulations, respectively. See also Figure S6–S7.
Hydration and protein-lipid dynamics
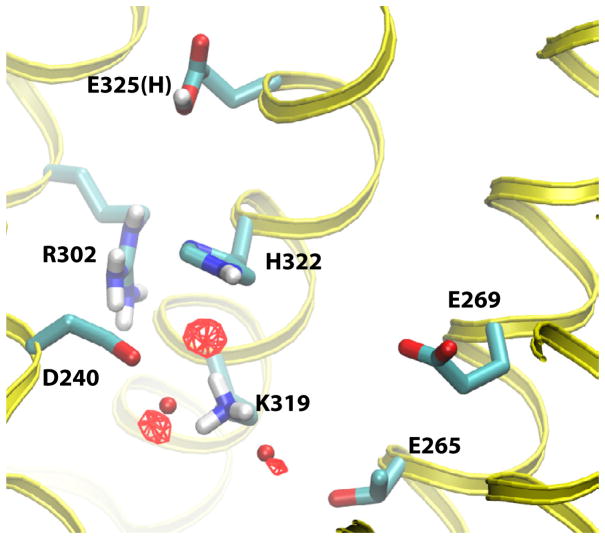
To determine whether water molecules were part of the proposed connection between the H+-translocating and sugar-binding sites, isodensity surfaces based on the presence of water oxygens in each frame of the trajectory, were calculated from the MD trajectories. In principle, high-occupancy isodensity surfaces indicate preferred water locations, much like water occupancies in a crystal structure. Although no densities were observed, even at low-level occupancies in the E325(−) trajectories, three distinct high-occupancy sites emerged from the E325(H) trajectory (Figure 8). Two of these sites closely correspond to positions at which electron density was observed in the LacY crystal structure (Smirnova et al., 2009), providing further evidence that these correspond to preferred water locations. These water molecules were situated in the H+-translocation site, between the Asp240-Lys319 charge-pair and between Lys319-Thr265. Furthermore, a third water pocket was identified that filled the cavity between Lys319 and His322 (Figure 8).
Figure 8.
Water sites in protonated LacY. Isodensity surfaces (red wireframe) of water molecules depicted at 85% occupancies in the H+ translocating site of protonated LacY (E325(H) simulation). The red licorice spheres correspond to oxygen positions of crystal waters.
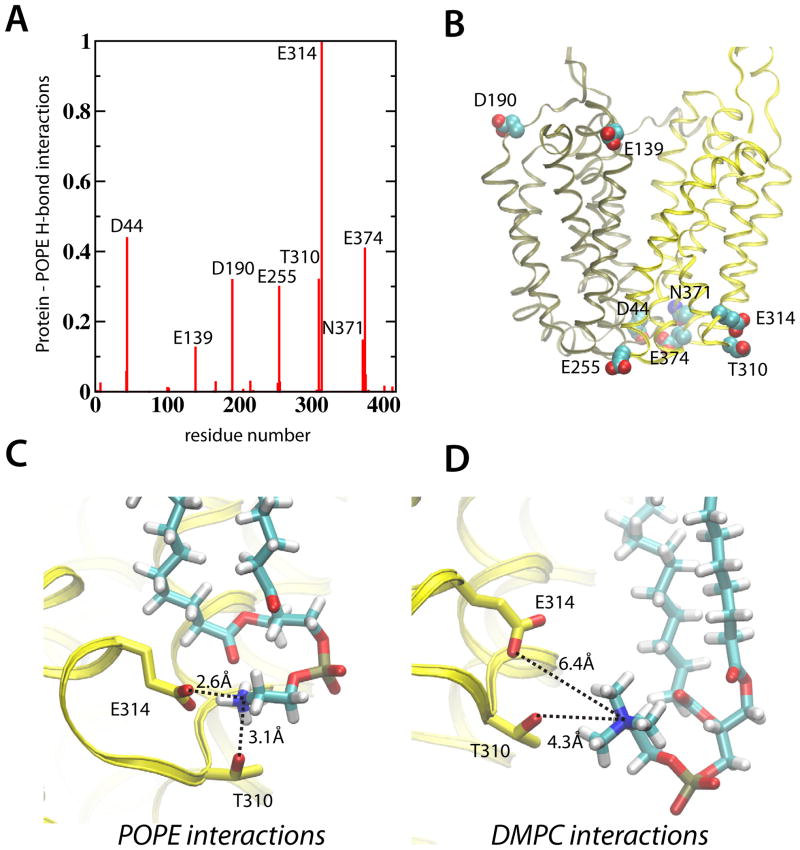
The main anchor points between the protein and POPE lipid headgroups were identified by counting protein residues within 3.5 Å and an 40 degree angle from the lipidic NH3 group in the E325(−) 1 simulation (Figure 9A). The eight most prevalent anchoring residues were found on both the cytoplasmic and periplasmic parts of LacY (Figure 9B). Visual inspection showed close H-bonding interactions between these anchor points and surrounding lipid headgroups (Figure 9C). In contrast, the same anchor points were uncoupled from the protein and specific H-bonds were broken (Figure 9D). In addition to effects in the lipid headgroup region, the interior part of LacY collapses in DMPC lipids. This can be seen as a reduced pore radius from the extracellular side towards the bilayer center (−10 < Å < 0, Figure 3D).
Figure 9.
Lipid-protein interaction points for the POPE and DMPC lipid bilayers. (A) The relative number of H-bonds between POPE amines (N–H) and protein sidechain donors. A hydrogen bond was considered present for donor-acceptor distances within 3.5 Å and acceptor-H-donor angles greater than 140 degrees. The positions of the eight most lipid-interacting amino acids are shown as van der Waal residues on LacY (B). Detailed interactions between the strongest POPE interacting residues (T310 and E314) in POPE (C) and DMPC (D) lipids.
Discussion
Deprotonation of an irreplaceable glutamic acid residue (Glu325), located in helix X and a component of the H+ binding site of LacY, has been suggested to trigger the transition between inward- and outward-facing conformations following release of sugar. This structural transition is hypothetically linked to simultaneous closure of the cytoplasmic cavity. To identify structural dynamics elicited by deprotonating apo LacY, we compared simulations of protonated and unprotonated Glu325, respectively. Deprotonation of Glu325 has been suggested to involve a decrease in pKa caused either by Arg302 approximating Glu325 (Sahin-Tóth and Kaback, 2001) or by exposure of Glu325 to solvent (Kaback, 2005). In two out of three simulations of the deprotonated Glu325, we observed the predicted pKa of Glu325 to drop as a Glu325-Arg302 salt-bridge was established (Figure 7 and S6). Thus, we observed for the first time the structural dynamics at atomic resolution involved in triggering the inward-to-outward transition of the LacY symporter. The restructuring of the H-bond/salt-bridge complex following deprotonation involved Arg302-Asp240 salt-bridge dynamics (Figure 7B) and resulted in bringing sites of H+ translocation and sugar binding into close proximity (Figure 2 and 7C–D). In contrast, we observed significant structural stability in the E325(H) simulation.
Sidechain dynamics can be viewed in light of mutational experiments, which have identified Asp240 as sensitive toward changes in the nature of the sidechain (Sahin-Tóth and Kaback, 1993). For example, a sidechain extension at position 240 with Glu or carboxymethyl-Cys inactivated the protein, which we interpret as a consequence of strengthening the interaction to Arg302 (by placing the negative charge closer to this residue). The tight Asp240-Arg302 interaction presumably prevents Arg302 from interacting with Glu325 and, hence, arrests reaction dynamics by hindering Glu325 deprotonation. Moreover, changing the nearby Lys319 into Arg rescued activity. In this case, the sidechain size might permit the positive charge to interact more closely with Asp240, and thereby to disrupt the Asp240-Arg302 interaction. Transport is also abolished when Asp240 and Lys319 are reversed (Sahin-Tóth et al., 1992) or replaced with Cys and cross-linked (Zhang et al., 2002). In other words, both the structural dynamics revealed by the simulations and the experimental findings suggest that transient interactions between Asp240, Lys319 and Arg302 may result in deprotonation of Glu325, which in turn result in enhancing the connection between the H+-binding site (i.e., His322) and the sugar-binding site (i.e., Glu269).
Structural rearrangements resulting from deprotonating Glu325 were confined to the H+-translocation and sugar-binding sites, while residues not directly involved in the proposed mechanism (i.e., where mutagenesis had little or no effect on activity) remained largely unchanged. For example, the Asp237-Lys358 salt-bridge has been shown to be involved specifically in insertion of LacY into the membrane, rather than participating in the symport mechanism (Dunten et al., 1993). This was reflected in the simulations where residues Asp237 (helix VII) and Lys358 (helix XI) interacted via a salt-bridge that stayed intact (Figure S3). As concluded from extensive mutagenesis studies on LacY (Frillingos et al., 1998), a limited number of residues appear to be critical for a series of structural events leading to a change in the orientation of the cavity from one side of the membrane to the other. This view is consistent with our simulations.
In addition, large-scale structural changes occurred on the cytoplasmic side of LacY in the deprotonated systems, consistent with the idea that cytoplasmic closure initiates the inward-to-outward facing transition. Specifically, we observed a capping movement of helix IV, stretching over the cytoplasmic cleft (Figure 3), as expected from experimental observations (Figure 4–5). Tilting of helix IV in the E325(−) simulations was shown to be governed by the Arg144-Glu126 salt-bridge; a weakened salt-bridge resulted in intermediate cytoplasmic closure, while a full disruption closed the cytoplasmic opening completely (Figure 2, S2 and S5), almost twice the movement recently measured by Pendse et al. (Pendse et al., 2010). The structural flexibility of helix IV can be explained by the fact that Glu126 is situated on helix IV and in the absence of a stabilizing Arg144-Glu126 salt-bridge, helix IV kinks over its mid-plane proline (Pro123) (Figure 2). The nature of the cytoplasmic capping event was predicted by an outward-facing model of LacY based on inverted-topology repeat swapping (Radestock and Forrest, 2011), where the periplasmic opening hinged over Pro28. The corresponding cytoplasmic hinge was predicted to be Pro123, which we thus validate in this work. Curiously, tilting of helix IV was found to coincide temporally with structural rearrangements as far away as the H+ translocating site, which contains unprotonated Glu325 (compare for instance Figure 2B and 5B at 60 ns). These simulations illustrate how LacY, already destabilized by substrate release, might utilize a deprotonation event to trigger a structural cascade leading ultimately to large-scale conformational changes in the cytoplasmic region.
Structural waters located within the H-bond/salt-bridge complex in the H+ translocating site have been suggested to participate in H+ binding as hydronium ion intermediates (Smirnova et al., 2009). We found three high-occupancy water pockets in the protonated state of LacY (Figure 8), and these sites disappeared upon deprotonation. Two of these water pockets correspond to identified crystal water locations, suggesting that water molecules are part of the symport mechanism and brings stability to the protonated state of LacY. However, the exact role played by water molecules remains unclear.
Despite a number of experimental studies, the functional role of the surrounding lipids is not well understood. In vitro transport assays recover lower transport rates of LacY in PC relative to PE lipids (Bogdanov et al., 2002). In support of this observation, the simulation of deprotonated LacY in DMPC lipids showed an almost static structure, not engaged in the sidechain dynamics and conformational changes displayed by the exact same system in POPE lipids (Figure 2–3 and 6). By determining and visually inspecting protein-lipid anchor points it was clear that DMPC headgroups were detached from protein interaction points (Figure 9). Our results suggest that LacY must be tightly connected to surrounding lipid headgroups to display structural dynamics necessary for function, while a protein disconnected from lipid headgroups appears static and presumably unable to meet the dynamic demands of transport. The importance of protein-lipid hydrogen-bond interactions have emerged from earlier MD simulation studies of membrane proteins (Bondar et al., 2009). In addition, we observe a unique collapse of the interior of LacY in the central region of DMPC acyl chains (Figure 3D). This is in accordance with the fact that he molecular basis for lipid requirement of LacY cannot be solely ascribed to the nature of the lipid headgroups, but also depends on more complex physicochemical properties of the bilayer (Bogdanov et al., 2010).
To put our results into a more general perspective of MFS transport, Glu325 is absolutely conserved among prokaryotic oligosaccharide/H+ symporters, and the corresponding position in eukaryotic LacY homologs is occupied by a threonine (Kasho et al., 2006). Furthermore, protonation of a glutamic acid (Glu135) in the recently crystallized outward-facing state of the fucose transporter, was suggested to trigger an outward-to-inward conformational switch (Dang et al., 2010). It seems as protonation/de-protonation events are central to the access-alternating dynamics in MFS transporters. To obtain further structural support for this hypothesis, we performed multiple sequence alignments of all structurally determined MFS transporters and discovered that conserved, protonation-sensitive amino acid residues are found within the same central region (Figure S10). This indicates that structural transitions between principal MFS states might be governed by similar protonation/deprotonation events as for LacY. We also note that mutational experiments of the sucrose/H+ transporter (CscB) resulted in very similar phenotypic effects as for LacY (Vadyvaloo et al., 2006), which suggests that MFS transporters might follow similar kinetic steps. In principle, one can use our present approach of contrasting MD simulations to identify the complex H-bond/salt-bridge networks linking the deprotonation event to large-scale conformational changes in other MFS transporters. Once the simulations, taking hydration effects into account, have established the general hypothesis of how residues are interconnected, experimental evaluation of carefully selected mutants can commence.
Experimental Procedures
Building the system
We performed a series of fully atomistic MD simulations of lactose permease (LacY) from E. coli inserted into a POPE bilayer in excess water (Table 1). The systems differed in the protonation state of Glu325 and the types of lipids used in the surrounding membrane (POPE or DMPC). The crystal structure of wild-type, substrate-free LacY, in an inward-facing conformation, and including residues Met1 to the carboxy-terminal Ala417 (Protein Data Bank ID 2V8N), was used as starting structure for the simulation. The initial position of LacY in the bilayer was achieved by aligning the centers-of-mass of the protein TM domain and the POPE bilayer, respectively, and removing lipids to avoid protein-lipid steric clashes. The systems were solvated by explicit water molecules and counter ions were added to achieve electrical neutrality.
MD simulation
The simulation system was relaxed using a 10,000-step conjugate-gradient energy minimization followed by gradual heating, from 0 to 310 K over 120 ps at constant temperature (310 K) and volume (NVT ensemble). Equilibrated positions of lipids, water molecules and the protein were obtained by a series of consecutive 1 ns simulations, where the harmonic restraints on these groups were successively released at constant temperature (310 K) and pressure (1 atm) (NPT ensemble). The MD simulations were run with the NAMD 2.7 software package (Phillips et al., 2005). The CHARMM22 and CHARMM36 force fields (MacKerell et al., 1998; Klauda et al., 2010) were used for protein and lipids, respectively, and the TIP3P model was used for the water molecules (Jorgensen et al., 1983). A reversible multiple time step algorithm (Grubmüller et al., 1991) was used to integrate the equations of motion with time steps of 1 fs for bonded forces, 2 fs for short-range, non-bonded forces, and 4 fs for long-range, electrostatic forces. The smooth particle mesh Ewald method (Darden et al., 1993; Essmann et al., 1995) was used to calculate electrostatic interactions. The short-range interactions were cut off at 12 Å. All bond lengths involving hydrogen atoms were held fixed using the SHAKE (Ryckaert et al., 1977) and SETTLE (Miyamoto and Kollman, 1992) algorithms. A Langevin dynamics scheme was used for thermostating. Nosé-Hoover-Langevin pistons were used for pressure control (Martyna et al., 1994; Feller et al., 1995). Molecular graphics and simulation analyses were generated with the VMD 1.8.7 software package (Humphrey et al., 1996). All alignments between different LacY structures were based on the TM region defined by residues 7–38, 42–71, 74–100, 104–136, 140–164, 166–186, 221–248, 253–286, 288–307, 311–341, 345–376 and 378–399. Predictions of pKa values were performed using the PROPKA3.1 (Olsson et al., 2011).
Supplementary Material
Highlights.
Deprotonation of Glu325 brings H+ translocation and sugar binding sites together
Deprotonation of Glu325 closes the internal water-filled cytoplasmic cavity
Deprotonated LacY inserted into DMPC lipids shows no structural rearrangements
The structural changes show remarkable similarities to experimental observations
Acknowledgments
The authors are deeply indebted to Irina Smirnova and Vladimir Kasho for many stimulating discussions and for critically reading the manuscript. The research was supported in part by NIH grants GM074637 to SHW; GM086685 to SHW and DJT; and DK051131, DK069463, GM073210, and GM074929 to HRK. The research was also supported by NSF grants 0450970 to HRK and CHE-0750175 to DJT. Magnus Andersson was supported in part by a Senior Postdoctoral Fellowship from the Institute of Complex Adaptive Matter supported in part by the National Science Foundation. A-NB was supported in part by Marie Curie International Reintegration Award IRG276920/Biol-Transp-Comput.
Footnotes
Publisher's Disclaimer: This is a PDF file of an unedited manuscript that has been accepted for publication. As a service to our customers we are providing this early version of the manuscript. The manuscript will undergo copyediting, typesetting, and review of the resulting proof before it is published in its final citable form. Please note that during the production process errors may be discovered which could affect the content, and all legal disclaimers that apply to the journal pertain.
References
- Abramson J, Smirnova I, Kasho V, Verner G, Kaback HR, Iwata S. Structure and mechanism of the lactose permease of Escherichia coli. Science. 2003;301:610–615. doi: 10.1126/science.1088196. [DOI] [PubMed] [Google Scholar]
- Baker J, Wright SH, Tama F. Simulations of substrate transport in the multidrug transporter EmrD. Proteins. 2012;80:1620–1632. doi: 10.1002/prot.24056. [DOI] [PMC free article] [PubMed] [Google Scholar]
- Bogdanov M, Heacock P, Guan Z, Dowhan W. Plasticity of lipid-protein interactions in the function and topogenesis of the membrane protein lactose permease from Escherichia coli. Proc Natl Acad Sci USA. 2010;107:15057–15062. doi: 10.1073/pnas.1006286107. [DOI] [PMC free article] [PubMed] [Google Scholar]
- Bogdanov M, Heacock PN, Dowhan W. A polytopic membrane protein displays a reversible topology dependent on membrane lipid composition. EMBO J. 2002;21:2107–2116. doi: 10.1093/emboj/21.9.2107. [DOI] [PMC free article] [PubMed] [Google Scholar]
- Bondar AN, del Val C, White SH. Rhomboid protease dynamics and lipid interactions. Structure. 2009;17:395–405. doi: 10.1016/j.str.2008.12.017. [DOI] [PMC free article] [PubMed] [Google Scholar]
- Chaptal V, Kwon S, Sawaya MR, Guan L, Kaback HR, Abramson J. Crystal structure of lactose permease in complex with an affinity inactivator yeilds unique insight into sugar recognition. Proc Natl Acad Sci USA. 2011;108:9361–9366. doi: 10.1073/pnas.1105687108. [DOI] [PMC free article] [PubMed] [Google Scholar]
- Dang S, Sun L, Huang Y, Lu F, Liu Y, Gong H, Wang J, Yan N. Sructure of a fucose transporter in an outward-open conformation. Nature. 2010;467:734–738. doi: 10.1038/nature09406. [DOI] [PubMed] [Google Scholar]
- Darden T, York D, Pedersen L. Particle mesh Ewald: An N•log(N) method for Ewald sums in large systems. J Chem Phys. 1993;98:10089–10092. [Google Scholar]
- Dunten RL, Sahin-Tóth M, Kaback HR. Role of the charge pair aspartic acid-237-lysine-358 in the lactose permease of Escherichia coli. Biochemistry. 1993;32:3139–3145. doi: 10.1021/bi00063a028. [DOI] [PubMed] [Google Scholar]
- Enkavi G, Tajkhorshid E. Simulation of spontaneous substrate binding revealing the binding pathway and mechanism and initial conformational response of GlpT. Biochemistry. 2010;49:1105–1114. doi: 10.1021/bi901412a. [DOI] [PMC free article] [PubMed] [Google Scholar]
- Essmann U, Perera L, Berkowitz ML, Darden T, Lee H, Pedersen LG. A smooth particle mesh Ewald method. J Chem Phys. 1995;103:8577–8593. [Google Scholar]
- Feller SE, Zhang Y, Pastor RW, Brooks BR. Constant pressure molecular dynamics simulation: The Langevin piston method. J Chem Phys. 1995;103:4613–4621. [Google Scholar]
- Frillingos S, Gonzalez A, Kaback HR. Cysteine-scanning mutagenesis of helix IV and the adjoining loops in the lactose permease of Escherichia coli: Glu126 and Arg 144 are essential. Biochemistry. 1997;36:14284–14290. doi: 10.1021/bi972314d. [DOI] [PubMed] [Google Scholar]
- Frillingos S, Sahin-Tóth M, Wu J, Kaback HR. Cys-scanning mutagenesis: a novel approach to structure-function relationships in polytopic membrane proteins. FASEB J. 1998;12:1281–1299. doi: 10.1096/fasebj.12.13.1281. [DOI] [PubMed] [Google Scholar]
- Garcia-Celma JJ, Smirnova IN, Kaback HR, Fendler K. Electrophysiological characterization of LacY. Proc Natl Acad Sci U S A. 2009;106:7373–7378. doi: 10.1073/pnas.0902471106. [DOI] [PMC free article] [PubMed] [Google Scholar]
- Grubmüller H, Heller H, Windemuth A, Schulten K. Generalized Verlet algorithm for efficient molecular dynamics simulations with long-range interactions. Mol Simul. 1991;6:121–142. [Google Scholar]
- Guan L, Kaback HR. Lessons from lactose permease. Annu Rev Biophys Biomol Struc. 2006;35:67–91. doi: 10.1146/annurev.biophys.35.040405.102005. [DOI] [PMC free article] [PubMed] [Google Scholar]
- Guan L, Mirza O, Verner G, Iwata S, Kaback HR. Structural determination of wild-type lactose permease. Proc Natl Acad Sci USA. 2007;104:15294–15298. doi: 10.1073/pnas.0707688104. [DOI] [PMC free article] [PubMed] [Google Scholar]
- He MM, Kaback HR. Interaction between residues Glu269 (Helix VIII) and His322 (Helix X) of the lactose permease of Escherichia coli is essential for substrate binding. Biochemistry. 1997;36:13688–13692. doi: 10.1021/bi9715324. [DOI] [PubMed] [Google Scholar]
- Holyoake J, Sansom MSP. Conformational change in an MFS protein: MD simulations of LacY. Structure. 2007;15:873–884. doi: 10.1016/j.str.2007.06.004. [DOI] [PubMed] [Google Scholar]
- Humphrey W, Dalke W, Schulten K. VMD: Visual molecular dynamics. J Mol Graph. 1996;14:33–38. doi: 10.1016/0263-7855(96)00018-5. [DOI] [PubMed] [Google Scholar]
- Jardetzky O. Simple allosteric model for membrane pumps. Nature. 1966;211:969–970. doi: 10.1038/211969a0. [DOI] [PubMed] [Google Scholar]
- Jorgensen WL, Chandrasekhar J, Madura JD, Impey RW, Klein ML. Comparison of simple potential functions for simulating liquid water. J Chem Phys. 1983;79:926–935. [Google Scholar]
- Jung K, Jung H, Colacurcio P, Kaback HR. Role of glycine residues in the structure and function of lactose permease, an Escherichia coli membrane transport protein. Biochemistry. 1995;34:1030–1039. doi: 10.1021/bi00003a038. [DOI] [PubMed] [Google Scholar]
- Jung K, Jung H, Kaback HR. Dynamics of lactose permease of Escherichia coli determined by site-directed fluorescence labeling. Biochemistry. 1994;33:3980–3985. doi: 10.1021/bi00179a026. [DOI] [PubMed] [Google Scholar]
- Jung K, Jung H, Wu JH, Privé GG, Kaback HR. Use of site-directed fluorescence labeling to study proximity relationships in the lactose permease of Escherichia coli. Biochemistry. 1993;32:12273–12278. doi: 10.1021/bi00097a001. [DOI] [PubMed] [Google Scholar]
- Kaback HR. Structure and mechanism of the lactose permease. CR Biologies. 2005;328:557–567. doi: 10.1016/j.crvi.2005.03.008. [DOI] [PubMed] [Google Scholar]
- Kaback HR, Sahin-Tóth M, Weinglass AB. The kamikaze approach to membrane transport. Nature Rev Mol Cell Biol. 2001;2:610–620. doi: 10.1038/35085077. [DOI] [PubMed] [Google Scholar]
- Kasho VN, Smirnova IN, Kaback HR. Sequence alignment and homology threading reveals prokaryotic and eukaryotic proteins similar to lactose permease. J Mol Biol. 2006;358:1060–1070. doi: 10.1016/j.jmb.2006.02.049. [DOI] [PMC free article] [PubMed] [Google Scholar]
- Klauda JB, Venable RM, Freites JA, O’Connor JW, Tobias DJ, Mondragon-Ramirez C, Vorobyov I, MacKerell AD, Jr, Pastor RW. Update of the CHARMM all-atom additive force field for lipids: validation on six lipid types. J Phys Chem B. 2010;114:7830–7843. doi: 10.1021/jp101759q. [DOI] [PMC free article] [PubMed] [Google Scholar]
- le Coutre J, Narasimhan LR, Patel CK, Kaback HR. The lipid bilayer determines helical tilt angle and function in lactose permease of Escherichia coli. Proc Natl Acad Sci U S A. 1997;94:10167–10171. doi: 10.1073/pnas.94.19.10167. [DOI] [PMC free article] [PubMed] [Google Scholar]
- Liu Z, Madej MG, Kaback HR. Helix dynamics in LacY: Helices II and IV. J Mol Biol. 2010;396:617–626. doi: 10.1016/j.jmb.2009.12.044. [DOI] [PMC free article] [PubMed] [Google Scholar]
- MacKerell AD, Jr, Bashford D, Bellott M, Dunbrack RL, Jr, Evanseck JD, Field MJ, Fischer S, Gao J, Guo H, Ha S, et al. All-atom empirical potential for molecular modeling and dynamics studies of proteins. J Phys Chem B. 1998;102:3586–3616. doi: 10.1021/jp973084f. [DOI] [PubMed] [Google Scholar]
- Martyna GJ, Tobias DJ, Klein ML. Constant-pressure molecular-dynamics algorithms. J Chem Phys. 1994;101:4177–4189. [Google Scholar]
- Mirza O, Guan L, Verner G, Iwata S, Kaback HR. Structural evidence for induced fit and a mechanism for sugar/H+ symport in LacY. EMBO J. 2006;25:1177–1183. doi: 10.1038/sj.emboj.7601028. [DOI] [PMC free article] [PubMed] [Google Scholar]
- Miyamoto S, Kollman P. An analytical version of the SHAKE and RATTLE algorithm for rigid water models. J Comput Chem. 1992;13:952–962. [Google Scholar]
- Nie Y, Kaback HR. Sugar binding induces the same global conformational change in purified LacY as in the native bacterial membrane. Proc Natl Acad Sci U S A. 2010;107:9903–9908. doi: 10.1073/pnas.1004515107. [DOI] [PMC free article] [PubMed] [Google Scholar]
- Olsson MHM, Sondergaard CR, Rostkowski M, Jensen JH. PROPKA3: Consistent Treatment of Internal and Surface Residues in Empirical pKa Predictions. J Chem Theor Comput. 2011;7:525–537. doi: 10.1021/ct100578z. [DOI] [PubMed] [Google Scholar]
- Pao SS, Paulsen IT, Saier MH., Jr Major facilitator superfamily. Microbiol Mol Biol Rev. 1998;62:1–34. doi: 10.1128/mmbr.62.1.1-34.1998. [DOI] [PMC free article] [PubMed] [Google Scholar]
- Pendse PY, Brooks BR, Klauda JB. Probing the periplasmic-open state of lactose permease in response to sugar binding and proton translocation. J Mol Biol. 2010;404:506–521. doi: 10.1016/j.jmb.2010.09.045. [DOI] [PMC free article] [PubMed] [Google Scholar]
- Phillips JC, Braun B, Wang W, Gumbart J, Tajkhorshid E, Villa E, Chipot C, Skeel RD, Kalé L, Schulten K. Scalable molecular dynamics with NAMD. J Comput Chem. 2005;26:1781–1802. doi: 10.1002/jcc.20289. [DOI] [PMC free article] [PubMed] [Google Scholar]
- Radestock S, Forrest LR. The alternating-access mechanism of MFS transporters arises from inverted-topology repeats. J Mol Biol. 2011;407:698–715. doi: 10.1016/j.jmb.2011.02.008. [DOI] [PubMed] [Google Scholar]
- Ryckaert JP, Ciccotti G, Berendsen HJC. Numerical integration of the Cartesian equations of motion of a system with constraints: Molecular dynamics of n-alkanes. J Comput Phys. 1977;23:327–341. [Google Scholar]
- Sahin-Tóth M, Dunten RL, Gonzalez A, Kaback HR. Functional interactions between putative intramembrane charged residues in the lactose permease of Escherichia coli. Proc Natl Acad Sci USA. 1992;89:10547–10551. doi: 10.1073/pnas.89.21.10547. [DOI] [PMC free article] [PubMed] [Google Scholar]
- Sahin-Tóth M, Kaback HR. Cysteine scanning mutagenesis of putative transmembrane helices IX and X in the lactose permease of Escherichia coli. Protein Sci. 1993;2:1024–1033. doi: 10.1002/pro.5560020615. [DOI] [PMC free article] [PubMed] [Google Scholar]
- Sahin-Tóth M, Kaback HR. Arg-302 facilitates deprotonation of Glu-325 in the transport mechanism of the lactose permease from Escherichia coli. Proc Natl Acad Sci USA. 2001;98:6068–6073. doi: 10.1073/pnas.111139698. [DOI] [PMC free article] [PubMed] [Google Scholar]
- Smart OS, Goodfellow JM, Wallace BA. The pore dimensions of gramicidin A. Biophys J. 1993;65:2455–2460. doi: 10.1016/S0006-3495(93)81293-1. [DOI] [PMC free article] [PubMed] [Google Scholar]
- Smirnova I, Kasho V, Choe JY, Altenbach C, Hubbell WL, Kaback HR. Sugar binding induces an outward facing conformation of LacY. Proc Natl Acad Sci USA. 2007;104:16504–16509. doi: 10.1073/pnas.0708258104. [DOI] [PMC free article] [PubMed] [Google Scholar]
- Smirnova I, Kasho V, Sugihara J, Choe JY, Kaback HR. Residues in the H+ translocation site define the pKa for sugar binding to LacY. Biochemistry. 2009;48:8852–8860. doi: 10.1021/bi9011918. [DOI] [PMC free article] [PubMed] [Google Scholar]
- Smirnova IN, Kaback HR. A mutation in the lactose permease of Escherichi coli that decreases conformational flexibility and increases protein stability. Biochemistry. 2003;42:3025–3031. doi: 10.1021/bi027329c. [DOI] [PubMed] [Google Scholar]
- Sorgen PL, Hu YL, Guan L, Kaback HR, Girvin ME. An approach to membrane protein structure without crystals. Proc Natl Acad Sci USA. 2002;99:14037–14040. doi: 10.1073/pnas.182552199. [DOI] [PMC free article] [PubMed] [Google Scholar]
- Ujwal ML, Sahin-Tóth M, Persson B, Kaback HR. Role of glutamate-269 in lactose permease of Escherichia coli. Mol Membr Biol. 1994;11:9–16. doi: 10.3109/09687689409161024. [DOI] [PubMed] [Google Scholar]
- Vadyvaloo V, Smirnova IN, Kasho VN, Kaback HR. Conservation of residues involved in sugar/H+ symport by the sucrose permease of Escherichia coli relative to lactose permease. J Mol Biol. 2006;358:1051–1059. doi: 10.1016/j.jmb.2006.02.050. [DOI] [PMC free article] [PubMed] [Google Scholar]
- Wu JH, Hardy D, Kaback HR. Transmembrane helix tilting and ligand-induced conformational changes in the lactose permease determined by site-directed chemical crosslinking in situ. J Mol Biol. 1998;282:959–967. doi: 10.1006/jmbi.1998.2065. [DOI] [PubMed] [Google Scholar]
- Yin Y, Jensen MØ, Tajkhorshid E, Schulten K. Sugar binding and protein conformational changes in lactose permease. Biophys J. 2006;91:3972–3985. doi: 10.1529/biophysj.106.085993. [DOI] [PMC free article] [PubMed] [Google Scholar]
- Zhang W, Guan L, Kaback HR. Helices VII and X in the lactose permease of Escherichia coli: Proximity and ligand-induced distance changes. J Mol Biol. 2002;315:53–62. doi: 10.1006/jmbi.2001.5206. [DOI] [PubMed] [Google Scholar]
Associated Data
This section collects any data citations, data availability statements, or supplementary materials included in this article.


