

Abstract
Objective
We aim to describe the magnitude of socioeconomic inequalities in tuberculosis (TB) mortality by level of education in male, female, urban, and rural populations in several European countries.
Design
Data were obtained from the Eurothine project covering 16 populations between 1990 and 2003. Age- and sex-standardized mortality rates, the Relative Index of Inequality, and the slope index of inequality were used to assess educational inequalities.
Results
The number of TB deaths reported was 8530, with a death rate of 3 per 100 000 per year, of which 73% were males. Educational inequalities in TB mortality were present in all European populations. Inequalities in TB mortality were larger than in total mortality. Relative and absolute inequalities were large in Eastern Europe, and Baltic countries but relatively small in Southern countries and in Norway, Finland, and Sweden. Mortality inequalities were observed among both men and women, and in both rural and urban populations.
Conclusions
Socioeconomic inequalities in TB mortality exist in all European countries. Firm political commitment is required to reduce inequalities in the social determinants of TB incidence. Targeted public health measures are called for to improve vulnerable groups’ access to treatment and thereby reduce TB mortality.
Keywords: Tuberculosis, mortality, Europe, education, social inequalities
Keywords: Adult, Age Distribution, Age Factors, Aged, Educational Status, Europe, epidemiology, Female, Humans, Incidence, Linear Models, Male, Middle Aged, Risk Assessment, Risk Factors, Rural Health, statistics & numerical data, Sex Distribution, Sex Factors, Time Factors, Tuberculosis, mortality, Urban Health, statistics & numerical data, Vulnerable Populations, statistics & numerical data
Introduction
Tuberculosis (TB) has deep social and economic roots;[1] it is widespread; currently one-third of the global population is infected;[2] and although treatment of TB is feasible and effective, active TB is lethal in more than 50% of cases when left untreated.[3] In 2004, TB mortality accounted for 1.6 million deaths, mostly in developing countries.[2] Although the disease appeared to have been controlled by the 1980s, TB incidence started to increase again in industrialized countries around 1985.[4] Several interrelated forces drove this resurgence, including increases in prison populations, homelessness, intravenous drug use, and immigration from countries where TB continued to be endemic. Above all, the decline in TB control activities and the human immunodeficiency virus (HIV) epidemic were two major factors that worked together to fuel the re-emergence of TB.[5]
Increasing TB incidence rates in the 1990s were reported in the former Soviet Union, former Yugoslavia, and some other countries in Eastern Europe. The lowest incidence in Europe is found in Southern countries and Scandinavia.[6] Increased unemployment, homelessness, alcoholism, HIV transmission, and drug resistance, boost the incidence of TB.[7,8]
Socioeconomic inequalities in mortality are omnipresent in Europe. People living in disadvantaged circumstances are known to have poorer health, more disability, and shorter lives than those who are more affluent.[9,10] The association between economic deprivation and TB is well established and widespread.[11–13] In our study we chose education as the indicator of socioeconomic position because of data availability. The widening gap between the health of lower and higher socioeconomic groups has contributed to an increased awareness of health inequalities by governments and policymakers.[14] Socioeconomic inequalities have widened in Eastern Europe in particular[15].
The objective of this study was to estimate the magnitude of educational inequalities in TB mortality in different European countries with data from 1990 to 2003, and to investigate whether inequalities differ among urban and rural populations.
Material and methods
Data and population
This epidemiological study used the Eurothine project mortality data[16] which is a collection of datasets with information on cause-specific mortality by socioeconomic position among people older than 30 years of age in several European countries. Mortality data from populations with information about TB and educational inequalities were obtained for this study (Table 1). All data covered entire national populations with the exceptions of Italy and Spain.
Table 1.
Countries included in the analysis and sources of data.
| Region | Area | Type of study | Years Covered | Person-years of follow-up | No. of total deaths | No. of TB deaths | Educational level (% of population in Low Educational group) |
|---|---|---|---|---|---|---|---|
| Southern | BAR | Longitudinal | 1992–2001 | 8151810 | 81588 | 280 | 73.4 |
| MDR | Longitudinal | 1996–1997 | 3663333 | 32269 | 70 | 67.0 | |
| BSQ | Longitudinal | 1996–2001 | 6098458 | 44960 | 93 | 72.2 | |
| TUR | Longitudinal | 1991–2001 | 4873109 | 50621 | 72 | 73.5 | |
| Nordic | DNK | Longitudinal | 1996–2000 | 14619327 | 183284 | 154 | 51.3 |
| NRW | Longitudinal | 1990–2000 | 19956767 | 213022 | 349 | 37.0 | |
| FIN | Longitudinal | 1990–2000 | 25874201 | 270232 | 746 | 53.3 | |
| SWE | Longitudinal | 1991–2000 | 43042216 | 393038 | 508 | 41.1 | |
| Central | SWZ | Longitudinal | 1990–2000 | 27910587 | 255275 | 253 | 29.7 |
| Western | BEL | Longitudinal | 1991–1995 | 24861015 | 283349 | 379 | 65.9 |
| Central | HUN | CS unlinked | 1999–2002 | 21031348 | 368029 | 1262 | 64.3 |
| Eastern | POL | CS unlinked | 2001–2003 | 54883245 | 717743 | 2373 | 56.9 |
| SLO | Longitudinal | 1991–2000 | 9647452 | 101557 | 215 | 49.8 | |
| CZR | CS unlinked | 1999–2003 | 25761450 | 344973 | 385 | 63.5 | |
| Baltic | EST | CS unlinked | 1998–2002 | 3435255 | 60873 | 458 | 30.1 |
| LIT | CS unlinked | 2000–2002 | 5156703 | 78399 | 933 | 30.7 |
CS Cross-sectional
Information on mortality included a total of 3.5 million deaths among more than 51 million European citizens from 16 populations between 1990 and 2003. Mortality data came from cross-sectional unlinked mortality studies, in which information on socioeconomic data was derived separately from death certificates and census records or from longitudinal follow-up studies in which socioeconomic position, as determined during a census, has been linked to mortality. The analysis of data from longitudinal studies with about 10 years of follow-up was performed among people aged 30 to 74 years at baseline. Since the designs are different among countries, to approximate all populations in terms of average age at death, we performed our analysis on slightly older age groups (35–79 years) for all studies with cross-sectional design and for very short follow-up longitudinal studies; for longitudinal studies with a 5-year follow up period we chose people aged 30 to 79 years.
Cause of death was classified using the International Classification of Diseases. Most countries used the 9th version until 1996 and used the 10th version thereafter; exceptions are the following; Slovenia used the 9th version until 1997; the Spanish regions until 1999; Turin until 2001; and Switzerland, which used the 8th version until 1995 and the 10th version thereafter. All deaths reported as TB from any location (ICD 8 CM 10–18; ICD 9 CM 010-018, 137; ICD 10 CM A15-19, B90) in this database were obtained.
We used the highest acquired educational level as a measure of socioeconomic position. Education was categorized into four classes corresponding to the International Standard Classification of Education (ISCED):[17] (1) no education or primary education, (2) lower secondary education, (3) upper secondary education, and (4) post-secondary and tertiary education. Information on education was missing for 1.2% of the population, on average; these subjects were excluded from the analysis.
The place of residence measures the degree of urbanization of the residence area of the study population. It is based on country-specific measures of urbanization, such as the population size or the population density of the municipality where persons live. Information for this variable was only available for seven countries.
The linkage between census data and mortality registries was achieved for more than 96% of all deceased persons in all populations except Madrid (70%), the Basque Country (93%), and Barcelona (94.5%). Evaluations in Madrid and Barcelona observed no variation in this percentage according to age, sex, or educational position. Therefore, estimates of relative inequalities in mortality are not likely to be biased to a significant extent. In addition, we adjusted the estimates of absolute mortality rates by increasing these with correction factors (1/0.70, 1/0.93, and 1/0.945 respectively).
Data Analysis
We calculated absolute and relative levels of educational inequality using age- and sex-standardized mortality rates (ASMR) and the relative index of inequality (RII), respectively. We computed ASMR using the direct method with 5 years age groups, using the total population from all countries as a standard. The two lowest and two highest categories were combined together, respectively, into two broad groups to obtain stable ASMR estimates.
To estimate the extent of inequalities separately across all four educational levels, we computed the RII, a regression-based measure that takes into account the relative position of each educational group within the hierarchy of all educational groups before it is related to health indicators by means of regression. The RII results in a ratio that can be described as mortality at the very bottom of the educational hierarchy compared to the very top of the hierarchy. A high score on the RII implies large inequalities in mortality across the educational hierarchy. One advantage of this index is that it can be applied comparably to all countries, provided that the educational classification is strictly hierarchical. For this paper, the RII was estimated using log linear regression with control for 5-year age group and gender. The regression model had a log link function and assumed a Poisson error distribution.
In addition to the relative measure of RII, we computed the SII (slope index of inequality), which is a measure of absolute difference between the predicted mortality rates at the lower end of the hierarchy and at the higher end of the hierarchy. The SII was derived from the RII and the mortality rate (MR) by the following formula:[18]
Statistical analyses were performed using the Statistical Package for Social Sciences (SPSS for Windows, version 16.0; Chicago, Illinois, USA). In all tests, the significance level used was p<0.05.
Results
The mean average age of all people in our study was 51 years and 47% (24 million) of the people in our study were male. A total of 8530 deaths due to TB were reported, resulting in a global rate of 3 deaths per 100,000 annually (Table 1). The average age of TB death was 61 years (SD 17.6). The TB death rate increased with age for every country (Figure 1), ranging from 0.2 deaths due to TB per 100,000 in the population between 30 and 34 years of age to 10.9 deaths per 100,000 in the population between 75 and 79 years of age. However, in Estonia and Lithuania rates were generally higher in all age groups, with no clear age-related pattern. In total, 73% of all TB deaths occurred in males.
Figure 1.
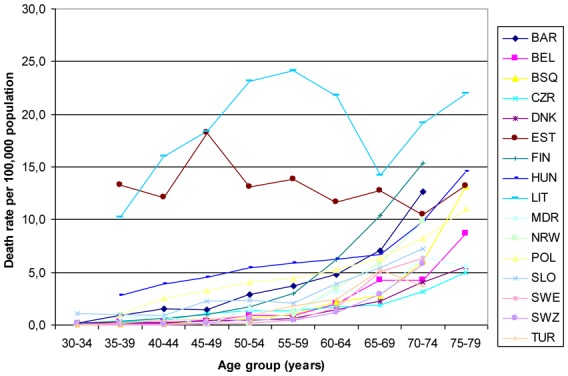
Age distribution of tuberculosis deaths.
Relative educational inequalities in TB mortality were present in all European populations included in this study. In all populations, inequalities in TB mortality were larger than in total mortality, although they were not statistically significant in some Nordic and Southern countries (Table 2). The largest relative inequalities were observed in Eastern European populations, Baltic countries, and Denmark. The smallest differences were found in Nordic countries and in Belgium. In all cases, people with higher levels of education had lower mortality rates. The absolute size of educational inequalities in all TB mortality, as expressed by the SII, was highest in Lithuania (35.8 deaths per 100,000 person-years), followed by Estonia and Hungary (Figure 2). Whereas Denmark had large inequalities in relative sense, absolute differences in this country were small.
Table 2.
Age- and sex-standardized mortality rates (deaths per 100 000) and relative index of inequality.
| All-cause mortality | Tuberculosis | ||||||||||||
|---|---|---|---|---|---|---|---|---|---|---|---|---|---|
|
| |||||||||||||
| Region | Area | ASMR Total | ASMR | RII | 95% Confidence Interval | ASMR Total | ASMR | RII | 95% Confidence Interval | ||||
| Low education | High education | Low education | High education | ||||||||||
| Southern | BAR | 1011.4 | 1071.2 | 840.2 | 1.61 | 1.56 | 1.66 | 3.8 | 4.5 | 2.1 | 5.23 | 2.95 | 9.25 |
| MDR | 868.1 | 909.9 | 746.0 | 1.46 | 1.39 | 1.53 | 1.9 | 2.1 | 0.8 | 3.50 | 0.99 | 12.39 | |
| BSQ | 742.8 | 760.6 | 677.8 | 1.46 | 1.38 | 1.56 | 1.6 | 1.7 | 0.6 | 5.62 | 0.90 | 35.09 | |
| TUR | 1110.2 | 1163.8 | 928.3 | 1.50 | 1.45 | 1.55 | 1.5 | 1.7 | 0.6 | 3.69 | 1.33 | 10.26 | |
| Nordic | DNK | 1324.8 | 1461.9 | 1111.6 | 2.14 | 2.08 | 2.19 | 1.1 | 1.5 | 0.6 | 11.26 | 3.59 | 35.34 |
| NRW | 1144.1 | 1348.1 | 991.4 | 2.04 | 2.01 | 2.08 | 1.8 | 2.2 | 1.5 | 2.36 | 1.45 | 3.82 | |
| FIN | 1301.6 | 1429.4 | 1058.4 | 2.08 | 2.04 | 2.11 | 3.7 | 3.9 | 3.2 | 2.08 | 1.47 | 2.95 | |
| SWE | 939.5 | 1057.3 | 809.6 | 1.61 | 1.59 | 1.63 | 1.2 | 1.3 | 1.1 | 1.37 | 1.01 | 1.86 | |
| Central | SWZ | 1010.4 | 1242.8 | 900.2 | 1.91 | 1.87 | 1.94 | 1.0 | 1.5 | 0.8 | 3.42 | 2.08 | 5.63 |
| Western | BEL | 1175.3 | 1250.5 | 931.6 | 1.83 | 1.80 | 1.86 | 1.6 | 1.7 | 1.2 | 2.40 | 1.50 | 3.82 |
| Central | HUN | 1605.5 | 1874.3 | 1009.5 | 3.76 | 3.70 | 3.82 | 5.8 | 7.6 | 2.5 | 16.40 | 12.10 | 22.20 |
| Eastern | POL | 1289.8 | 1531.1 | 843.2 | 2.52 | 2.50 | 2.55 | 4.3 | 6.2 | 1.2 | 19.14 | 15.61 | 23.45 |
| SLO | 1382.6 | 1605.5 | 1158.7 | 2.03 | 1.98 | 2.08 | 2.7 | 4.4 | 1.5 | 7.66 | 4.40 | 13.34 | |
| CZR | 1243.5 | 1456.6 | 805.3 | 3.90 | 3.84 | 3.95 | 1.4 | 1.8 | 0.6 | 20.11 | 12.53 | 32.30 | |
| Baltic | EST | 1715.4 | 2202.7 | 1472.5 | 2.19 | 2.13 | 2.26 | 14.2 | 31.5 | 10.0 | 9.91 | 6.55 | 15.00 |
| LIT | 1490.6 | 2150.3 | 1158.1 | 2.08 | 1.69 | 2.56 | 19.1 | 54.4 | 10.2 | 30.33 | 21.43 | 42.95 | |
ASMR: Age and sex standardized mortality rates
RII: Relative Index of Inequality
Figure 2.
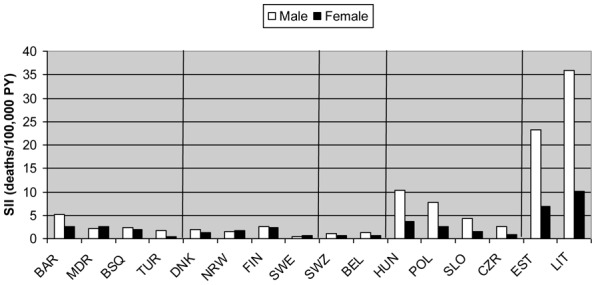
Absolute educational differences in tuberculosis mortality rates, expressed as the slope index of inequality (SII).
Since TB mortality in Baltic countries is greater for younger ages, we analyzed whether the large inequalities in TB mortality in these countries could be observed for both the older and the younger ages: for the youngest (35–49 years old), mortality rates in Estonia and Lithuania were much higher in the low educational level (44 and 73 deaths per 100,000, respectively) than in the high educational level (10 and 9 deaths per 100,000); this difference was smaller in the eldest Estonian and Lithuanian populations (65–79 years old): low educational level, 16 and 22 deaths per 100,000; and high educational level, 10 and 11 deaths per 100,000, respectively.
Some gender differences can be seen when the populations are stratified by gender, except in Hungary and the Czech Republic (Table 3). Overall TB mortality rates were much lower in women. Inequalities shown by the RII were generally higher in men (but not in all countries), although not statistically significant. Actually, mortality among highly educated men is similar to that observed among lower educated women.
Table 3.
Age-standardized mortality rates (deaths per 100 000) and relative index of inequality, with stratification by gender.
| Tuberculosis Male | Tuberculosis Female | ||||||||||||
|---|---|---|---|---|---|---|---|---|---|---|---|---|---|
|
| |||||||||||||
| Region | Area | AMR Total | ASMR | RII | 95% Confidence Interval | ASMR Total | AMR | RII | 95% Confidence Interval | ||||
| Low education | High education | Low education | High education | ||||||||||
| Southern | BAR | 6.4 | 7.6 | 3.8 | 4.67 | 2.54 | 8.58 | 1.5 | 1.7 | 0.5 | 11.40 | 2.02 | 64.26 |
| MDR | 2.5 | 2.6 | 1.7 | 1.73 | 0.45 | 6.69 | 1.4 | 1.7 | 0.0 | n.a. | n.a. | n.a. | |
| BSQ | 2.4 | 2.5 | 1.2 | 3.61 | 0.58 | 22.53 | 1.0 | 1.0 | 0.0 | n.a. | n.a. | n.a. | |
| TUR | 1.8 | 2.1 | 0.9 | 7.41 | 1.86 | 29.55 | 1.2 | 1.3 | 0.4 | 1.32 | 0.29 | 6.07 | |
| Nordic | DNK | 1.5 | 2.1 | 0.8 | 10.53 | 2.84 | 39.06 | 0.8 | 0.9 | 0.4 | 13.80 | 1.25 | 151.87 |
| NRW | 2.2 | 2.6 | 1.9 | 1.80 | 0.97 | 3.32 | 1.5 | 1.9 | 1.2 | 3.68 | 1.66 | 8.19 | |
| FIN | 4.4 | 4.8 | 4.2 | 1.95 | 1.26 | 3.02 | 3.0 | 3.1 | 2.3 | 2.24 | 1.25 | 4.03 | |
| SWE | 1.2 | 1.3 | 1.2 | 1.10 | 0.74 | 1.65 | 1.2 | 1.3 | 1.0 | 1.81 | 1.13 | 2.89 | |
| Central | SWZ | 1.4 | 2.2 | 1.1 | 3.75 | 2.09 | 6.73 | 0.7 | 0.8 | 0.6 | 2.80 | 1.09 | 7.19 |
| Western | BEL | 2.4 | 2.6 | 1.8 | 2.36 | 1.40 | 3.99 | 0.8 | 0.9 | 0.6 | 2.55 | 0.94 | 6.96 |
| Central | HUN | 9.7 | 12.8 | 3.8 | 20.47 | 14.50 | 28.88 | 2.4 | 3.1 | 1.3 | 7.18 | 3.76 | 13.71 |
| Eastern | POL | 7.5 | 10.8 | 1.9 | 20.47 | 16.36 | 25.64 | 1.5 | 2.1 | 0.5 | 13.56 | 8.31 | 22.11 |
| SLO | 4.1 | 7.1 | 2.1 | 10.03 | 5.31 | 18.93 | 1.5 | 1.9 | 1.0 | 2.90 | 0.94 | 9.00* | |
| CZR | 2.2 | 3.0 | 0.8 | 31.37 | 18.05 | 54.60 | 0.7 | 0.8 | 0.3 | 4.35 | 1.77 | 10.69 | |
| Baltic | EST | 25.8 | 51.3 | 18.1 | 9.25 | 5.91 | 14.50 | 3.9 | 13.9 | 2.8 | 15.56 | 5.15 | 47.04 |
| LIT | 34.3 | 93.8 | 17.8 | 33.55 | 22.92 | 49.11 | 5.6 | 19.4 | 3.5 | 17.17 | 7.32 | 40.25 | |
AMR: Age standardized mortality rates
RII: Relative Index of Inequality
n.a.: not applicable
In our study, 66% of the people were living in urban areas overall; the proportion of urban-dwelling participants ranged from 72% in Norway to 49% in Slovenia. There were no important differences regarding absolute level of mortality (Table 4). The global ASMR rates were similar between rural and urban populations. Large inequalities according to educational level existed in both in rural and urban areas. We found higher RII in all urban populations except those in Hungary and Slovenia; however, the differences in RII between urban and rural populations were not statistically significant.
Table 4.
Age- and sex-standardized tuberculosis mortality rates for rural and urban populations.
| Tuberculosis Rural | Tuberculosis Urban | ||||||||||||
|---|---|---|---|---|---|---|---|---|---|---|---|---|---|
|
| |||||||||||||
| Region | Country | ASMR Total | ASMR | RII | 95% Confidence Interval | ASMR Total | ASMR | RII | 95%Confidence Interval | ||||
| Low education | High education | Low education | High education | ||||||||||
| Nordic | NRW | 1.6 | 1.8 | 1.3 | 2.00 | 0.69 | 5.73 | 2.0 | 2.5 | 1.6 | 2.88 | 1.66 | 5.00 |
| FIN | 3.8 | 3.9 | 3.0 | 2.03 | 0.89 | 4.63 | 3.6 | 4.1 | 3.1 | 2.38 | 1.55 | 3.66 | |
| Central | HUN | 6.5 | 7.6 | 2.0 | 26.76 | 9.60 | 51.83 | 5.4 | 7.7 | 2.6 | 14.92 | 10.54 | 21.14 |
| Eastern | POL | 4.5 | 5.3 | 0.9 | 16.18 | 10.40 | 25.15 | 4.1 | 7.1 | 1.2 | 28.53 | 22.42 | 36.27 |
| SLO | 2.1 | 3.8 | 1.5 | 7.39 | 3.20 | 17.06 | 3.3 | 4.6 | 1.3 | 6.33 | 2.83 | 14.17 | |
| Baltic | EST | 12.2 | 20.4 | 7.4 | 7.31 | 3.19 | 16.78 | 15.5 | 70.3 | 11.5 | 25.15 | 12.15 | 54.11 |
| LIT | 23.5 | 48.8 | 12.8 | 19.39 | 10.78 | 34.85 | 16.7 | 60.6 | 9.4 | 40.41 | 25.76 | 60.64 | |
ASMR: Age and sex standardized mortality rates
RII: Relative Index of Inequality
Discussion
In total, 8530 TB deaths were reported, with a death rate of 3 per 100,000 per year, of which 73% of decedents were male. Educational inequalities in TB mortality were present in all European populations. Relative and absolute educational inequalities in TB mortality were large in Eastern Europe and Baltic countries but relatively small in Southern countries and in Norway, Finland, and Sweden. The mortality rates were similar in rural and urban populations.
Our study included a broad geographical scope with countries from both Eastern and Western Europe. Although we optimized the comparability of the data from different countries, this comparability might be compromised in several ways. Some data had a cross-sectional unlinked design, while other consisted of census-linked mortality follow-up studies. It has been demonstrated that mortality inequalities based on unlinked mortality data are prone to the numerator-denominator bias. This bias relates to the fact that deaths (the numerator) are classified according to educational information on the death certificates, whereas the population (the denominator) is classified using the educational information from the population census. The educational levels could be reported differently in these two sources.[19] An important mechanism might be ‘promoting the dead’, where surviving relatives describe the educational level of deceased relatives higher than is true.[20, 21] We combined the two lowest educational levels, where this bias is more likely to occur, thereby minimizing possible overestimation of mortality inequalities in Central Eastern and Baltic countries. Although residual bias might have remained, it is unlikely to explain the large inequalities that were consistently observed in most Central Eastern and Baltic countries.
Socioeconomic position, the relative position of a person in society, is determined by the educational level that one has attained usually completed in early adulthood, by the occupation that one holds across adult life, by the income that one earns, and by the wealth that is accumulated over life.[22] In this study, we used education as the indicator of socioeconomic position. Information on mortality in relationship to level of education is available for most European countries; which is not the case for other socioeconomic variables. The experience of previous studies suggests that similar international patterns are likely to be observed when using occupational class. We observed large differences between countries in the distribution of the population by education. These differences may be partly due to real variation in educational attainment in different countries. However, these variations might also be the result of international differences in educational systems, consequently compromising the comparability of educational inequalities between countries. We used the RII as a measure to handle this problem. The RII estimates can be compared across countries, provided that a hierarchical classification of educational levels is available in each country. This problem is therefore partially solved, but does not completely disappear.
Although all data came from populations with reliable cause-of-death registries, causes of death could be coded differently between countries due to variations in national diagnosing practices. This problem would only bias our estimates when coding practices differ between the educational levels of the deceased. There is no evidence to support this possibility, but we cannot completely rule out such a bias. There is a general awareness of underreporting of TB deaths, but it is still necessary to investigate whether these problems are related to the educational level of the deceased.
The high age- and sex-standardized mortality rates and large inequalities in mortality in Estonia and Lithuania could be explained partially by the higher incidence of TB in these countries,[7,28] which to some extent may be attributed to HIV deaths reported as TB deaths, especially in the younger age groups. There were a large number of TB deaths in the younger age groups of these countries (Figure 1), and the large inequalities are mainly in the younger ages, and not so much in the older age groups. Because the HIV epidemic is a relatively new phenomenon and will only affect the youngest age groups in our study, there may be other explanations affecting inequalities in mortality in Baltic countries, such as alcohol consumption, prevalence of multidrug-resistant TB, and homelessness (extreme poverty). These factors may play a role in other European countries as well, although HIV is likely to be the most important confounder. [15], [29–31] The relatively large inequalities observed in males in Barcelona could also be due to higher HIV mortality, since the data from Barcelona start in the early 1990s, before antiretroviral therapy was introduced. Multidrug resistance TB is potentially another important confounding factor, but multidrug resistance could well be in the mediation pathway between education and TB mortality since the level of education can affect, for example, the adherence to medication.[32] Unfortunately we do not have information to perform further analysis with confounders.
Despite some limitations, our results show that educational inequalities in TB mortality are present in all European countries. The magnitude of inequality in TB mortality is clearly higher than that reported for other diseases.[23] Inequality in TB mortality is produced by inequalities in both incidence and case fatality. Inequalities in incidence are largely due to differences in nutritional and living conditions (e.g., housing, homelessness, imprisonment, sanitation, poor ventilation and household crowding). Inequalities in case fatality are more dependent on social inequalities in access to health care, treatment, and co-morbidity (e.g., due to HIV, intravenous drug use, and alcohol consumption).[24] Although inequalities in incidence may be more fundamental, death from TB can be prevented; anti-TB treatment is both effective and cost-effective. Limited access to health care will lead to delays in initiating anti-TB treatment, as has been observed in health services in several countries, and is amenable to targeted public health policies.[25–27]
Conclusions
We provide evidence of tuberculosis inequalities, and our analysis may be regarded as a first step to lead public health policy makers to those target populations that are vulnerable and help tailor social and health services to these groups. This implies 1) better monitoring of TB inequalities by implementing adequate surveillance systems of socioeconomic indicators, possible confounders and regional differences; 2) better targeting of effective interventions such as Directly Observed Treatment, Short-course (DOTS) to the most vulnerable populations; and 3) engaging more effectively with non-governmental organisations and civic society to better reach disadvantaged populations. Fighting TB is essentially fighting unacceptable socioeconomic inequalities underlying the disease. Cross-sectoral partnerships are essential to reduce health inequalities; a biomedical approach alone will not suffice to deal with this problem. We conclude that socioeconomic inequalities in TB mortality exist in all European countries. Firm political commitment is required to reduce inequalities in the social determinants of incidence of TB, such as poverty and education. Targeted public health measures are called for to improve the access of vulnerable groups to treatment, thereby reducing TB mortality.
Acknowledgments
The participation of J.L. Álvarez in this study was supported by the Spanish Ministry of Education by means of an FPU grant (beca de Formación de Profesorado Universitario).
Footnotes
Ethics and transparency statement
Ethical approval was not required for the study and the authors state that they have no conflict of interest
References
- 1.Daniel TM. The history of tuberculosis. Respir Med. 2006;100:1862–1870. doi: 10.1016/j.rmed.2006.08.006. [DOI] [PubMed] [Google Scholar]
- 2.World Health Organization. Global and regional incidence, Tuberculosis Fact sheet N°104. WHO; 2006. Retrieved on 6 October 2006. [consulted 22/03/2010] Available in http://www.who.int/mediacentre/factsheets/fs104/en/index.html. [Google Scholar]
- 3.Onyebujoh P, Graham AW. World Health Organization Disease Watch: Focus: Tuberculosis. WHO; 2004. [Google Scholar]
- 4.Szreter S, Rethinking M. The relationship between public health and social change. Am J Public Health. 2002;92:722–725. doi: 10.2105/ajph.92.5.722. [DOI] [PMC free article] [PubMed] [Google Scholar]
- 5.Palomino JC, Cardoso S, Ritacco V. Tuberculosis 2007 From basic science to patient care. 2007;1:25–45. [Google Scholar]
- 6.Martín R, Monleón-Getino T. A graphical study of tuberculosis incidence and trends in the WHO’s European region (1980–2006) Eur J Epidemiol. 2009;24:381–387. doi: 10.1007/s10654-009-9347-6. [DOI] [PubMed] [Google Scholar]
- 7.Report WHO. Global Tuberculosis Control. Interim Policy on Collaborative TB/HIV Activities. Geneva: World Health Organization; 2004. [Google Scholar]
- 8.Hammer O, Harper DAT, Ryan PD. PAST: palaentological statistics software package for education and data analysis. Palaentologica Electronica. 2001;4:9–15. [Google Scholar]
- 9.Semenza JC, Giesecke J. Intervening to reduce inequalities in infections in Europe. Am J Public Health. 2008;98:787–792. doi: 10.2105/AJPH.2007.120329. [DOI] [PMC free article] [PubMed] [Google Scholar]
- 10.Mackenbach JP, Kunst AE, Cavelaars AE, Groenhof F, Geurts JJ. Socioeconomic inequalities in morbidity and mortality in western Europe. The EU Working Group on Socioeconomic Inequalities in Health. Lancet. 1997;349:1655–1659. doi: 10.1016/s0140-6736(96)07226-1. [DOI] [PubMed] [Google Scholar]
- 11.Krieger N, Waterman PD, Chen JT, Soobader MJ, Subramanian SV. Monitoring socioeconomic inequalities in sexually transmitted infections, tuberculosis, and violence: geocoding and choice of area-based socioeconomic measures. Public Health Rep. 2003;118:240–260. doi: 10.1093/phr/118.3.240. [DOI] [PMC free article] [PubMed] [Google Scholar]
- 12.Muniyandi M, Ramachandran R. Socioeconomic inequalities of tuberculosis in India. Expert Opin Pharmacother. 2008;9:1623–1628. doi: 10.1517/14656566.9.10.1623. [DOI] [PubMed] [Google Scholar]
- 13.Pasarín M, Borrell C, Plasència A. Two patterns of social inequalities in mortality in Barcelona, Spain. Gac Sanit. 1999;13:431–440. doi: 10.1016/s0213-9111(99)71403-2. [DOI] [PubMed] [Google Scholar]
- 14.Mackenbach JP, Bos V, Andersen O, Cardano M, Costa G, Harding S, et al. Widening socioeconomic inequalities in mortality in six Western European countries. Int J Epidemiol. 2003;32:830–837. doi: 10.1093/ije/dyg209. [DOI] [PubMed] [Google Scholar]
- 15.Leinsalu M, Stirbu I, Vågero D, Kalediene R, Kovacs K, Wojtyniak B, et al. Educational inequalities in mortality in four Eastern European countries: divergence in trends during the post-communist transition from 1990 to 2000. Int J Epidemiol. 2009;38:512–525. doi: 10.1093/ije/dyn248. [DOI] [PubMed] [Google Scholar]
- 16.Eurothine. Tackling Health Inequalities in Europe. [consulted 22/03/2010] Available in http://survey.erasmusmc.nl/eurothine.
- 17.Unesco. International Standard Classification of Education (ISCED): UNESCO. 1997. [consulted 22/03/2010] Available in http://www.unesco.org/education/information/nfsunesco/doc/isced_1997.htm.
- 18.Ezendam NP, Stirbu I, Leinsalu M, Lundberg O, Kalediene R, Wojtyniak B, et al. Educational inequalities in cancer mortality differ greatly between countries around the Baltic Sea. Eur J Cancer. 2008;44:454–464. doi: 10.1016/j.ejca.2007.11.015. [DOI] [PubMed] [Google Scholar]
- 19.Kunst A. EU Working Group on Socioeconomic Inequalities in Health. Potential sources of bias in “unlinked” crosssectional studies. In: Kunst A, Cavelaars A, Groenhof F, Geurts J, Mackenbach J, editors. Socioeconomic inequalities in morbidity and mortality in Europe: a comparative study. Rotterdam: Department of Public Health, Erasmus University; 1996. pp. 147–162. [Google Scholar]
- 20.Kunst AE, Groenhof F, Borgan JK, et al. Socio-economic inequalities in mortality. Methodological problems illustrated with three examples from Europe. Rev Epidemiol Sante Publique. 1998;46:467–479. [PubMed] [Google Scholar]
- 21.Shkolnikov VM, Jasilionis D, Andreev EM, Jdanov DA, Stankuniene V, Ambrozaitiene D. Linked versus unlinked estimates of mortality and length of life by education and marital status: evidence from the first record linkage study in Lithuania. Soc Sci Med. 2007;64:1392–1406. doi: 10.1016/j.socscimed.2006.11.014. [DOI] [PubMed] [Google Scholar]
- 22.Kunst AE, Mackenbach JP. Measuring Socio-economic Inequalities in Health. World Health Organization; Copenhagen: 2000. pp. 50–54. [Google Scholar]
- 23.Suk JE, Manissero D, Büscher G, Semenza JC. Wealth inequality and tuberculosis elimination in Europe. Emerg Infect Dis. 2009;15:1812–1814. doi: 10.3201/eid1511.090916. [DOI] [PMC free article] [PubMed] [Google Scholar]
- 24.Grange JM, Kapata N, Chanda D, Mwaba P, Zumla A. The biosocial dynamics of tuberculosis. Trop Med Int Health. 2009;14:124–130. doi: 10.1111/j.1365-3156.2008.02205.x. [DOI] [PubMed] [Google Scholar]
- 25.Sterling TR, Zhao Z, Khan A, Chaisson RE, Schluger N, Mangura B, et al. Mortality in a large tuberculosis treatment trial: modifiable and non-modifiable risk factors. Int J Tuberc Lung Dis. 2006;10:542–549. [PubMed] [Google Scholar]
- 26.Díez M, Bleda MJ, Alcaide J, Castells C, Cardenal JI, Domínguez A, et al. Determinants of health system delay among confirmed tuberculosis cases in Spain. Eur J Public Health. 2005;15:343–349. doi: 10.1093/eurpub/cki010. [DOI] [PubMed] [Google Scholar]
- 27.Farah MG, Rygh JH, Steen TW, Selmer R, Heldal E, Bjune G. Patient and health care system delays in the start of tuberculosis treatment in Norway. BMC Infect Dis. 2006;24:6–33. doi: 10.1186/1471-2334-6-33. [DOI] [PMC free article] [PubMed] [Google Scholar]
- 28.World Health Organization. Global tuberculosis control: surveillance, planning and financing. WHO: Geneva; 2006. Publication WHO/HTM/TB/2006.362. [Google Scholar]
- 29.Lai T, Rätsep M, Rüütel K, et al. Modelling Estonia’s concentrated HIV epidemic. A case study. Copenhagen: WHO Regional Office for Europe; 2009. [Google Scholar]
- 30.Uusküla A, Rajaleid K, Talu A, et al. Estimating injection drug use prevalence using state wide administrative data sources: Estonia, 2004. Addict Res Theory. 2007;15:411–424. [Google Scholar]
- 31.Kliiman K, Altraja A. Predictors of extensively drug-resistant pulmonary tuberculosis. Ann Intern Med. 2009;150:766–775. doi: 10.7326/0003-4819-150-11-200906020-00004. [DOI] [PubMed] [Google Scholar]
- 32.Mehta S, Moore R, Graham N. Potential factors affecting adherence with HIV therapy. AIDS. 1997;11:1665–70. doi: 10.1097/00002030-199714000-00002. [DOI] [PubMed] [Google Scholar]