

Abstract
Motivation: Identifying genes altered in cancer plays a crucial role in both understanding the mechanism of carcinogenesis and developing novel therapeutics. It is known that there are various mechanisms of regulation that can lead to gene dysfunction, including copy number change, methylation, abnormal expression, mutation and so on. Nowadays, all these types of alterations can be simultaneously interrogated by different types of assays. Although many methods have been proposed to identify altered genes from a single assay, there is no method that can deal with multiple assays accounting for different alteration types systematically.
Results: In this article, we propose a novel method, integration using item response theory (integIRTy), to identify altered genes by using item response theory that allows integrated analysis of multiple high-throughput assays. When applied to a single assay, the proposed method is more robust and reliable than conventional methods such as Student’s t-test or the Wilcoxon rank-sum test. When used to integrate multiple assays, integIRTy can identify novel-altered genes that cannot be found by looking at individual assay separately. We applied integIRTy to three public cancer datasets (ovarian carcinoma, breast cancer, glioblastoma) for cross-assay type integration which all show encouraging results.
Availability and implementation: The R package integIRTy is available at the web site http://bioinformatics.mdanderson.org/main/OOMPA:Overview.
Contact: kcoombes@mdanderson.org
Supplementary information: Supplementary data are available at Bioinformatics online.
1 INTRODUCTION
Cancer progression involves successive genetic and epigenetic alterations that transform normal cells into malignant derivatives by acquiring the eight hallmarks of cancer: sustaining proliferative signaling, evading growth suppressors, resisting cell death, enabling replicative immortality, inducing angiogenesis, activating invasion and metastasis, reprogramming energy metabolism and evading immune destruction (Hanahan and Weinberg, 2011). As a result, it is of great interest to identify altered genes as potential therapeutic targets. In the past, this would have been a daunting task considering that the human genome contains more than 20 000 genes. Using rapidly evolving high-throughput technologies, researchers can now profile the whole genome with multiple assay modalities in a time and cost-effective manner. The Cancer Genome Atlas (TCGA) is one current initiative that exploits these technological advances (McLendon et al., 2008). For the same set of samples, TCGA applies a variety of technologies including gene expression microarray, microRNA array, methylation array, array CGH, SNP array and sequencing, to interrogate the genomes of several types of cancer. TCGA and similar datasets pose a great challenge and opportunity for integrative bioinformatics research.
Over the last decade, several methodologies have been proposed for integrating genome-wide expression and copy number (CN) data. These methods can be roughly grouped into four categories: stepwise, regression-based, correlation-based and latent variable models (Huang et al., 2012; Lahti et al., 2012). Many existing methods focus on the correlation between assays and/or outcome. For example, Bicciato et al. (2009) developed a stepwise method called SODEGIR to identify overlapping genomic regions of differential expression and genomic imbalance. Menezes et al. (2009) used linear mixed models to search for genes whose expression is affected by CN change. Peng et al. proposed penalized multiple regression to model the dependence of RNA expression on DNA CN. There are also methods based on canonical correlation analysis that aim to find associations between CN and expression (Lê Cao et al., 2009; Waaijenborg et al., 2008) or even with outcome (Witten et al., 2009). Comparison of existing two-way integration methods is available (Lahti et al., 2012; Louhimo et al., 2012). The CNAmet method developed by Louhimo et al. (Louhimo and Hautaniemi, 2011) takes methylation data into account and is able to integrate three types of assays.
Our proposed method, integration using item response theory (integIRTy), is a latent variable approach with a different goal: integIRTy aims to use multiple assays to identify genes that are altered in cancer samples compared to normal controls. This general task is similar to differential expression analysis in a tumor/normal comparison, for which good reviews are available (Allison et al., 2006; Cui and Churchill, 2003). Conventional methods for differential expression analysis only deal with one type of data. IntegIRTy extends the analysis to multiple assay types and defines an overall metric for gene alteration. IntegIRTy automatically adjusts for heterogeneity in the data and in principle can be applied simultaneously to any number of whole genome assays.
The integIRTy model is motivated by the biological observation that tumor suppressor genes can be blocked (or oncogenes can be activated) by different mechanisms in different patients. One patient may have a deletion of the chromosomal region containing a gene; another may exhibit hypermethylation; a third may have a mutation that hampers transcription or translation or leads to a loss of function. Each kind of alteration could be sufficiently rare that the importance of the gene might be overlooked in analyses that study only one kind of assay. Mechanism-driven analytical methods for data integration (such as those that prioritize genes with evidence that CN alterations lead directly to mRNA expression changes) could still overlook genes that are sometimes deleted and sometimes hypermethylated. We address this situation statistically using a (binary) latent variable that serves as an indicator of whether a gene is ‘important’ for an individual patient’s cancer. Conditional on this latent variable, we assume that changes in different assay platforms (CN, mutation, methylation, etc.) are statistically independent. Changes in mRNA expression may still occur independently of these assays if, for example, they result from failures of regulation by miRs or transcription factors. Thus, the goal of our method differs from existing methods; we want to identify genes that are frequently altered in cancer, regardless of the kind of alteration.
We base integIRTy on IRT, which is widely used to construct, score, evaluate and compare psychological and educational tests (Baker, 2004). A test consists of a set of items (or questions) designed to measure a certain ability. Unlike earlier test theories, IRT models a person’s response to a test at the item level rather than the test level. Therefore, IRT can simultaneously model two entities: (i) the examinee’s latent trait (or ability) that determines his or her performance on the test and (ii) the characteristics of each item, represented by its difficulty and discrimination. This ability to simultaneously model examinees and test items makes IRT ideal for modeling complex and heterogeneous genomic data where different genes and samples from various assays behave differently.
To transform the IRT terminology to our application, we treat genes as examinees and samples as items. In this way, we can unleash the power of IRT to address many difficulties in integrative analysis: (i) the heterogeneity between assays can be resolved by the auto-adjustable item parameters, making the estimation of an ‘overall latent trait of alteration’ possible and meaningful. (ii) Integration across assays can be easily achieved by assembling a larger test with different assays supplying the items. (iii) The estimated latent trait of gene alteration as well as the item difficulty parameters are intuitive and can be used for further inference.
We have applied this method to three public datasets: two TCGA datasets, ovarian carcinoma (OV) (The Cancer Genome Atlas Research Network, 2011) and glioblastoma (GBM) (McLendon et al., 2008) and one breast cancer (BRCA) dataset (Pollack et al., 2002). All three datasets contain multiple high-throughput assays interrogating the same set of samples. We estimated the latent trait of alteration for each gene from each individual assay and after combining assays. We show that after integrating multiple assays, novel genes can be identified. The new method was also compared to conventional methods such as Student’s t-test and Wilcoxon rank-sum test and to the CNAmet approach for integrating different assays. To assess statistical significance, which is not provided by ordinary IRT applications, we used a permutation test to compute empirical P-values.
2 METHODS
2.1 Item response theory
IRT refers to a family of models that describe the relationship of an examinee’s performance on a set of test items to his or her underlying (latent) ability level. In practice, this relationship is modeled by a monotonically increasing function called the item characteristic curve (ICC; see Fig. 1). For binary responses (i.e. right or wrong), a two-parameter logistic model (2PL) can be specified as follows:
| (1) |
Fig. 1.

Illustration of item characteristic curve (ICC). (a) Exemplar ICC with a difficulty level of 0.5 and discrimination 1. (b) ICCs from real data. The first four OV patient samples in each assays are shown here
The left-hand side is the probability of a correct response to item i for person j with ability level θj. On the right side, bi is the item difficulty parameter for item i that determines the position of the ICC in relation to the ability scale. The item difficulty is the ability level required to achieve a 50% chance of a correct response on this item. As bi increases, the item becomes harder. The remaining parameter, ai, is the item discrimination for item i, which represents how well the item discriminates among the examinees. It is proportional to the slope of the ICC at ability level bi. Higher discrimination means that the item discriminates more clearly among the examinees and hence is more informative. Figure 1a shows an ICC with difficulty bi = 0.5 and discrimination ai = 1. Figure 1b shows several ICCs fitted from real data.
As noted earlier, we apply IRT by treating genes as examinees and patients as items. The main parameter of scientific interest is the latent ‘ability’ of each gene to be altered in cancer samples across all assay types and samples. Patients with many altered genes (low-item difficulty) provide less-useful information than patients with only a few altered genes (high-item difficulty). Groups of patients with similar patterns of altered genes tend to have a high-item discrimination and so are weighted more heavily than a patient who has an idiosyncratic set of altered genes (and low-item discrimination).
Importantly, the IRT model is expressed at the item level rather than the test level. This feature gives IRT models the so-called invariant property. The invariant property implies that: (i) item parameters are characteristics of the item and hence are not dependent upon examinees who take the test and (ii) the ability parameter that characterizes an examinee is not test-dependent and hence scores from different tests are comparable.
The 2PL model can be augmented by introducing a guessing parameter, which is then called the three-parameter logistic model (3PL). There is also a one-parameter logistic model (1PL), obtained by forcing ai equal to one. This model is also called the Rasch model. Since the three models are nested, one can use a Likelihood Ratio test to select the best model (Neyman and Pearson, 1933). Alternatively, we can use information-based criterion such as Akaike’s information criterion or Schwarz’s Bayesian information criterion (BIC) to identify the best model.
2.2 Parameter estimation
Parameter estimation has received tremendous considerations in the IRT literature. Methods under the maximum likelihood framework include joint maximum likelihood (JMLE), marginal maximum likelihood (MMLE) and conditional maximum likelihood (CML). JMLE has been shown to have many inherent problems, the most serious being that it is not statistically consistent (Baker, 2004). It also fails to estimate the latent trait when all items are answered correctly or incorrectly. In comparison, both MMLE and CML provide consistent parameter estimates. However, the CML approach is only possible under the Rasch model (Andersen, 1980). Recently, Bayesian estimation has also been used (Fox, 2010). We adopt the MMLE procedure that has become the standard method since its introduction, for which an implementation in R is available through the ltm package (Rizopoulos, 2006).
According to Baker and Kim, the MMLE can be formulated under the EM framework (Baker, 2004). First, the item parameters are estimated by maximizing the observed data likelihood after integrating out the latent traits. For example, the contribution of the mth examinee to the observed likelihood can be written as:
| (2) |
In Equation (2), a prior distribution f(θ) needs to be specified for the latent trait (usually a standard normal distribution is used), xim is the response to item i for examinee m and K is the total number of items in the test. Since there is no closed form formula for the observed data likelihood, Gauss–Hermite quadrature is required to evaluate the integral. Second, given current item parameter estimates  , the latent trait is estimated by the posterior mode as:
| (3) |
2.3 Estimation of latent trait from integrated data
Conceptually, estimating the latent trait for integrated data would be the same as estimation from an individual assay. However, when there are many assays to integrate or when there are many items in each assay, parameter estimation could become ill-conditioned. This can happen when there are more unknown parameters (i.e. each item introduces two parameters) than the data can afford to estimate. One way to deal with this problem is to fix the item parameters estimated from the individual assay type when modeling the combined data. That is, the item parameters characterizing the items remain the same when we estimate the integrated latent trait. This approach is valid because the IRT model has the invariant property. Since the item parameters are pre-estimated, we can simply calculate the latent traits for integrated data using the maximum a posteriori estimates (Magis, 2011).
2.4 Statistical significance assessment
In order to identify genes showing statistically significant alteration, we need to derive the null distribution of latent traits. Since there is no existing method for this purpose in the item–response setting, we use a non-parametric test to define empirical P-values based on permutation. Two alternative strategies can be used to infer the null distribution of latent traits similar to the ‘gene sampling’ and ‘sample label permutation’ methods (Ackermann and Strimmer, 2009).
Gene sampling corresponds to calculating latent traits after permuting the binary matrix within samples. In this case, computed P-values measure how different the observed latent trait is from the case where alterations happen randomly on the genes. Note that this method can be used even when normal (control) samples are unavailable. When normal samples are present, the sample label permutation approach can be used. The null latent trait can be computed by following the same procedure as computing the observed latent traits after permuting sample labels. As Ackermann and Strimmer point out, the two approaches can yield quite different results since they test different null hypotheses. Once the empirical P-value is calculated, multiple testing can be adjusted using existing methods (Dudoit et al., 2003). It should be noted that our integration approach entails no additional price in terms of multiple comparisons compared to analyzing just one dataset.
2.5 Data dichotomization
Proper transformation of the data is needed to fit the IRT model. To do this, one needs to define a metric measuring the alteration magnitude. Then, a specified cutoff is used to dichotomize the data. Many methods can be used to define the alteration magnitude. For two-channel array, data which provides the log ratio of intensities from tumor and healthy reference tissue, the log ratio itself can serve as alteration magnitude. When normal tissue is present, a feasible metric for expression data is to use a Z-like statistic that measures the deviation of a tumor sample from normal controls (see Section 2 in Supplementary Material).
We could dichotomize the methylation data the same way as expression data. However, since methylation measurements (the β value) are bounded between zero and one with an asymmetric distribution, a more biologically relevant method is to first discretize the methylation into three groups: unmethylated (β < 0.25), partly methylated (0.25 ≤ β ≤ 0.75) and highly methylated (β > 0.75). If the group membership for a tumor sample differs from the normal reference (defined by the normal β mean value), then we code this gene in this sample as altered.
Transformation of CN data is easier. Choosing a fixed threshold (e.g. 0.1, 0.2, … , 0.7), genes with absolute adjusted log2 ratio larger than this cutoff are converted to 1, and 0 otherwise. We use the adjusted log2 ratio derived by subtracting measurements on matched normal tissue from tumor tissue to exclude germline CN change that is irrelevant to tumorigenesis.
Generally, the choice of cutoff to dichotomize the alteration magnitude should not affect the final result as long as it is sensible. This can be evaluated through a sensitivity analysis, which we present below by comparing the latent trait estimates obtained from various versions of the data transformed using different cutoffs.
3 RESULTS
We performed a simulation study to show that the model can recover both the item parameters and latent traits in an integration setting (see Section 5 in Supplementary Material). We then investigated three public datasets (Table 1). Details about the samples and preprocessing steps are provided in Section 1 in Supplementary Material. Both the OV and GBM datasets contain three types of assays interrogating expression (Expr), methylation (Methy) and CN. The BRCA dataset only contains data for expression and CN. All three datasets have been examined in detail. However, due to page limitations, we mainly focus on OV data and present other datasets when necessary. The 1PL, 2PL and 3PL models have been fitted on each dataset. Based on BIC, the 2PL model is shown to be the preferred model in all datasets (Supplementary Table S3). Hence, all results presented below are from 2PL model.
Table 1.
Number of patients per dataset
| OV |
BRCA |
GBM |
||||
|---|---|---|---|---|---|---|
| Tumor | Normal | Tumor | Normal | Tumor | Normal | |
| Expression | 569 | 8 | 37 | NA | 473 | 10 |
| Methylation | 526 | 10 | 0 | NA | 370 | 6 |
| CN | 571 | 567 | 37 | NA | 341 | 341 |
3.1 Alteration pattern across assays
IntegIRTy allows us to evaluate and compare the alteration pattern across different assays. Figure 2 compares the alteration from individual assays and after integration for OV, BRCA and GBM datasets. A common pattern is that there are not many genes with severe alteration in all assays. We observed little correlation between the assays for either the conventional method or our IRT method. This is in agreement with previous results that showed only a small fraction of the variation in expression was attributable to methylation (Wu et al., 2010) or to CN change (Stranger et al., 2007) in a global sense.
Fig. 2.

Pair-wise smoothed density (darker cloud indicates higher density) of estimated latent trait for alteration (upper panels) and Spearman rank correlations (lower panels) among different assays and integrated data. When normal control samples are available for all assays, we also show the correlations of computed P-values from conventional methods in bracket. (a) OV dataset. (b) BRCA dataset. (c) GBM dataset
The amount contributed by individual assays to the integrated data differs. For both OV and GBM, the integrated latent trait is primarily influenced by methylation data, followed by CN and then expression. In BRCA, expression has a larger influence than CN. The correlation between latent traits from integrated data and individual datasets is well behaved compared to the conventional method where the integrated P-value is mostly dominated by the CN data.
3.2 Sensitivity analysis
The latent trait estimates derived using different thresholds to dichotomize the expression data agree well, especially for high-latent traits (Supplementary Fig. S1a–c). In the low-latent trait range, agreement is somewhat worse, mainly due to high SE associated with latent trait estimates. The agreement for CN is even better (Supplementary Fig. S1d–f). Hence, the proposed method is robust to cutoff choice during data transformation. In comparison, the naive score that simply computes the percentage of ‘correct responses’ (i.e. alterations) varies when using different thresholds (Supplementary Fig. S2). Although the latent trait estimates are similar using different thresholds, we use relatively stringent thresholds (2.5 for expression and 0.4 for CN) for further analyses.
3.3 Contribution of individual assays to integrated analysis
We performed a series of analyses to determine how individual assays contribute to the list of genes found by an integrate analysis using integIRTy. Figure 3 breaks down the lists of ‘top N’ genes (for N from 100 to 1000) from the integrated analysis of the OV dataset to see which genes are on one, two or all three of the top N lists from the individual assays. This figure shows that the top N list for methylation has the best agreement with the integrated list, with expression being second and CN having the least agreement. The relative contributions of the three assays to the integrated list remain consistent as we increase the length of the gene list. Moreover, both the absolute and relative number of ‘novel’ genes decreases as N increases. We performed similar analyses integrating assays two at a time and constructed similar plots (Supplementary Figs S13 and S14); the findings from this sequential integration are consistent with Figure 3.
Fig. 3.
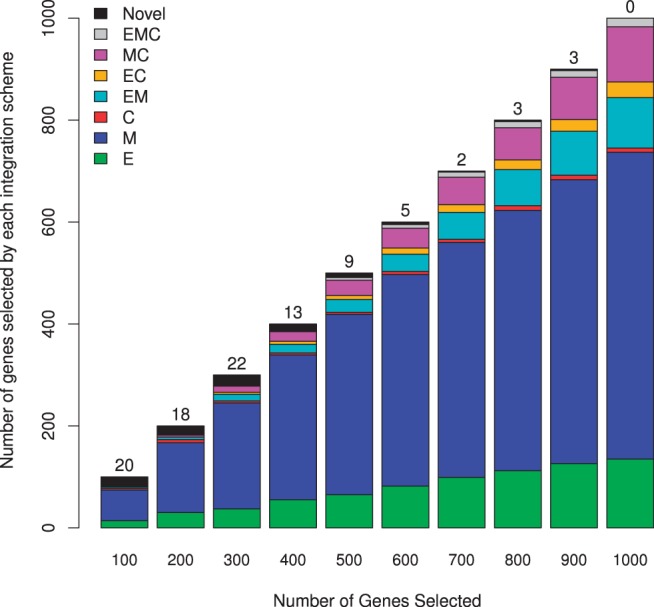
Relations between integrated and individual gene lists in OV data. We selected the top (100–1000) genes from the integrated analysis and from individual assays (E, expression; M, methylation; C, copy number). Each bar is equivalent to a Venn diagram showing how many of the top genes from the integrated analysis came from one, two (EM, expression and methylation; EC, expression and copy number; MC, methylation and copy number) or all three (EMC) individual assay gene lists. Black regions and numbers at the top of each bar count the number of ‘novel’ genes that only appear on the list from the integrated analysis
3.4 Novel-altered genes emerge when data are integrated
The latent trait estimated from the integrated data represents the overall propensity of a gene to be altered in at least one assay (expression, methylation or CN). Although this latent trait is a compromise among the latent traits estimated from individual assays, in many cases, the integrated rank (smaller rank for larger latent trait) is smaller than the average rank of the three assays (Supplementary Fig. S3a, S3c and S3e). There are also several occasions (296 genes in OV, 380 genes in BRCA, 811 genes in GBM) where the integrated rank is smaller than any of the ranks from individual assay (Supplementary Fig. S3b, S3d and S3f). The ability to identify altered genes that cannot be identified by individual assays shows the merits of data integration as well as the effectiveness of our method.
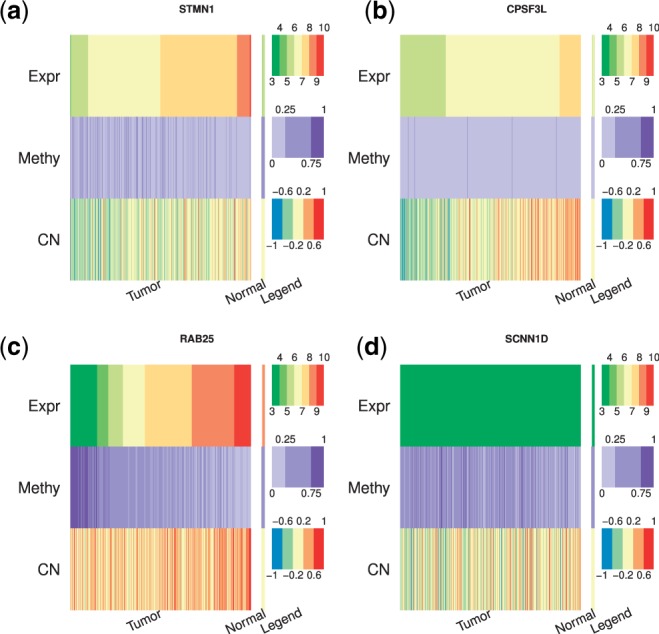
Table 2 shows the latent trait and rank for the top 20 genes selected using the integrated data for the OV data (similar results for BRCA and GBM data are in Supplementary Tables S1 and S2). The genes CDKN2A, VEGFC and STMN1 are only discovered by the integrated analysis (in top 20) and would not have been discovered using any of the individual assays (out of top 100). To verify that these genes are altered, we examined the original data and their relationships (Supplementary Figs S4–S6). The original data strongly support our finding. Interestingly, mRNA up-regulation of CDKN2A is associated with increased methylation. Further, functional annotations show that these genes are linked to cancer. Specifically, CDKN2A is involved in two critical cell cycle regulatory pathways, the p53 pathway and the RB pathway. CDKN2A plays an important role in many human cancers including pancreatic cancer, esophageal and gastric cancers, leukemia, bladder cancer and cutaneous melanoma. Differential expression of VEGFC is related to the different propensity to lymph node metastasis in thyroid cancers (Hung et al., 2003). STMN1 is an oncoprotein-regulating microtubule dynamics. Defective STMN1 causes constant mitotic spindle assembly and hence unregulated cell growth (Cassimeris, 2002).
Table 2.
Latent trait and rank for top 20 genes selected by integrated data in OV
| Genes | Integrated |
Expression |
Methylation |
Copy number |
||||
|---|---|---|---|---|---|---|---|---|
| LT | Rank | LT | Rank | LT | Rank | LT | Rank | |
| TTYH1 | 3.52 | 1(EM) | 5.00 | 45(E) | 3.11 | 47(M) | 0.49 | 2744 |
| SPARCL1 | 3.46 | 2(M) | 3.91 | 108 | 3.43 | 18(M) | 1.42 | 1148 |
| SPAG6 | 3.27 | 3(EM) | 6.21 | 17(E) | 2.89 | 79(M) | −1.30 | 6973 |
| CRISP2 | 3.01 | 4(E) | 6.70 | 8(E) | 2.40 | 225 | −0.65 | 5646 |
| DPT | 3.01 | 5(E) | 4.93 | 49(E) | 2.73 | 115 | −1.57 | 7397 |
| CFD | 2.86 | 6(E) | 4.66 | 63(E) | 2.09 | 433 | 1.89 | 616 |
| HNF1B | 2.81 | 7(E) | 4.98 | 47(E) | 1.89 | 607 | 2.89 | 133 |
| CDKN2A | 2.72 | 8(I) | 3.79 | 120 | 2.37 | 247 | 0.51 | 2684 |
| C11orf16 | 2.71 | 9(E) | 5.83 | 24(E) | 1.96 | 549 | 0.49 | 2752 |
| PDE8B | 2.68 | 10(E) | 5.93 | 22(E) | 1.79 | 718 | 1.47 | 1050 |
| RIMBP2 | 2.68 | 11(E) | 4.44 | 73(E) | 2.23 | 322 | −0.39 | 4876 |
| PIPOX | 2.64 | 12(M) | 1.68 | 654 | 4.01 | 3(M) | 2.63 | 182 |
| VEGFC | 2.60 | 13(I) | 3.31 | 152 | 2.27 | 302 | 1.59 | 839 |
| AGT | 2.56 | 14(E) | 4.33 | 79(E) | 2.18 | 360 | −1.05 | 6406 |
| CXorf57 | 2.52 | 15(E) | 4.62 | 65(E) | 1.78 | 735 | 1.38 | 1213 |
| CST6 | 2.51 | 16(M) | 2.82 | 224 | 3.16 | 40(M) | −2.02 | 8111 |
| PRAME | 2.43 | 17(E) | 4.09 | 94(E) | 1.76 | 749 | 1.61 | 815 |
| CDO1 | 2.43 | 18(M) | 2.17 | 396 | 2.99 | 61(M) | 0.54 | 2568 |
| FBLN1 | 2.41 | 19(C) | 2.91 | 206 | 2.06 | 452 | 3.35 | 67(C) |
| STMN1 | 2.41 | 20(I) | 2.85 | 216 | 2.55 | 168 | −0.28 | 4579 |
LT, latent trait. Genes with ranks lower than 100 are coded differently in the rank column (E, expression; M, methylation; C, copy number). Genes identified only by integrated data are coded as I in the integrated rank column.
Among the top 20 genes discovered by integration, the BRCA datasets identify two novel genes (SELENBP1 and EDIL3), while the GBM datasets identify 17 novel genes (Supplementary Table S2). SELENBP1 has been found to mediate the anticancer action of selenium in prostate (Yang and Sytkowski, 1998), lung (Chen et al., 2004) and colon (Kim et al., 2006) cancer. EDIL3 plays an important role in mediating angiogenesis (Aoki et al., 2005). Functions of the 17 novel genes in GBM data include cell death, hematological system development, cell morphology, nervous system development and cell cycle, according to Ingenuity Pathway Analysis (Ingenuity[textregistered] Systems, www.ingenuity.com).
3.5 Comparison to conventional methods
Identifying altered genes is essentially a two-group (tumor versus normal) comparison problem. Hence, we can compare our method to conventional methods such as the t-test (for expression and CN data) or rank test (for methylation data which is bounded between zero and one) (see Supplementary Fig. S7). There is no direct test that applies to combined data. Inspired by Fisher’s method for meta-analysis based on P-values, we use the geometric mean of the P-values from each assay to represent the ‘conventional’ P-value from the integrated data. Empirical P-values for the latent traits were computed based on the permutation test described previously. A gene was assigned a positive call if its P-value was less than a specific cutoff. Thus, we can divide the genes into four categories: positive/negative (positive call by our method and negative call by conventional method), negative/positive (negative call by our method and positive call by conventional method), positive/positive (both methods give positive calls) and negative/negative (both methods give negative calls). Conventional methods model genes separately while our method models all genes and samples simultaneously. Hence, we do not expect a perfect correlation between latent traits and P-values from conventional methods.
We inspected the original measurements and found that the positive/negative genes found by our method are meaningful and very likely to be truly altered genes while negative/positive genes missed by our method are actually not severely altered even though they are statistically significant due to increased sample size or batch effect (see Fig. 4). For example, positive/negative genes usually exhibit non-Gaussian expression which cannot be detected by the t-test but can be identified by our method as shown in Figure 4a. Compared to normal, this gene is expressed 16-fold higher in >15% of the tumor samples which suggests it is likely to be altered. Figure 4b shows a typical example of a negative/positive gene in expression. Although the increased sample size enables us to compute a significant P-value, a statistically significant difference does not necessarily mean a biological difference. In this example, there is almost no difference in the mean expression (8.7 versus 8.1) which strongly suggests that our method gives the right decision. In Figure 4c, a positive/negative gene is shown that obviously exhibits different methylation pattern that the rank test fails to detect. In comparison, negative/positive genes are usually not biologically different (i.e. almost all samples have beta value <0.25 and hence are unmethylated) but statistically different mainly due to a batch effect (Fig. 4d). For CN data, there are many negative/positive cases where t-test assigns more than half of the genes a 0 P-value due to large sample size (571 tumor and 567 normal samples). In fact, the difference of mean log2 ratio between tumor and normal is biologically negligible for almost all of these genes.
Fig. 4.

Example genes with disconcordant calls between conventional method and our method. The original measurement is plotted against sample index after sorting by tissue type and batch number. Red circles indicate altered values based on dichotomized data; green circles indicate unaltered values. The expression from normal control samples are indicated by solid green dots. Black solid lines represent tumor and normal mean. Dashed lines denote the component means estimated from two-component mixture. In the panel titles, we show gene symbol, latent ability, percentage of tumor samples altered (rate) and conventional test P-value. (a) A typical gene missed by t-test but identified by our method. Bimodality index (BI) shown in the title strongly suggests a subgroup of the tumor samples have a large magnitude of overexpression compared to normal samples and hence, is likely to be altered. (b) A gene missed by our method but flagged by t-test. This is an example where statistical significance does not imply biological significance. The difference between tumor and normal sample is minor. As a result, our method makes the correct decision. (c) A typical gene missed by rank test but flagged by our method. More than 50% of the tumor samples have increased methylation which strongly suggests altered methylation. (d) A gene missed by our method but flagged by rank test. The trend of beta value here is mostly due to batch effect, not biological difference. All tumor and normal samples are not methylated (β > 0.25). Accordingly, our method assigns a very low-latent trait estimate. In comparison, the conventional method dictates a strong statistical difference between tumor and normal simply due to batch effect
3.6 Item parameters characterize properties of samples
While the estimated latent traits characterize the properties of genes, the item parameters can characterize patient samples. Samples with small item difficulty are easier to be altered and hence contain more alterations. In both OV and GBM data, expression data have the largest (median) difficulty followed by methylation and then CN (Supplementary Fig. S8). This implies the frequency of CN alteration is higher compared to expression or methylation. The widespread CN change in OV data identified by our model agrees with previous finding (The Cancer Genome Atlas Research Network, 2011). The median item difficulty for expression and CN in BRCA data is similar, although the difficulty estimates for CN are more variable, suggesting a higher heterogeneity in CN.
3.7 Complementary information provided by integIRTy and CNAmet
We compared integIRTy with CNAmet, another method developed to integrate expression, methylation and CN data (Louhimo and Hautaniemi, 2011). Although CNAmet shares a similar idea by dichtomizing methylation and CN data before integration, it has a different goal. Rather than identify genes altered between tumor and normal samples, CNAmet searches for genes whose expression is synergistically regulated by methylation and CN. Conceptually, gene alteration can happen with or without synergistic regulation and vice versa. This is confirmed by real data analysis where both alteration without synergistic regulation (Fig. 5a) and no alteration yet under synergistic regulation (Fig. 5b) are observed. When both methods give concordant calls (Fig. 5c and d), integIRTy and CNAmet provide complementary information that not only tell us whether a gene is altered but the underlying mechanism. Interestingly, roughly half of the altered genes are not under synergistic regulation and half of the genes under synergistic regulation are not altered (Supplementary Fig. S9).
Fig. 5.
Complementary information provided by integIRTy and CNAmet. (a) Overexpression in tumor where the regulation by methylation and CN is not synergistic. As a result, CNAmet fails to detect it. (b) Mild overexpression mainly driven by CN gain. integIRTy did not detect this gene due to the high-background CN change. (c) Overexpression in tumor samples driven by hypomethylation and CN gain. Genes like this are easy to be detected by both methods. (d) Expression is turned off in both tumor and normal samples due to hypermethylation. Since there is little difference between tumor and normal, both methods suggest it is not altered
4 DISCUSSION
As the cost of high-throughput technology drops dramatically, it becomes common to interrogate samples with multiple modalities of assays simultaneously. However, systematically integrating these assays is rarely achieved by existing methods. Here, we propose a natural and interpretable framework to integrate heterogeneous high-throughput datasets using IRT. This is the first application of IRT to integrative bioinformatics research.
In our approach, both samples and genes are simultaneously modeled through the item response model. The heterogeneity among different datasets is automatically adjusted by fitting different item parameters. The integrated latent trait provides a nice metric to define the overall propensity to alteration in all assays. Importantly, the integrated latent trait can be used to identify novel genes that cannot be identified by looking at each dataset individually. Furthermore, the estimated latent trait together with item parameters characterizing the properties of genes and patient samples can be used as an intuitive visual aid to examine the high-dimensional dataset.
Compared to conventional methods, our method is able to identify altered genes that are more reliable and likely to be biologically meaningful. With increased sample size, the conventional method has increased power to detect a difference between tumor and normal samples. However, in many cases, such differences are dubious and irrelevant to the underlying biology. In comparison, genes identified by our method ensure a biological difference. The reason is that latent traits are computed from the dichotomized data with the biology (alteration status) already built in. Another advantage of our method is that it does not make any distributional assumption about the data. This enables us to identify genes that are missed by conventional methods such as the t-test. It should be pointed out that our method mainly focused on the alteration status rather than the correlations between different assays. As a result, the direction of regulation is not modeled. For instance, identified alteration in expression can be either overexpression or underexpression. Nevertheless, when a gene is overexpressed in one group of patients while underexpressed in another group, our method has the advantage to still identify such genes even when the mean expression is unaffected. In this respect, it is similar to the PPST test introduced to find markers in mRNA expression data (Lyons-Weiler et al., 1994).
We have chosen to dichotomize all of the assays as part of our approach to integration; this approach simplifies the integration step because all of the data inputs are binary. While the logistic model in Equation (1) requires binary data, the heart of our approach lies in the latent variable that indicates ‘alteration’ and appears as a probability on the left-hand side of the equation. IRT has been generalized to other kinds of data by changing the right-hand side of Equation (1). For ordinal data with more than two categories (which might arise from categorizing CN data as loss, normal or gain), one can use the generalized partial credit model (Muraki, 1992), the rating scale model (Andrich, 1978) or the graded response model (Samejima, 1969). For continuous-bounded data (like that from a methylation array), one can use beta distributions (Noel and Dauvier, 2012). For normally distributed data (such as log-transformed mRNA expression data), the natural generalization of the IRT model (Mellenbergh, 1994; Moustaki, 1996) is equivalent to factor analysis (FA). FA has been used previously to integrate expression data profiled by different microarray platforms (Wang et al., 2011). For individual assays, it is likely that one of these alternative models that preserve more of the continuous input data would prove more effective than the logistic model that we present. However, using different models on each data type presents other difficulties. In order to integrate the data from multiple assays, it becomes necessary to specify the joint distributions, which could result in an elaborate and unwieldy model. IntegIRTy resolves this issue by coding all of the data from all assays into binary. We believe that this simplification of the model provides further benefits by making the results more interpretable, but only further research will determine if more complex models can produce better results.
Supplementary Material
ACKNOWLEDGEMENTS
The authors thank Gordon B. Mills, John N. Weinstein, Lynne V. Abruzzo, Shoudan Liang, Keith A. Baggerly and Sheng Luo for their helpful discussions. We also appreciate the comments from anonymous reviewers.
Funding: National Institutes of Health/National Cancer Institute [R01 CA132897 and P30 CA016672].
Conflict of Interest: none declared.
REFERENCES
- Ackermann M, Strimmer K. A general modular framework for gene set enrichment analysis. BMC Bioinformatics. 2009;10:47. doi: 10.1186/1471-2105-10-47. [DOI] [PMC free article] [PubMed] [Google Scholar]
- Allison DB, et al. Microarray data analysis: from disarray to consolidation and consensus. Nat. Rev. Genet. 2006;7:55–65. doi: 10.1038/nrg1749. [DOI] [PubMed] [Google Scholar]
- Andersen E. Discrete Statistical Models with Social Science Applications. 1980. North-Holland, Amsterdam. [Google Scholar]
- Andrich D. A rating formulation for ordered response categories. Psychometrika. 1978;43:561–573. [Google Scholar]
- Aoki M, et al. Expression of developmentally regulated endothelial cell locus 1 was induced by tumor-derived factors including VEGF. Biochem. Biophys. Res. Commun. 2005;333:990–995. doi: 10.1016/j.bbrc.2005.06.009. [DOI] [PubMed] [Google Scholar]
- Baker FB, Kim SH, editors. Item Response Theory: Parameter Estimation Techniques. 2nd. NY: Marcel Decker; 2004. [Google Scholar]
- Bicciato S, et al. A computational procedure to identify significant overlap of differentially expressed and genomic imbalanced regions in cancer datasets. Nucleic Acids Res. 2009;37:5057. doi: 10.1093/nar/gkp520. [DOI] [PMC free article] [PubMed] [Google Scholar]
- Cassimeris L. The oncoprotein 18/stathmin family of microtubule destabilizers. Curr. Opin. Cell Biol. 2002;14:18–24. doi: 10.1016/s0955-0674(01)00289-7. [DOI] [PubMed] [Google Scholar]
- Chen G, et al. Reduced selenium-binding protein 1 expression is associated with poor outcome in lung adenocarcinomas. J. Pathol. 2004;202:321–329. doi: 10.1002/path.1524. [DOI] [PubMed] [Google Scholar]
- Cui X, Churchill G. Statistical tests for differential expression in cDNA microarray experiments. Genome Biol. 2003;4:210. doi: 10.1186/gb-2003-4-4-210. [DOI] [PMC free article] [PubMed] [Google Scholar]
- Dudoit S, et al. Multiple hypothesis testing in microarray experiments. Stat. Sci. 2003;18:71–103. [Google Scholar]
- Fox JP. Bayesian Item Response Modeling: Theory and Applications. NY: Springer; 2010. [Google Scholar]
- Hanahan D, Weinberg R. Hallmarks of cancer: the next generation. Cell. 2011;144:646–674. doi: 10.1016/j.cell.2011.02.013. [DOI] [PubMed] [Google Scholar]
- Huang N, et al. Lessons from a decade of integrating cancer copy number alterations with gene expression profiles. Brief. Bioinformatics. 2012;13:305–316. doi: 10.1093/bib/bbr056. [DOI] [PMC free article] [PubMed] [Google Scholar]
- Hung C, et al. Expression of vascular endothelial growth factor-C in benign and malignant thyroid tumors. J. Clin. Endocrinol. Metab. 2003;88:3694. doi: 10.1210/jc.2003-030080. [DOI] [PubMed] [Google Scholar]
- Kim H, et al. Suppression of human selenium-binding protein 1 is a late event in colorectal carcinogenesis and is associated with poor survival. Proteomics. 2006;6:3466–3476. doi: 10.1002/pmic.200500629. [DOI] [PubMed] [Google Scholar]
- Lahti L, et al. Cancer gene prioritization by integrative analysis of mRNA expression and DNA copy number data: a comparative review. Brief Bioinform. 2012 doi: 10.1093/bib/bbs005. [Epub ahead of print, doi: 10.1093/bib/bbs005, March 22, 2012] [DOI] [PMC free article] [PubMed] [Google Scholar]
- Lê Cao K, et al. Sparse canonical methods for biological data integration: application to a cross-platform study. BMC Bioinformatics. 2009;10:34. doi: 10.1186/1471-2105-10-34. [DOI] [PMC free article] [PubMed] [Google Scholar]
- Louhimo R, Hautaniemi S. CNAmet: an R package for integrating copy number, methylation and expression data. Bioinformatics. 2011;27:887–888. doi: 10.1093/bioinformatics/btr019. [DOI] [PubMed] [Google Scholar]
- Louhimo R, et al. Comparative analysis of algorithms for integration of copy number and expression data. Nat. Methods. 2012;9:351355. doi: 10.1038/nmeth.1893. [DOI] [PubMed] [Google Scholar]
- Lyons-Weiler J, et al. Tests for finding complex pattens of differential expression in cancers: toward individualized medicine. BMC Bioinformatics. 1994;5:110. doi: 10.1186/1471-2105-5-110. [DOI] [PMC free article] [PubMed] [Google Scholar]
- Magis D, Raiche G. catR: An R package for computerized adaptive testing. Appl. Psychol. Measure. 2011;35:576–577. [Google Scholar]
- McLendon R, et al. Comprehensive genomic characterization defines human glioblastoma genes and core pathways. Nature. 2008;455:1061–1068. doi: 10.1038/nature07385. [DOI] [PMC free article] [PubMed] [Google Scholar]
- Mellenbergh G. A unidimensional latent trait model for continuous item responses. Multivar Behav. Res. 1994;29:223–236. doi: 10.1207/s15327906mbr2903_2. [DOI] [PubMed] [Google Scholar]
- Menezes R, et al. Integrated analysis of DNA copy number and gene expression microarray data using gene sets. BMC Bioinformatics. 2009;10:203. doi: 10.1186/1471-2105-10-203. [DOI] [PMC free article] [PubMed] [Google Scholar]
- Moustaki I. A latent trait and a latent class model for mixed observed variables. Br. J. Math. Stat. Psychol. 1996;49:313–334. [Google Scholar]
- Muraki E. A generalized partial credit model: application to an EM algorithm. Appl. Psychol. Meas. 1992;16:159–176. [Google Scholar]
- Neyman J, Pearson E. On the problem of the most efficient tests of statistical hypotheses. Philos. Transact. A Math. Phys. Eng. Sci. 1933;231:289–337. [Google Scholar]
- Noel Y, Dauvier B. A beta Item Response Model for continuous bounded repsonses. J. Educ. Behav. Stats. 2012;37:82–113. [Google Scholar]
- Pollack J, et al. Microarray analysis reveals a major direct role of DNA copy number alteration in the transcriptional program of human breast tumors. Proc. Natl Acad. Sci. 2002;99:12963. doi: 10.1073/pnas.162471999. [DOI] [PMC free article] [PubMed] [Google Scholar]
- Rizopoulos D. ltm: An R package for latent variable modeling and item response theory analyses. J. Stat. Software. 2006;17:1–25. [Google Scholar]
- Samejima F. Psychometric Monograph No. 17. Richmond, VA: Psychometric Society; 1969. Estimation of latent ability using a response pattern of graded scores. http://www.psychometrika.org/journal/online/MN17.pdf (16 October 2012, date last accessed) [Google Scholar]
- Stranger B, et al. Relative impact of nucleotide and copy number variation on gene expression phenotypes. Science. 2007;315:848. doi: 10.1126/science.1136678. [DOI] [PMC free article] [PubMed] [Google Scholar]
- The Cancer Genome Atlas Research Network. Integrated genomic analysis of ovarian carcinoma. Nature. 2011;474:609–615. doi: 10.1038/nature10166. [DOI] [PMC free article] [PubMed] [Google Scholar]
- Waaijenborg S, et al. Quantifying the association between gene expressions and DNA-markers by penalized canonical correlation analysis. Stat. Appl. Genet. Mol. Biol. 2008;7:3. doi: 10.2202/1544-6115.1329. [DOI] [PubMed] [Google Scholar]
- Wang X, et al. Unifying gene expression measures from multiple platforms using factor analysis. PLoS One. 2011;6:e17691. doi: 10.1371/journal.pone.0017691. [DOI] [PMC free article] [PubMed] [Google Scholar]
- Witten D, et al. A penalized matrix decomposition, with applications to sparse principal components and canonical correlation analysis. Biostatistics. 2009;10:515. doi: 10.1093/biostatistics/kxp008. [DOI] [PMC free article] [PubMed] [Google Scholar]
- Wu X, et al. CpG island hypermethylation in human astrocytomas. Cancer Res. 2010;70:2718. doi: 10.1158/0008-5472.CAN-09-3631. [DOI] [PMC free article] [PubMed] [Google Scholar]
- Yang M, Sytkowski A. Differential expression and androgen regulation of the human selenium-binding protein gene hsp56 in prostate cancer cells. Cancer Res. 1998;58:3150–3153. [PubMed] [Google Scholar]
Associated Data
This section collects any data citations, data availability statements, or supplementary materials included in this article.