Abstract
Human pulmonary arterial smooth muscle cells (PASMC) were isolated from elastic pulmonary arteries dissected from lungs of individuals with and without pulmonary arterial hypertension (PAH). Reflecting increased smooth muscle constriction in cells from PAH subject, Ca2+ influx in response to endothelin-1 (ET-1) increased in all the PAH PASMC populations relative to the normal donor control cells. The ETA receptor mRNA levels remained unchanged, whereas the ETB receptor mRNA levels decreased in both heritable and idiopathic PAH derived PASMC. All the PASMC populations expressed considerably higher ETA compared to ETB receptor number. Both ETA and ETB receptor numbers were reduced in bone morphogenetic protein receptor type II (BMPR2) mutation PAH. ETB receptors showed a particular reduction in number. Phospho-antibody array analysis of normal and BMPR2 deletion PASMC illustrated ERK and Akt activation to be the most prominent and to be taking place principally through ETB receptors in normal PASMC, but primarily through ETA receptors in PASMC from BMPR2 PAH subjects. Additionally in the PAH cells the total relative ET-1 signal response was markedly reduced. Western analysis from the BMPR2 PASMC duplicated the array results whereas PASMC from iPAH subjects showed variability with most samples continuing to signal through ETB. In sum, these results indicate that generally both receptors are reduced in PAH particularly ETB, and that ETB signaling through protein kinases becomes markedly reduced in BMPR2 PASMC while it continues in IPAH. Importantly the data suggest that caution must be taken when applying ET-1 receptor antagonist therapy to PAH patients.
Keywords: Pulmonary arterial hypertension, Endothelin receptors, Bone morphogenic protein receptor 2 (BMPR2), Pulmonary arterial smooth muscle cells (PASMC), Phospho-protein array
Introduction
Pulmonary arterial hypertension (PAH) is a fatal disorder of the pulmonary vasculature. PAH is progressive with very limited therapeutic success. Although of variable etiology, including idiopathic PAH (iPAH) and heritable PAH (hPAH), such as that involving bone morphogenic protein receptor 2 (BMPR2) exon deletions, the histological appearance of the lung tissue in all PAHs is generally similar involving intimal fibrosis, increased medial thickness, increased proliferation and constriction of smooth muscle cells (Farber and Loscalzo, 2004). The pathogenesis exhibits a combination of vasoconstriction and inward vascular wall remodeling (Morrell et al., 2009).
Clearly, signal pathways maintaining normal cellular balance become dysfunctional leading to malfunctioning vascular and pulmonary physiology (Morrell et al., 2009). Major among these are the actions of endothelin-1 (ET-1), a powerful vasoconstrictor. ET-1 signals through two receptors, ETA and ETB. Little is understood with regard to ET-1 signaling, although the ETA receptor has been reported to promote cAMP production presumably via Gαs, while the ETB receptor lacks this capability (Masaki et al., 1999). Treatment of PAH patients with ETA, ETB receptor blockers is standard treatment. This treatment has met with varied success (Trow and Taichman, 2009). It is imperative to understand ET-1 function/signaling via its two receptors in the various cases of PAH. This knowledge will result in better treatment with a much expanded understanding of the signal malfunctions taking place in iPAH and other forms of PAH.
Recently developed availability of primary human cells from the vasculature of subjects free of and afflicted with PAH has given us the opportunity to begin to examine vascular controlling receptor function associated with PAH and examine their signaling changes. Here we investigate the expression and signal transduction of the ET-1 receptors in pulmonary arterial smooth muscle cells (PASMC) isolated from donor control, heritable and idiopathic PAH lungs (Comhair et al., 2012). Our findings present evidence that differences exist among the various PAHs with regard to receptor expression and signal transduction. This suggests that care must be taken as to the treatment with ET-1 blockers and also specific ETA versus ETA/ETB receptor blockers such as bosentan. Studies on PAH with BMPR2 mutations are of particular interest because 20% of individuals expressing BMPR2 mutations develop PAH (Machado et al., 2009). Smad-8 mutations have also been associated with hPAH (Drake et al., 2011). In the BMPR2 and Smad-8 mutation cells, we find a marked loss of the ETB receptor and a switch from ETB to ETA caused activation of ERK and Akt. More variability is seen within the iPAH PASMC populations.
Materials and Methods
Materials
[3H] BQ123 and [125I] Endothelin-1 were obtained from Perkin Elmer Life Sciences (Boston, MA). BCA Protein Assay Kit was from Pierce (Rockford, IL). ECL Western Blotting Detection Reagents were from Amersham Biosciences (Piscataway, NJ). The cDNA for endothelin receptor A (#EDNRA00000) and B (#EDNRB00000) were purchased from Missouri S&T cDNA Resource Center (Rolla, MO). Antibodies for detection of phospho-ERK1/2(Thr202/Tyr204), ERK1/2, phospho-Akt (Ser473), Akt and GAPDH were purchased from Cell Signaling Technologies (Beverly, MA). Protease inhibitor cocktail was from Roche Diagnostics (Indianapolis, IN). BQ123 and BQ 788 were from Sigma Chemical Company (St Louis, MO).
Pulmonary Artery Smooth Muscle Cells (PASMC)
Normal, BMPR2 and iPAH PASMC were derived at the Cleveland Clinic Foundation as described (Comhair et al., 2012). These consisted of PASMC from three donor control subjects (CONTROL-1, CONTROL-2 and CONTROL-3), three samples from iPAH subjects (IPAH-1, IPAH-2 and IPAH-3), and two samples from patients with BMPR2 mutation (HPAH-1 and HPAH-2) (Aldred et al., 2010). A sample (HPAH-3) from a subject with Smad-8 (gene symbol, SMAD9) mutation (R294X) was also included in the study (Drake et al., 2011). The patients with PAH were identified based on the National Institutes of Health (NIH) registry diagnostic criteria for pulmonary hypertension. The healthy controls were individuals with no history of pulmonary or cardiac disease or symptoms. More detailed information of those subjects is described in Table I. PASMC were isolated from elastic pulmonary arteries (>500-μm diameter) dissected from lungs obtained at explantation during lung transplant. Briefly, after removal of endothelial cells, PASMC were dissociated by digestion with collagenase type II/DNase I solution overnight at 37°C (Comhair et al., 2012). Cells were cultured in 15 mM HEPES buffered DMEM/F12 (50:50) media (Mediatech, Manassas, VA) containing 10% fetal bovine serum (FBS) (Lonza), and 2.5% Antibiotic-Antimycotic from GIBCO (cat. no. 15240). Cells were passaged at 60–90% confluence by dissociation from plates with 0.05% trypsin and 0.53 mM EDTA. The smooth muscle phenotype of cultured cells was confirmed (>97% purity) by immunohistochemistry and flow cytometric analysis with antibodies against smooth muscle α-actin and calponin (Aytekin et al., 2008). Primary cultures of passages 6-10 were used in experiments.
Table I.
Characteristics of Pulmonary Arterial Smooth Muscle Cells Studied
| Subject | Gender | Disease | Age | Germline Mutation |
|---|---|---|---|---|
| Donor Controls | ||||
| CONTROL-1 | male | donor lung | 36 | none |
| CONTROL-2 | male | donor lung | 39 | none |
| CONTROL-3 | female | donor lung | 48 | none |
| Idiopathic PAH | ||||
| IPAH-1 | female | IPAH | 34 | none |
| IPAH-2 | female | IPAH | 30 | none |
| IPAH-3 | male | IPAH | 42 | none |
| Heritable PAH | ||||
| HPAH-1 | male | HPAH | 41 | Deletion Exon 1-8 |
| HPAH-2 | female | HPAH | 50 | Deletion Exon 4-5 |
| HPAH-3 | female | HPAH | 26 | Smad-8 R294X |
Chinese Hamster Ovary (CHO) cells
The CHO cells were cultured in F-12K growth media (Cellgro, Mediatech, Manassas, VA) containing 10% FBS supplemented with 50 units/ml penicillin and 50 ug/ml streptomycin at 37 °C in a humidified CO2 (5%) incubator. ETA or ETB receptor cDNA from Missouri S&T cDNA Resource Center was subcloned into our bicistronic expression vector pcMIN (Zhou et al., 2000). CHO cells were stably transfected with the receptor cDNAs using Lipofectamine 2000 according to the protocol of the manufacturer (Invitrogen, Carlsbad, CA) and selected in the presence of 0.5 mg/ml geneticin (G418) (Promega, Madison, WI). This resulted in two separate populations of CHO cells expressing either the ETA or ETB receptors. To develop cell line expressing both ETA and ETB receptors, we used a bicistronic vector with the Zeocin selection gene for the second receptor.
Real-time PCR
Total RNA was extracted from PASMC using the RNeasy kit (Qiagen, Valencia, CA). RNA was then subjected to reverse transcriptase-PCR using the Superscript III First Strand Synthesis System (Invitrogen, Carlsbad, CA). Negative controls were performed without the reverse transcriptase. The resultant cDNA was used to conduct Taqman real time PCR on the Applied Biosystems 7300 Real-Time PCR System (Applied Biosystems, Foster City, CA). Taqman reagents for detecting mRNA expression of human ETA receptor (EDNRA, Hs00609865_m1), ETB receptor (EDNRB, Hs00240752_m1) and human GAPDH (Hs99999905_m1) were purchased from Applied Biosystems (Foster City, CA). Cycling parameters were as follows: 50°C for 2 minutes, 95°C for 10 minutes, 45 cycles of 95°C for 15 seconds, and 60°C for 1 minute. Results are presented as relative expression normalized to GAPDH and were calculated using the ΔΔCt method as described in the Applied Biosystems publication, “Guide to Performing Relative Quantitation of Gene Expression Using Real-Time Quantitative PCR” (4371095 Rev B).
[3H]BQ123 Binding Assay
The confluent cell monolayers of the intact CHO or PASMC in 24-well plates were incubated in binding buffer (50 mmol/L Tris, 120 mmol/L NaCl, 4 mmol/L KCl, 10 μg/ml bacitracin, 10 mmol/L glucose, 0.1% BSA, 1 mmol/L CaCl2, 5 mmol/L MgCl2, 10 mmol/L HEPES pH7.35) containing various concentrations of [3H]-BQ123 ranging from 0.04 to 10 nM in the absence (total binding) or presence of 100 nM unlabeled BQ123 (nonspecific binding) for 2 hours at 4°C. Cells were washed three times with ice-cold binding buffer and then solubilized with 0.2% SDS. Radioactivity was determined with a Packard Tri-Carb 1900TR Liquid Scintillation Counter (Packard Inc, Prospect, CT) after addition of 2 ml of Ecolite scintillation fluid (ICN Biomedical, Inc., Aurora, OH). Equilibrium binding data (Kd and Bmax) were analyzed by best fit to a single site model using the SigmaPlot® 11 program (SPSS Inc., Chicago, IL).
[125I] Endothelin-1 Binding Assay
[125I]-Endothelin-1 Ligand Binding experiments were carried out as described by Wu-Wong (2002). Confluent cells in 24 well plates were preincubated in ice cold binding buffer (140 mM NaCl, 5 mM KCl, 1.8 mM CaCl2, 0.8 mM MgSO4, 5 mM glucose, 25 mM HEPES, 0.1% BSA, pH 7.4) for 15 minutes. 125I labeled ET-1 was mixed with cold ET-1 to obtain a concentration of 0.25 nM. Cells were incubated with the labeled ET-1 for total binding and with the labeled ET-1 plus 1 μM cold ET-1 for nonspecific binding. After incubation on ice for 2 hours, the cells were washed three times with 1 ml binding buffer per well, solubilized with 0.2 % SDS, and radioactivity determined with a with a Packard Cobra II Auto-gamma Counter (Packard Inc, Prospect, CT). Preliminary experiments with CHO cells expressing only ETA receptors showed that BQ123 at 1 uM completely blocked ET-1 binding. Binding of ET-1 to CHO cells expressing only the ETB receptor was not affected by BQ123. For experiments with PASMC which express both the ETA and ETB receptors, we bound ET-1 in the presence of BQ123 to estimate the number of ETB receptors. ETA receptor numbers were calculated by subtracting ETB receptor numbers from the total receptor numbers.
Intracellular Calcium
The intracellular Ca2+ concentration was determined as previously reported (Prado et al., 1998). The PASMC or CHO cells were trypsinized and washed two times in physiological buffer solution (140 mM NaCl, 5 mM KCl, 1 mM MgCl2, 10 mM glucose, 0.9 mM CaCl2, 15 mM HEPES, 0.1% BSA). The cells were resuspended at 1.5 × 10⁷ cells/ml and incubated with 2 μM Fura-2/AM for 30 minutes. The cell suspension was then diluted 5 times with physiological buffer solution and incubated for another 15 minutes. Cells were pelleted and resuspended at 1 × 10⁶ cells/ml. The measurement of intracellular Ca2+ was performed using a Hitachi F-2500 Fluorescence Spectrophotometer with FL solutions 2.0 program (Hitachi Inc., Tokyo, Japan). The maximal response to ET-1 was analyzed by best fit to a single site model using the SigmaPlot® 11 program (SPSS Inc., Chicago, IL).
Real-time impedance-based detection of smooth muscle cell contraction
Measurements of PASMC contractions were performed using the xCELLigence Real-Time Cell Analyzer DP (Roche Applied Science, Indianapolis, IN) inside a 37°C cell culture incubator. PASMC were seeded at a density of 4500 cells/well on an E-plate 16 (Roche Applied Science) in 10% FBS growth medium. All controls and treatments in these experiments were performed in triplicate. After growing for approximately 24 hours, appropriate wells were pre-incubated with respective inhibitors or vehicle for 30 minutes. After pre-incubation, indicated amounts of ET-1 or vehicle were added for the given time period. In order to record ET-1 induced short-term morphology changes, the instrument recorded measurements of cell impedance every 30 seconds for 1 hour after adding ET-1. Cell index is the unit less measure of cell impedance and normalized cell index is the cell index value at a time point divided by value of cell index at an earlier starting or reference point.
Phospho-Antibody Array Analysis
The phospho-antibody array analysis was performed using the Proteome Profiler Human Phospho-Kinase Array Kit ARY003 from R&D Systems according to the manufacturer’s instructions. Briefly, PASMC were serum starved for 2 hours and then stimulated with 10 nM ET-1 with or without 1 uM BQ123 for 5 minutes. Cells were lysed with Lysis Buffer 6 (R&D Systems) and agitated for 30 minutes at 4°C. Cell lysates were clarified by microcentrifugation at 14,000 × g for 5 minutes, and the supernatants were subjected to protein assay. Preblocked nitrocellulose membranes of the Human Phospho-Kinase Array were incubated with ~500 μg of cellular extract overnight at 4 °C on a rocking platform. The membranes were washed three times with 1x Wash Buffer (R&D Systems) to remove unbound proteins and then were incubated with a mixture of biotinylated detection antibodies and streptavidin-HRP antibodies. Chemiluminescent detection reagents were applied to detect spot densities. Array images were analyzed using the NIH ImageJ image analysis software. The averaged density of duplicate spots representing each phosphorylated kinase protein was determined and used for the relative changes in phosphorylated kinase proteins. The list of target capture antibodies and their positions on the arrays can be found at http://www.rndsystems.com/pdf/ARY003.pdf.
Western Blot Analysis
PASMC were incubated with 10 nM endothelin-1 for 5 minutes. The cells were then washed twice with ice-cold PBS. Cell lysates were prepared by addition of ice-cold RIPA buffer, 150 mM NaCl, 1.0% Igepal CA-630, 0.5% sodium deoxycholate, 0.1% SDS, 50 mM Tris, pH 8.0 (Sigma, St Louis, MO) and 1x complete protease inhibitor cocktail (Roche Applied Science, Indianapolis, IN) and centrifuged at 12,000 rpm in a microcentrifuge at 4°C for 20 minutes. The proteins were fractionated on 10% SDS-PAGE gels and western blots were carried out using antibodies against phosphorylated ERK1/2 or Akt. Proteins were detected by chemiluminescence and the film scanned with an Epson Perfection 3170 scanner using Epson Scan (version 1.22A) software. The image was then analyzed using the NIH ImageJ image analysis software to determine the intensity of each band.
Statistical Analysis and Data Analysis
Statistical evaluation of the data was carried out using the Student t-test. Probability values less than 0.05 were considered significant.
Results
Ca2+ influx in response to ET-1 in normal (control) and PAH PASMC
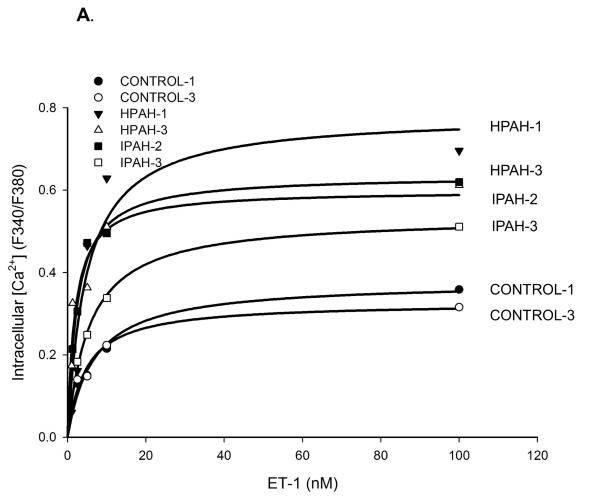
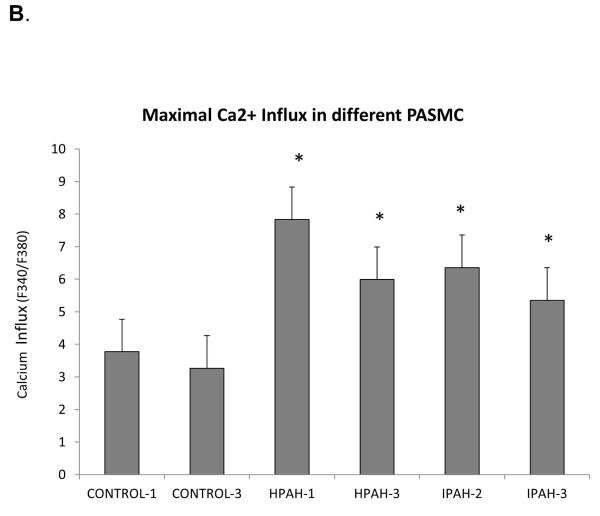
Calcium ion influx is an important determinant of smooth muscle contraction (Kuhr et al., 2012). We measured the influx in response to ET-1 to investigate the differences among the donor control, the BMPR2 deletion PAH and iPAH PASMC. We found cells obtained from all the PAH patients displayed a more robust Ca2+ influx compared to non PAH cells (Fig. 1A). The maximal influx response, as shown in Fig. 1B, illustrates that the maximal intake in all the PAH cells was approximately two fold of the normal controls.
Figure 1. ET-1 induced Ca2+ mobilization in the PASMC from normal control, hPAH and iPAH subjects.
A) The dose-response curves of ET-1 induced calcium mobilization were measured in the normal control, hPAH and iPAH PASMC as described in Materials and Methods. B) The maximal response of ET-1 induced Ca2+ influx was calculated with SigmaPlot 11 software. * The maximal Ca2+ response was significantly stronger in all the PASMC from hPAH or iPAH subjects compared with normal control cells (p < 0.05). There are no significant differences in maximal Ca2+ response among PASMC from hPAH and iPAH patients.
Endothelin-1 induced constriction of PASMCs
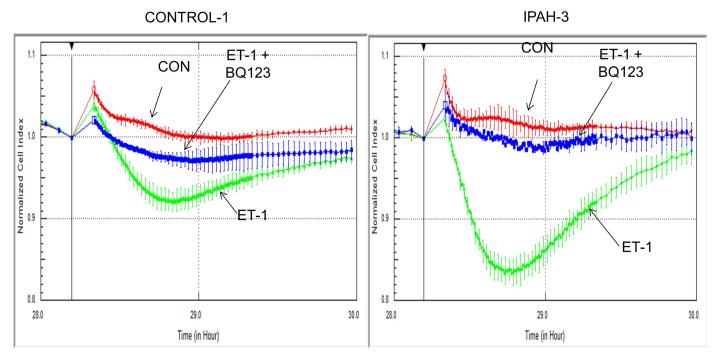
In conjunction with the Ca2+ influx studies and as a further proof of concept we measured constriction of PASMC in CONTROL-1 and IPAH-3 cells. Cellular constriction was determined as change in cell size as measured by impedance (Yu et al., 2005). IPAH-3 derived PASMC was chosen as a typical PAH example. This PASMC population displayed a sizable Ca2+ influx divergence from the normal donor CONTROL-1. Results are shown in Fig. 2. The PAH cells displayed a markedly stronger constrictive response to ET-1 when compared to normal control cells. Exposure to BQ123, an ETA blocker, showed that much but not all the constriction was due to the action of ETA receptor in the IPAH-3 cells while in the normal cells constriction was shared approximately equally between the ETA and ETB receptors.
Figure 2. Endothelin-1 induced cell constriction in normal CONTROL-1 and IPAH-3 PASMC.
Cellular constriction was determined as change in cell size measured by impedance as described in Material and Methods. CONTROL-1 and IPAH-3 PASMC were chosen for the assay. RED = no ET-1 added, GREEN = 10 nM ET-1 stimulated, BLUE = 10 nM ET-1 + 1 uM BQ123 added.
ETA and ETB receptor mRNA expression in the PASMC from control, hPAH and iPAH subjects
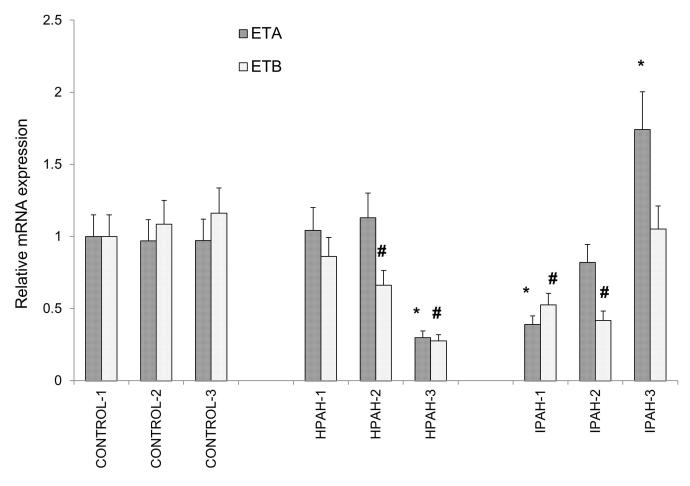
The mRNA expression of the two ET-1 receptors, ETA and ETB in the various PASMC was measured by real-time PCR using the Taqman method. The analyzed results are shown in Fig. 3. The three donor control cell populations, displayed very similar expression of both ETA and ETB. In hPAH samples, the ETA mRNA levels in the two BMPR2 mutated PASMC (HPAH-1 and HPAH-2) showed little change from the normal controls, while ETA mRNA levels went way down in the SMAD mutation, HPAH-3. In iPAH PASMC, the expression of ETA remained unchanged in IPAH-2; increased significantly in IPAH-3; and decreased sizably in IPAH-1. The pattern of ETB receptor expression differed from that of ETA. Compared to normal control, the ETB mRNA level was not changed in one BMPR2 mutated PAH (HPAH-1) and one iPAH (IPAH-3) sample. It was reduced in all the other PAH samples.
Figure 3. mRNA levels of endothelin receptor type A (ETA) and type B (ETB) in the normal control and PAH PASMC.
Results are presented as relative expression normalized to GAPDH and were calculated using the ΔΔCt method. The mRNA level from CONTROL-1 samples was set as 1. * p < 0.05 compared with the ETA expression level of CONTROL-1. # p < 0.05 compared with ETB expression level from CONTROL-1 PASMC.
ETA and ETB receptor number per cell
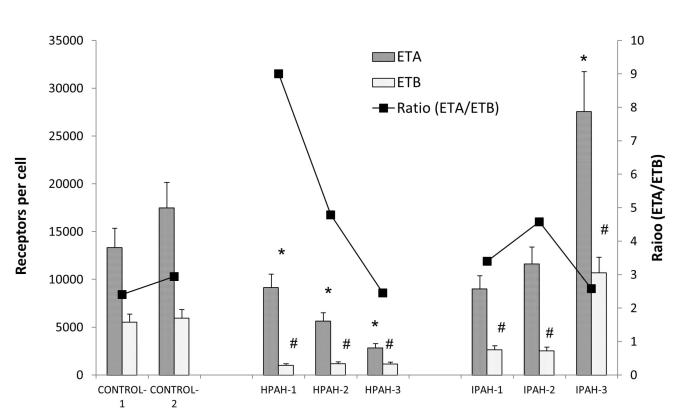
We then measured receptor (ETA or ETB) number per cell in the PASMC with [125I] Endothelin-1 binding assay (Fig. 4). The receptor number of both receptors was generally reduced in the PAH cells. Both the ETA and ETB receptor number decreased in the two BMPR2 (HPAH-1 and HPAH-2) mutant PAH PASMC compared with normal control cells. The ETB receptor displayed a particularly low number in the two BMPR2 mutant cells. The PASMC from iPAH patients also generally displayed a reduction but with a more variable pattern. While IPAH-1 and IPAH-2 showed a loss of both receptors, IPAH-3 showed a sizable increase of both. As ETB receptor number is markedly down in many PAH PASMC samples, ETA number remains at a functional level. We also calculated the ratio of ETA/ETB receptors which determines ET-1 function in PASMC. We found in the normal PASMC, the ratio of ETA/ETB is about 2.4 to 2.9. This ratio increased remarkably in the PASMC from PAH patients with BMPR2 mutation (9.0 and 4.8), whereas it remained unchanged in the SMAD-8 mutation (2.4). The ETA/ETB ratio in the IPAH samples also either increased (3.4 and 4.6) or remained unchanged at 2.6 in the IPAH-3 cell population. [3H] labeled BQ123 was used to compare the ETA receptor kinetics in control and PAH cells. The binding curves are illustrated in Supplement Fig. 1. No significant change in Kd was observed among normal and PAH PASMC.
Figure 4. ETA and ETB receptor sites per cell in control and PAH PASMC.
The receptor sites per cell were determined as described in the Material and Methods. The ratio of ETA/ETB is presented as a line graph. * p < 0.05 compared with the ETA sites per cell in CONTROL-1 PASMC. # p < 0.05 compared with the ETB sites per cell in CONTROL-1 PASMC.
Clearly in some cases mRNA expression did not reflect protein expression. That is because of the plethora of regulatory mechanisms functioning between transcription and translation, such as post-transcriptional regulation, translational regulation and post-translational regulation including the half-life of the proteins and protein trafficking to the membrane.
Effectiveness of ETA and ETB receptor blockers
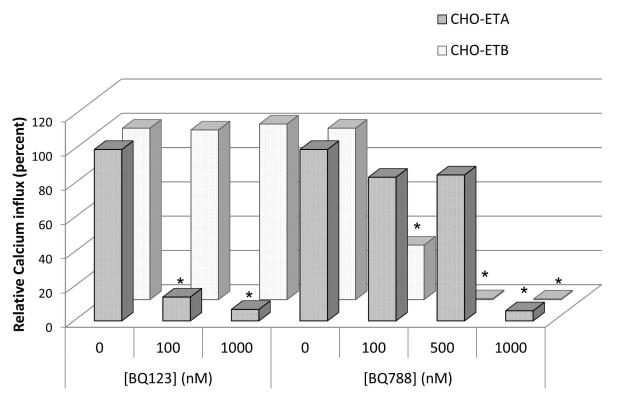
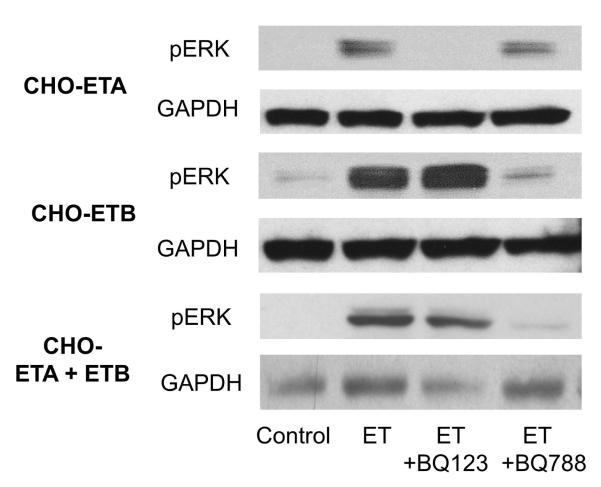
Before proceeding to separate the signaling actions emanating from the ETA and ETB receptors in PASMC, we used CHO cells stably transfected with ETA (CHO-ETA) or ETB (CHO-ETB) to assess signal strength and the blocking effectiveness of the ET-1 receptor antagonists BQ123 (vs ETA) and BQ788 (vs ETB). CHO cells do not express either ET-1 receptor endogenously. Thus, working with these cells provided an opportunity to characterize the actions of ETA and ETB receptors separately and individually before proceeding with studies with the PASMC which express both ETA and ETB receptors. Both ETA and ETB receptors were expressed approximaly equally at 2×10⁵ receptors/cell in the CHO-ETA or CHO-ETB cells. Calcium ion influx and ERK activation were used as measures to demonstrate the individual signaling contribution of the ETA or ETB receptors and the effectiveness of their inhibitors. As shown in Fig. 5, in the CHO-ETA cells, the ETA antagonist BQ123 inhibited ET-1 (10 nM) induced Ca2+ mobilization to approximately 87% at 100 nM, and 93% at 1000 nM. It had no effect on the action of the ETB receptor in CHO-ETB cells. On the other hand the ETB antagonist, BQ788, blocked the ETB receptor to only 70% at 100 nM. At 500 and 1000 nM it was 100% effective. However, at 500 nM it also blocked the actions of the ETA by 15% and at 1000 nM it blocked ETA completely. Thus the most commonly used ETB blocker, BQ788, has very limited specificity. In its presence, both ETA and ETB transduction are measured. For these reasons we used the action of the ETA receptor blocker, BQ123, which is highly ETA specific, to determine both ETB signaling (signaling in presence of BQ123) and ETA signaling (total ET-1 minus ETB caused signal). Both receptors can activate ERK as shown in CHO-ETA and CHO-ETB cell lines (Fig. 6). However, when ERK activation was compared between ETA and ETB transfected CHO cells, the ETB expressing cells activated ERK to much greater degree. In CHO cells expressing both ETA and ETB receptors, ETA receptor blocker, BQ123, did not inhibit ERK activation in response to ET-1 illustrating that ETB is the primary signaler when both receptors are present.
Figure 5. Effect of BQ123 and BQ788 on calcium influx in CHO cells transfected with ETA or ETB receptors.
Calcium ion mobilization was measured as described in Materials and Methods. The ET1 induced calcium influx was normalized as 100. The effect of the BQ123 or BQ788 was represented as the percent of ET-1 induced calcium influx. Three separate experiments showed similar results. * p < 0.05 compared with ET-1 stimulated calcium influx.
Figure 6. Effect of BQ123 on ERK activation in CHO cells stably transfected with ETA or ETB or both receptors.
The CHO cells expressing either ETA or ETB receptors were treated with 10 nM ET-1 with or without 1 mM BQ123 or 0.5 mM BQ788 for 5 minutes. After incubation the cell lysates were isolated and analyzed by western blot. GAPDH was used as a loading control.
Phospho-antibody array analysis of endothelin-1 signaling in normal and BMPR2 mutated PAMSC
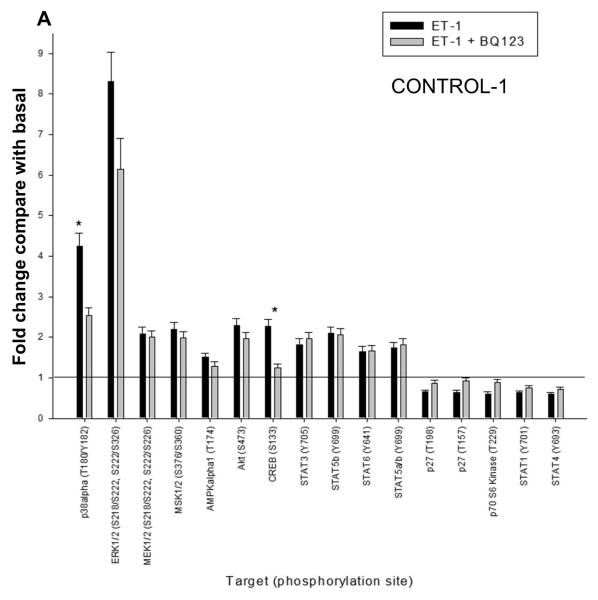
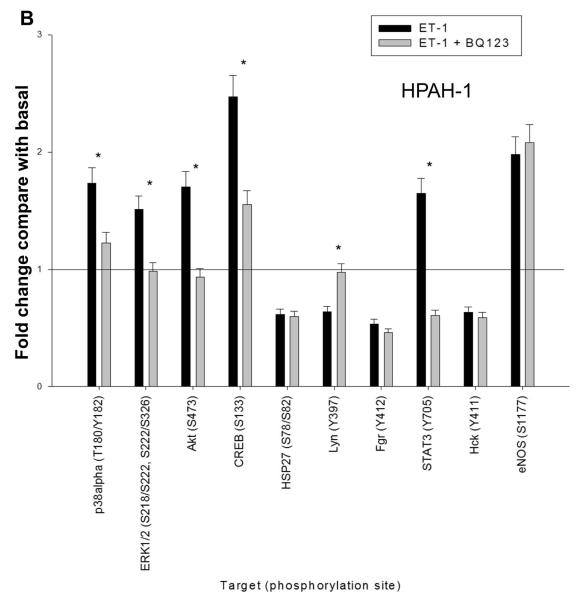
To gain a global picture of signal profile of the ETA and ETB receptors in PASMCs, we probed the ET-1 induced phosphokinase generation using human phospho-antibody array. Phosphoprotein array data were collected in normal (CONTROL-1) and BMPR2 deletion (HPAH-1) PASMC in response to ET-1 in the presence or absence of BQ123, an ETA antagonist. Using 1.5 fold increase or decrease as a cut-off point among the 46 phospho-antibodies spotted on the array, we found that the presence of 11 phospho-proteins were increased and 4 decreased in the CONTROL-1 population in response to ET-1. This is illustrated in Fig. 7A. As shown in Fig. 7B only 5 phospho-proteins increased and 4 decreased in the HPAH-1 cell in response to ET-1. Results with BQ123 show that the signal is mainly being transduced through the ETB receptor in the normal control PASMC (Fig. 7A). However, as seen by the effect of BQ123 in the BMPR2 deletion PASMC (Fig. 7B), the ET-1 stimulation is predominantly mediated through the ETA receptor in these cells. One important exception is CREB (cAMP response element-binding). The phosphorylated form of this transcription factor increased 2.5 fold in response to ET-1 through the ETA receptor in both CONTROL-1 and the HPAH-1 PASMC. This would be expected since the ETA receptor and not the ETB receptor functions through Gαs and thus is responsible for cAMP production (Masaki et al., 1999). It has been shown that the CREB family of transcription factors are activated in hypoxic lungs (Leonard et al., 2008). Akt and ERK were both (relative to other kinases) strongly activated by ET-1 in both PASMC populations. More extensive phospho-protein array results are presented in Supplement Fig. 2A and Supplement Table I. Generally, the phospho-protein profiling suggested that the normal PASMC are markedly more responsive to ET-1 stiumulation (Supplement Fig. 2B).
Figure 7. ET-1 mediated phosphorylation events in CONTROL-1 and HPAH-1 PASMC.
The human phospho-antibody array detected phosphorylated proteins in untreated and treated cell lysates from donor control CONTROL-1 (A) and BMPR2 deletion HPAH-1 PASMC (B). The cells were either left untreated or treated with 10 nM ET-1 for 5 minutes with or without 1 uM BQ123. Profiles were created by quantifying the mean spot pixel densities normalized by positive control dots. Array signals from scanned X-ray film images were analyzed using image analysis software NIH ImageJ. The effect of ET-1 or ET1 + BQ123 was presented as fold change compared with the basal level of untreated sample. Only the targets with the fold change greater than 1.5 or less than 0.67 upon ET-1 stimulation were presented. The statistical analysis was performed using t-test. * p < 0.05 compared with untreated basal.
ERK and Akt activation and the signaling contribution of ETA and ETB receptors in PASMC from control and PAH subjects
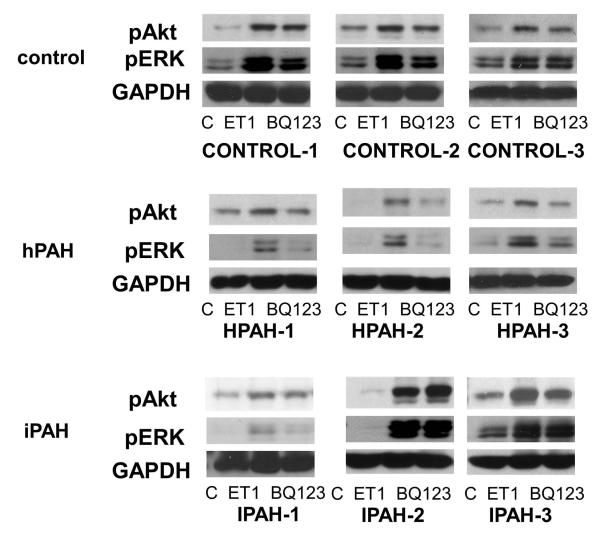
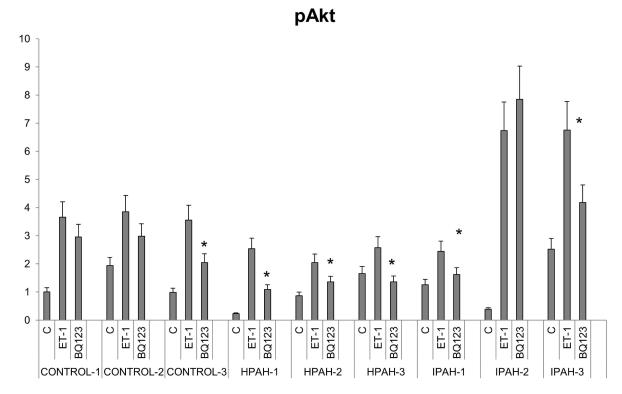
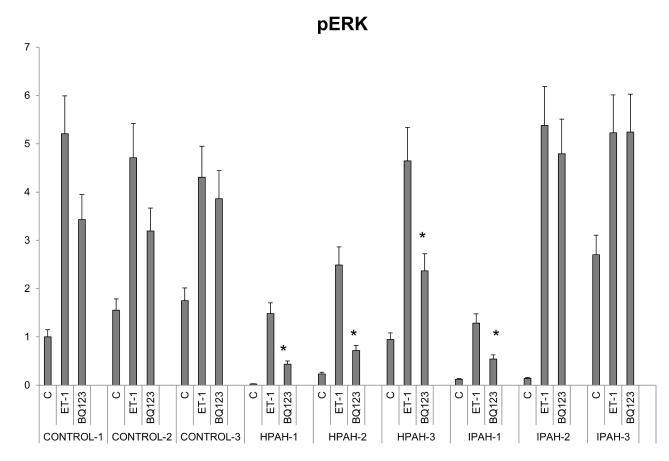
Akt and ERK activation strength by ET-1 and the individual roles of ETA and ETB receptors signal transmission were examined by western procedure in normal and PAH derived PASMC. The ETA agonist, BQ123, was used to separate the actions of ETA and ETB. The results are shown in Fig. 8A as western blots and Fig. 8B, Fig. 8C as bar graph calculations. The results of ERK and Akt phosphorylation from western analysis showed a similar pattern as the phospho-protein array data. PASMC from all three normal control subjects responded to 10 nM ET-1 by activating Akt and ERK. BQ123 showed limited inhibitory effects on the normal cell population signal transmission. The ETB receptor was thus clearly the major mediator of ET-1 in the activation of these two kinases. Two cell lines from PAH subjects with BMPR2 exon deletions illustrated a switch in these cells to a primary activation of these kinases through the ETA receptor. Additionally, the total signal activation of Akt and ERK proved considerably weaker than in normal PASMC. The Smad-8 mutation PASMC (HPAH-3) showed a similar pattern as the two BMPR2 mutated PASMC. ET-1 is less effective in activating Akt and ERK in these hPAH cells compared with normal PASMC, and the activation is mainly through the ETA receptor. The results with iPAH proved more variable. Compared to the normal controls, stronger Akt, but similar ERK activation in response to ET-1 was observed in the IPAH-2 and IPAH-3. However, in contrast to the BMPR2 mutation cells, BQ123 failed to shut down ET-1 induced ERK phosphorylation in both cell populations. This demonstrates that ET-1 induced ERK activation through the ETB receptor persists in these iPAH cell populations. Although BQ123 has no inhibitory effect on ET-1 activation of Akt in IPAH-2 cells, it partially inhibited this activation in the IPAH-3 cells. The IPAH-1 cells responded poorly to ET-1. However, in this case BQ123 did shut down ERK activation by ET-1 illustrating that in this population of cells ERK activation is taking place through the ETA receptor.
Figure 8. ERK and Akt activation in the human PASMC.
A. Human PASMC from control and PAH subjects were incubated with or without 10 nM ET-1 for 5 minutes with or without 1 uM BQ123. After incubation, the cytosolic extracts were isolated and analyzed by Western blot. GAPDH was used as a loading control. B. The quantitation of the p-Akt is illustrated as a bar graph which shows fold change in spot intensity of the bands normalized with GAPDH with basal level as 1. * p< 0.05 compared with WT. C. The quantitation of the p-ERK is illustrated as a bar graph using the same procedure as previously described.
Discussion
The pulmonary vascular smooth muscle plays a crucial role in the etiology of PAH (Humbert et al., 2004). Herein we focused on vascular smooth muscle cells from donor control, hPAH and iPAH lungs. We have utilized all smooth muscle cell sources, in primary culture, available to us. The cells were derived from pulmonary arteries of the lungs transplanted from patients with iPAH and PAH with genetic origins (hPAH). Although larger sample sizes will ultimately provide more accurate results, the findings reported thus far are proving very enlightening.
Our results clearly illustrate that ETA and ETB mRNA and receptor number levels in normal control PASMC are very consistent from one cell sample to another. The ET-1 receptor expression shows more variation in cell samples from PAH patients. Of course this is to be expected because of the varied etiologies of the disease. Nevertheless an overall trend is strongly evident. ETB mRNA expression is down regulated while ETA expression generally remains close to that of the normal control cells. Both the ETA and ETB receptor number per cell are reduced in the genetically mutated BMPR2 and SMAD-8 PAH. In idiopathic PAH this trend is more variable. Again this would be anticipated. For example, the IPAH-3 cells actually express increased ETA and ETB receptor numbers. It is likely that the decrease in the ETB receptor number is a negative event in PAH leading to increased influence of the ETA. It is also possible that in the cases of lowered ETA receptor number, it is a physiologic attempt at decreasing its negative action. Other reports carried out determining ETB/ETA receptor expression have been done in whole lung using staining procedures or transcriptional, not translational, determinations. For example, de Lagausie et al. (2005) reported that in newborns with PAH both ETB and ETA receptors are increased in the whole lung. Using similar methods, Talati et al. (2010) found that ETA and ETB expression was decreased in lung macrophages from hPAH, but not iPAH, patients compared with controls.
It is interesting to conjecture that decreasing ETA/ETB levels would result in increased circulating ET-1 concentrations. Indeed, plasma ET-1 levels are elevated in PAH patients and serve as a prognostic factor (Cody et al., 1992). Over-expression of ET-1 has also been reported in the plexogenic lesions of PAH patients (Giaid et al., 1993). However, the aim of this manuscript was to elucidate the signal transduction of the endothelin-1 receptor A and B in normal and PAH PASMCs. It is noteworthy that when we looked at the effect of ET-1 concentration on signaling by normal and PAH cells we found no ET-1 concentration dependent signaling differences between these two cell populations.
Clearly, basic signaling research on the ET-1 receptors in vascular smooth muscle cells is in critical need. Regardless of the ET-1 receptor number expressed, in the PAH derived cells, Ca2+ influx and smooth muscle cell constriction are clearly increased in response to ET-1. Increased Ca2+ influx is seen in all PAH smooth muscle cell samples regardless of their receptor/cell expression. This includes the IPAH-3 cells, which were the only samples to actually express an increased number of both ETA and ETB receptors per cell compared to control, as well as the BMPR2 mutated HPAH-1 cells, which show a great reduction in ETB receptor number but also a reduction in ETA receptor number. This suggests that the effect for increased Ca2+ influx by ET-1 is taking place downstream of the ET-1 receptors.
At this time very little is understood as to the signal cascades participating in the etiology of PAH. Our results herein represent initial attempts at understanding this area not only with regard to ET-1, but at a wider scope to unravel what signals are promoted or decreased in PAH. Our phospho-protein array results with normal control PASMC illustrated Akt and ERK to be very strongly activated by ET-1, and furthermore that the ETB receptor is clearly the ET-1 activator. Results with the ETA/ETB cDNA stably transfected CHO cells illustrated that indeed ETB is the dominant MAP kinase signal transmitter when both receptors are present in a cell. Phospho-protein array data in PASMC from BMPR2 mutation HPAH-1 cells showed that the strength of the ET-1 activation is reduced and that the ETA receptor becomes the dominant signaler. With all that in mind, we proceeded to determine ERK and Akt activation by ET-1 in genetically initiated PAH and in iPAH cell populations in comparison to normal control. In the genetic BMPR2 PAH and SMAD-8 mutation PAH, the total activation of these two kinases is clearly reduced. Also, their activation, which occurs primarily through the ETB receptor in the normal control PASMC, is switched to activation via the ETA receptor. This was not seen in the iPAH cells. The ETB receptor continued as the principal kinase activator, suggesting that at least some mechanisms involved in the BMPR2 PAH and iPAH may be divergent.
Clearly, much more work is needed to pinpoint deleterious signaling promoted by ET-1 and other effectors in the initiation and progression of PAH. However, with regard to the BMPR2 and SMAD mutation related PAHs, data here suggest that in the progression of this type of PAH the loss of ETB promoted signaling is an issue and that the decrease in total Akt and ERK activation may be a critical aspect. The differences in ET-1 receptor numbers and receptor promoted signaling in the iPAHs underscores the likely divergent origin of these PAHs. It is interesting that regardless of the PAH origin Ca2+ flux in response to ET-1 increases despite the overall decrease in ETA receptor number in most of the PAH samples.
Clearly endothelin-1 signal capacities differ depending on the etiology of PAH. These observations lead us to suggest that treatment with ET-1 blockers should be done with caution. For example, we are finding that due to very low expression of ETB receptor number its signaling becomes minimal in certain forms of PAH, particularly mutated BMPR2 derived PAH. ETB by a number of accounts is often physiologically beneficial (Dupuis et al., 1996). Therefore further blockage of this receptor action may often not be beneficial in the treatment of the disease. Within the idiopathic category considerable variation exists. In certain iPAHs such as the IPAH-3 subject, with higher levels of both ETA and ETB receptors, the use of a double antagonist such as bosentan may be beneficial, while in other iPAH such as IPAH-1 the expression and signal efficacy of both ETA and ETB receptor are decreased. In this case the use of any endothelin receptor blocker may be irrelevant. At this time our signaling results cannot distinguish whether alterations in receptor expressions are the source or consequence in pulmonary hypertension.
Supplementary Material
Supplement Figure 1. [3H]-BQ123 binding assay. Binding curve of the normal control and PAH PASMC. Ligand binding experiments were carried out using [3H]-BQ123 on PASMC at concentrations ranging from 0.04 to 10 nM. The dissociation constant (Kd) and maximal binding (Bmax) were calculated using the SigmaPlot® 11.0 Program Pharmacology Module (SPSS Inc.). Each Point is the average of cells from triplicate wells ± S.E. from a representative experiment of three experiments.
Supplement Figure 2. Phosphorylation events induced by ET-1 measured by human phospho-antibody array analysis in CONTROL-1 and HPAH-1 PASMC. (A) Representative blots for the phospho-antibody array analysis from CONTROL-1 and HPAH-1 PASMC under different treatments. The list of target antibodies and their positions on the arrays can be found at http://www.rndsystems.com/pdf/ARY003.pdf. Basal: nonstimulation; ET-1: 10 nM ET-1 stimulation for 5 minutes; 10 nM ET-1 + 1 mM BQ123, 10 nM ET-1 and 1 mM BQ123 stimulation for 5 min. (B) bar graph represents the effect of ET-1 on the phosphorylation events in the CONTROL-1 and IPAH-1 PASMC. Cut-off value 1.5 fold was used. * p< 0.05 compared with fold change in CONTROL-1 PASMC.
Acknowledgments
This work was supported by NIH Grant number HL025776. We thank The Cleveland Clinic Pathobiology Tissue Sample and Cell Culture Core (supported by NIH PO1 HL081064 and RC37 HL60917) and Dr. Marlene Rabinovitch, Stanford University under the Pulmonary Hypertension Breakthrough Initiative (PHBI, supported by the Cardiovascular Medical Research and Education Fund) for pulmonary smooth muscle cell samples. We also like to thank Dr. Johnathan Whetstine at MGH Cancer Center for use of his xCelligence RTCA system.
Contract grant sponsor: National Heart, Lung, and Blood Institute, National Institutes of Health Contract grant number: HL025776
Footnotes
Disclosure None.
References
- Aldred MA, Comhair SA, Varella-Garcia M, Asosingh K, Xu W, Noon GP, Thistlethwaite PA, Tuder RM, Erzurum SC, Geraci MW, Coldren CD. Somatic Chromosome Abnormalities in the Lungs of Patients with Pulmonary Arterial Hypertension. Am J Respir Crit Care Med. 2010;182(9):1153–1160. doi: 10.1164/rccm.201003-0491OC. [DOI] [PMC free article] [PubMed] [Google Scholar]
- Aytekin M, Comhair SAA, de la Motte C, Bandyopadhyay SK, Farver CF, Hascall VC, Erzurum SC, Dweik RA. High levels of hyaluronan in idiopathic pulmonary arterial hypertension. American Journal of Physiology - Lung Cellular and Molecular Physiology. 2008;295(5):L789–L799. doi: 10.1152/ajplung.90306.2008. [DOI] [PMC free article] [PubMed] [Google Scholar]
- Cody RJ, Haas GJ, Binkley PF, Capers Q, Kelley R. Plasma endothelin correlates with the extent of pulmonary hypertension in patients with chronic congestive heart failure. Circulation. 1992;85(2):504–509. doi: 10.1161/01.cir.85.2.504. [DOI] [PubMed] [Google Scholar]
- Comhair SA, Xu W, Mavrakis L, Aldred MA, Asosingh K, Erzurum SC. Human Primary Lung Endothelial Cells in Culture. Am J Respir Cell Mol Biol. 2012 doi: 10.1165/rcmb.2011-0416TE. [DOI] [PMC free article] [PubMed] [Google Scholar]
- de Lagausie P, de Buys-Roessingh A, Ferkdadji L, Saada J, Aisenfisz S, Martinez-Vinson C, Fund X, Cayuela JM, Peuchmaur M, Mercier JC, Berrebi D. Endothelin receptor expression in human lungs of newborns with congenital diaphragmatic hernia. J Pathol. 2005;205(1):112–118. doi: 10.1002/path.1677. [DOI] [PubMed] [Google Scholar]
- Drake KM, Zygmunt D, Mavrakis L, Harbor P, Wang L, Comhair SA, Erzurum SC, Aldred MA. Altered MicroRNA Processing in Heritable Pulmonary Arterial Hypertension. American Journal of Respiratory and Critical Care Medicine. 2011;184(12):1400–1408. doi: 10.1164/rccm.201106-1130OC. [DOI] [PMC free article] [PubMed] [Google Scholar]
- Dupuis J, Stewart DJ, Cernacek P, Gosselin G. Human Pulmonary Circulation Is an Important Site for Both Clearance and Production of Endothelin-1. Circulation. 1996;94(7):1578–1584. doi: 10.1161/01.cir.94.7.1578. [DOI] [PubMed] [Google Scholar]
- Farber HW, Loscalzo J. Pulmonary Arterial Hypertension. New England Journal of Medicine. 2004;351(16):1655–1665. doi: 10.1056/NEJMra035488. [DOI] [PubMed] [Google Scholar]
- Giaid A, Yanagisawa M, Langleben D, Michel RP, Levy R, Shennib H, Kimura S, Masaki T, Duguid WP, Stewart DJ. Expression of Endothelin-1 in the Lungs of Patients with Pulmonary Hypertension. New England Journal of Medicine. 1993;328(24):1732–1739. doi: 10.1056/NEJM199306173282402. [DOI] [PubMed] [Google Scholar]
- Humbert M, Morrell NW, Archer SL, Stenmark KR, MacLean MR, Lang IM, Christman BW, Weir EK, Eickelberg O, Voelkel NF, Rabinovitch M. Cellular and molecular pathobiology of pulmonary arterial hypertension. Journal of the American College of Cardiology. 2004;43(12, Supplement 1):S13. doi: 10.1016/j.jacc.2004.02.029. [DOI] [PubMed] [Google Scholar]
- Kuhr FK, Smith KA, Song MY, Levitan I, Yuan JX-J. New mechanisms of pulmonary arterial hypertension: role of Ca2+ signaling. American Journal of Physiology - Heart and Circulatory Physiology. 2012;302(8):H1546–H1562. doi: 10.1152/ajpheart.00944.2011. [DOI] [PMC free article] [PubMed] [Google Scholar]
- Leonard MO, Howell K, Madden SF, Costello CM, Higgins DG, Taylor CT, McLoughlin P. Hypoxia Selectively Activates the CREB Family of Transcription Factors in the In Vivo Lung. American Journal of Respiratory and Critical Care Medicine. 2008;178(9):977–983. doi: 10.1164/rccm.200712-1890OC. [DOI] [PMC free article] [PubMed] [Google Scholar]
- Machado RD, Eickelberg O, Elliott CG, Geraci MW, Hanaoka M, Loyd JE, Newman JH, Phillips JA, Iii, Soubrier F, Trembath RC, Chung WK. Genetics and Genomics of Pulmonary Arterial Hypertension. Journal of the American College of Cardiology. 2009;54(1, Supplement):S32–S42. doi: 10.1016/j.jacc.2009.04.015. [DOI] [PMC free article] [PubMed] [Google Scholar]
- Masaki T, Ninomiya H, Sakamoto A, Okamoto Y. Structural basis of the function of endothelin receptor. Molecular and Cellular Biochemistry. 1999;190(1):153–156. [PubMed] [Google Scholar]
- Morrell NW, Adnot S, Archer SL, Dupuis J, Lloyd Jones P, MacLean MR, McMurtry IF, Stenmark KR, Thistlethwaite PA, Weissmann N, Yuan JXJ, Weir EK. Cellular and Molecular Basis of Pulmonary Arterial Hypertension. Journal of the American College of Cardiology. 2009;54(1, Supplement):S20–S31. doi: 10.1016/j.jacc.2009.04.018. [DOI] [PMC free article] [PubMed] [Google Scholar]
- Prado GN, Mierke DF, Pellegrini M, Taylor L, Polgar P. Motif mutation of bradykinin B2 receptor second intracellular loop and proximal C terminus is critical for signal transduction, internalization, and resensitization. J Biol Chem. 1998;273(50):33548–33555. doi: 10.1074/jbc.273.50.33548. [DOI] [PubMed] [Google Scholar]
- Talati M, West J, Blackwell TR, Loyd JE, Meyrick B. BMPR2 mutation alters the lung macrophage endothelin-1 cascade in a mouse model and patients with heritable pulmonary artery hypertension. American Journal of Physiology - Lung Cellular and Molecular Physiology. 2010;299(3):L363–L373. doi: 10.1152/ajplung.00295.2009. [DOI] [PMC free article] [PubMed] [Google Scholar]
- Trow TK, Taichman DB. Endothelin receptor blockade in the management of pulmonary arterial hypertension: Selective and dual antagonism. Respiratory Medicine. 2009;103(7):951–962. doi: 10.1016/j.rmed.2009.02.016. [DOI] [PubMed] [Google Scholar]
- Wu-Wong JR. Using Receptor Antagonists in Binding Studies to Characterize a Mammalian Endothelin Receptor. 2002. pp. 71–91. [DOI] [PubMed]
- Yu N, Atienza JM, Bernard J, Blanc S, Zhu J, Wang X, Xu X, Abassi YA. Real-Time Monitoring of Morphological Changes in Living Cells by Electronic Cell Sensor Arrays: An Approach To Study G Protein-Coupled Receptors. Analytical Chemistry. 2005;78(1):35–43. doi: 10.1021/ac051695v. [DOI] [PubMed] [Google Scholar]
- Zhou X, Prado GN, Taylor L, Yang X, Polgar P. Regulation of inducible bradykinin B1 receptor gene expression through absence of internalization and resensitization. J Cell Biochem. 2000;78(3):351–362. doi: 10.1002/1097-4644(20000901)78:3<351::aid-jcb1>3.0.co;2-u. [DOI] [PubMed] [Google Scholar]
Associated Data
This section collects any data citations, data availability statements, or supplementary materials included in this article.
Supplementary Materials
Supplement Figure 1. [3H]-BQ123 binding assay. Binding curve of the normal control and PAH PASMC. Ligand binding experiments were carried out using [3H]-BQ123 on PASMC at concentrations ranging from 0.04 to 10 nM. The dissociation constant (Kd) and maximal binding (Bmax) were calculated using the SigmaPlot® 11.0 Program Pharmacology Module (SPSS Inc.). Each Point is the average of cells from triplicate wells ± S.E. from a representative experiment of three experiments.
Supplement Figure 2. Phosphorylation events induced by ET-1 measured by human phospho-antibody array analysis in CONTROL-1 and HPAH-1 PASMC. (A) Representative blots for the phospho-antibody array analysis from CONTROL-1 and HPAH-1 PASMC under different treatments. The list of target antibodies and their positions on the arrays can be found at http://www.rndsystems.com/pdf/ARY003.pdf. Basal: nonstimulation; ET-1: 10 nM ET-1 stimulation for 5 minutes; 10 nM ET-1 + 1 mM BQ123, 10 nM ET-1 and 1 mM BQ123 stimulation for 5 min. (B) bar graph represents the effect of ET-1 on the phosphorylation events in the CONTROL-1 and IPAH-1 PASMC. Cut-off value 1.5 fold was used. * p< 0.05 compared with fold change in CONTROL-1 PASMC.


