Abstract
Endothelin-1 (ET-1) is a vasoactive peptide which signals through two G-protein coupled receptors, endothelin receptor A (ETA) and B (ETB). We determined that ET-1 activation of its ETB receptor in stably cDNA transfected CHO cells leads to a 55% reduction in cell number by end-point cell counting and a 35% decrease in cell growth by a real-time cell-substrate impedance-based assay after 24 hours of cell growth. When CHO ETB cells were synchronized in the late G1 cell cycle phase, ET-1 delayed their S phase progression compared to control by 30% as determined by [3H]-thymidine incorporation. On the other hand, no such delay was observed during late G2/M to G1 transit when cells were treated with ET-1 after release from mitotic arrest. Using the cell-substrate impedance-based assay, we observed that ET-1 induces opposing morphological changes in CHO ETA and CHO ETB cells with ETB causing an increase in the cell footprint and ETA a decrease. Likewise, in pulmonary artery smooth muscle cells, which express both ETA and ETB receptors, ET-1 induces an ETA-dependent contraction and an ETB dependent dilation. These results are shedding light on a possible beneficial role for ETB in diseases involving ET-1 dysfunction such as pulmonary hypertension.
Keywords: Endothelin-1, Endothelin receptor A, Endothelin receptor B, Cell proliferation, Contraction, Dilation
Introduction
Endothelin-1 (ET-1) is a vasoactive peptide which signals through two G-protein coupled receptors, endothelin receptor A (ETA) and B (ETB). In vascular tissue, ET-1 activation of ETA in smooth muscle cells leads to blood vessel contraction and proliferative regulation, while the activation of ETB in endothelial cells leads to vessel dilation and production of anti-proliferative effectors. These apparent anti-proliferative, vascular dilatory actions of the ETB receptor make its understanding especially pertinent to vascular diseases, such as pulmonary arterial hypertension (PAH).
Here we investigate differences in growth properties and short-term morphological changes in response to ET-1 in Chinese hamster ovary (CHO) cells stably and separately expressing ETA or ETB receptors. A stably transfected CHO system is advantageous for ET-1 growth studies in that these cells do not express endogenous ET-1 receptors [1, 2]. Thus growth effects of each receptor can be characterized by expressing each separately and at a constant level. This system is also effective since many cell types which express endogenous ET-1 receptors, such as human vascular smooth muscle cells, have very slow growth characteristics, and/or may show fluctuation (or complete absence) in ET-1 receptor expression under certain conditions (cell stress, passage number, etc.) [3-6].
Previous studies using stably cDNA transfected CHO cells expressing either ETA or ETB receptors have shown them to similarly promote phosphatidylinositol hydrolysis, arachidonic acid release from lipid stores and signals through a number of kinases [1, 7]. However, while ETA and ETB receptors share a number of signaling pathways, signaling differences have been reported. One such is the production of cAMP. While ETA stimulates cAMP accumulation through Gs alpha, ETB does not [1]. Clearly, other as yet unreported signaling differences exist.
Because of the apparent anti-proliferative, vascular dilatory actions of the ETB receptor, our objective in this study was to investigate ETB regulation of growth. Additionally, real-time cell-substrate impedance measurements were used to determine ET-1 induced morphological changes through ETA and ETB. The aim of this study was to investigate the possible opposing actions of ETA and ETB in cellular proliferation and vascular tone. These results should aid in better understanding of diseases involving ET-1 dysfunction.
Materials and Methods
Materials
Thymidine, [Methyl-3H] was purchased from Perkin Elmer. The c-Jun N-terminal kinases (JNK) and nitric oxide synthase (NOS) inhibitors, SP600125 and L-NG- nitroarginine methyl ester (L-NAME) were purchased from Cayman Chemical. The ET-1 receptor agonists, ET-1 and sarafotoxin (SFTX6c) were purchased from American Peptide. Inhibitors for phosphatidylinositol 3-kinases (PI3K) and MAPK/ERK kinase 1/2 (MEK1/2), LY294002 and U0126 were purchased from Calbiochem. Propidium iodide solution was purchased from Invitrogen. The rest of the chemicals, BQ123, BQ788, hydroxyurea, nocodazole and 2′-5′-dideoxyadenosine (DDA) were purchased from Sigma.
Cell culture
Two CHO cell lines were previously established which express human ETA (CHO ETA) and human ETB (CHO ETB). Briefly, these were created by cloning human ETA or ETB cDNA into a bicistronic pCMin vector which contains a neomycin gene for selection. Cells were maintained in F12K growth medium containing 10% FBS (Lonza, Basel, Switzerland) and 400 mg/L G418. Human pulmonary artery smooth muscle cells (hSMCs) obtained from Dr. Serpil Erzerum at the Clevelant Clinic (Cleveland, OH) were grown in DMEM/FI2 (50/50) 15 mM HEPES (Mediatech, Inc., Manassas, VA) containing 10% FBS (Lonza, Basel, Switzerland) and 2.5% Antibiotic-Antimycotic (Invitrogen, Carlsbad, CA).
Cell Counts
CHO ETB cells at 80-90% confluence were trypsinized and seeded on 24 well cell culture plates at a density of 50,000 cells per well on day 0. Cells were allowed to grow overnight in growth medium at 37°C. The next day, cells were treated with respective inhibitors and agonists and incubated for another 24 hours. All controls and treatments in these experiments were performed in triplicate. In some experiments, agonists were replenished each day. Starting 24 hours after agonist addition, cells in respective wells were collected for counting. This was done by aspirating the medium, washing 2Xs with PBS, trypsinizing and collecting the cell suspension in a vial of isoton solution. Vials containing suspended cells were counted using a Coulter particle counter.
Real-time detection of cell proliferation and morphological changes
Measurements of real-time cell proliferation and morphological changes were performed by a xCELLigence Real-Time Cell Analyzer MP or DP (Roche Applied Science, Indianapolis, IN) inside a 37°C cell culture incubator. The instrument measured cell-substrate impedance as cells attached and spread across electrode sensors on the surface of the plate [8]. CHO cells at 80-90% confluence were trypsinized and seeded at a density of 7500 cells per well on an E-plate 96 (Roche Applied Science, Indianapolis, IN) in growth medium at 37°C. hSMC were seeded at a density of 2500 cells/well on an E-plate 16 (Roche Applied Science) in growth medium. Optimal cell density was obtained by initially running a cell titration of 40,000, 20,000, 10,000, 5,000, 2,500, 1,250, 625 and 0 cells per well for determination of log growth. All controls and treatments in these experiments were performed in triplicate. After seeding, cells were allowed to attach and grow for 24 hours. Appropriate wells were pre-incubated with respective inhibitors or vehicle (serum-free medium) for 1 hour before adding indicated amounts of ET-1. In order to record ET-1 induced morphological changes, the instrument recorded measurements of cell impedance every 30 seconds for 1 hour after ET-1 addition. Following that hour, cell proliferation was recorded by real-time cell impedance measurements every 2 minutes for the given time period. These impedance measurements were expressed as cell index. Normalized cell index is the cell index value at a given time point divided by the cell index value at an earlier starting point.
[3H]-thymidine incorporation into DNA in CHO ETB synchronized cells treated with inhibitors and ET-1
CHO ETB cells at 80-90% confluence were trypsinized and seeded on 24 well cell culture plates at a density of 38,000 cells per well and allowed to grow overnight in growth medium at 37°C. All controls and treatments in these experiments were performed in triplicate. On the next day, old medium was decanted and cells were incubated with new growth medium containing 2 mM hydroxyurea for 19 hours. After incubation, the hydroxyurea medium was decanted, wells were washed with serum-free medium and fresh growth medium without hydroxyurea was added. If inhibitors were used, they were pre-incubated 30 minutes at indicated concentrations. ET-1 at indicated concentrations was added at time 0. Cells were then pulsed with [3H]- thymidine (0.5 uCi/mL) at 2 hour intervals for times indicated. After the 2 hours, each well was washed 2X with 1 mL ice cold PBS and incubated with 1 mL ice cold 10% TCA in 4°C for 30 minutes. After removing the 10% TCA and washing with PBS, [3H]- thymidine DNA was recovered with 0.5 ml of 0.5 N NaOH at room temperature. Recovered [3H]-thymidine DNA was added to a vial with 3 ml of scintillation fluid and mixed well. The vials were then read in a scintillation counter for 10 minute counts.
Flow cytometric analysis
CHO ETB cells were seeded on p60 plates and grown to 50% confluence. Next, the medium was changed to growth medium containing either 2 nM hydroxyurea or 100 ng/mL nocodazole and incubated for 19 hours. After this incubation, plates were washed with serum-free medium and fresh growth medium was added. Plates in which cells continued to be arrested were used as controls. Then plates were treated with 10 nM ET-1 or vehicle (serum-free medium) at time 0. Both arrested cells and cells released from arrest were collected at respective time intervals by washing 2X with PBS and trypsinization. Cells were then fixed in 100% ethanol, washed, and suspended in staining buffer containing 3 uM propidium iodide, 100 mM Tris, 150 mM NaCl, 1 mM CaCl2, 0.5 mM MgCl2, and 0.1% Nonidet P-40 at pH 7.4. Cellular DNA content was determined on a FACSCalibur instrument using Cellquest Pro v5.2 software (BectonDickinson, Franklin Lakes, NJ). Data was further analyzed using FlowJo software version 7.6.5 for Microsoft (TreeStar, San Carlos, CA).
Statistics
Appropriate data were presented as means with standard deviations and were evaluated for statistical significance by use of a student’s t-test.
Results
Effect of ET-1 on cell growth
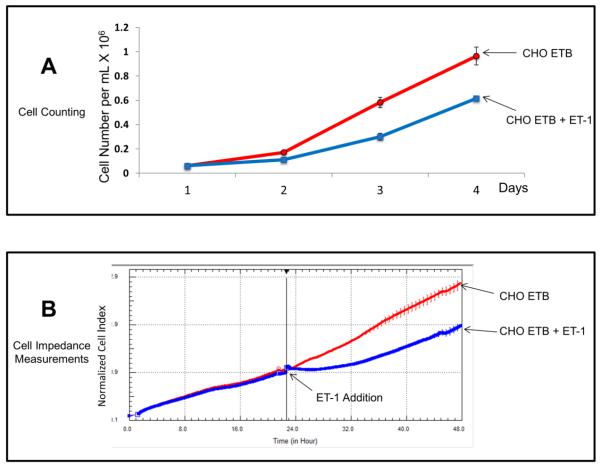
The effect of ET-1 on cell growth was studied in CHO cells stably transfected with ETB receptors. These cells were chosen for this study because of their highly proliferative nature and lack of endogenous ET-1 receptors. Fig. 1A shows a typical growth curve of stably transfected CHO ETB cells in the presence and absence of 10 nM ET-1 over four days. CHO ETB with ET-1 treatment resulted in about a 55% decrease in cell number after only one day compared to control without ET-1. Fig. 1B illustrates growth under the same conditions as in Fig. 1A except using an impedance-based method to determine the cell growth kinetics. Again, as was observed with cell counting, CHO ETB cells treated with ET-1 showed a decrease of approximately 35% in growth rate after one day compared to untreated CHO ETB cells.
Figure 1. Growth curves of transfected CHO ETB cells with treatment of 10 nM ET-1.
(A) Growth curve of CHO ETB cells by direct counting over 4 days. ET-1 was added on day 1 and replenished on day 2 and 3. Each point represents the cell count average and the error bars are the standard deviation. (B) Growth curve of CHO ETB cells by real-time cell impedance measurements. ET-1 was added 24 hours after cells were seeded. To offset any small differences in cell growth before ET-1 addition, cell index values were normalized in the graph after ET-1addition. All points in the curves represent the normalized cell index average and the error bars are the standard deviation.
Effect of ET-1 on cell cycle progression in synchronized cells
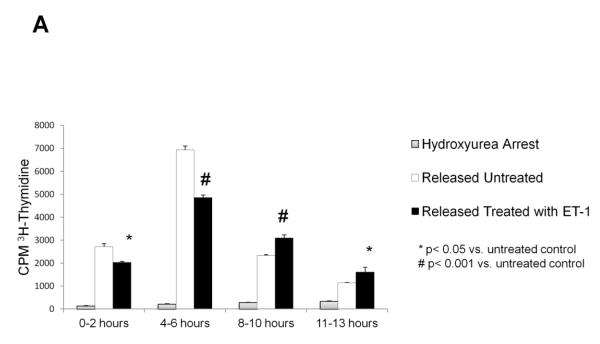
Starvation did not adequately synchronize cell growth in the transfected CHO cells (data not shown). Therefore, cells were synchronized in late G1/S with hydroxyurea or late G2/M with nocodazole. [3H]-thymidine incorporation was used to determine synchronized entrance into the S phase of the cell cycle. As shown in Fig. 2A, CHO ETB cells treated with 10 nM ET-1 displayed a significantly reduced rate of DNA synthesis at both the 0-2 hour time interval and 4-6 hour time interval. Of the two, the 4- 6 hour time interval showed the greatest difference (about 30%) between the treated and untreated CHO ETB. At the 8-10 and the 11-13 hour time intervals, the untreated CHO ETB have a lower rate of DNA synthesis compared to treated, likely due to cells ending S phase and beginning the G2 phase (Fig. 2A). In all cases, when cells were maintained in hydroxyurea no appreciable DNA synthesis occurred.
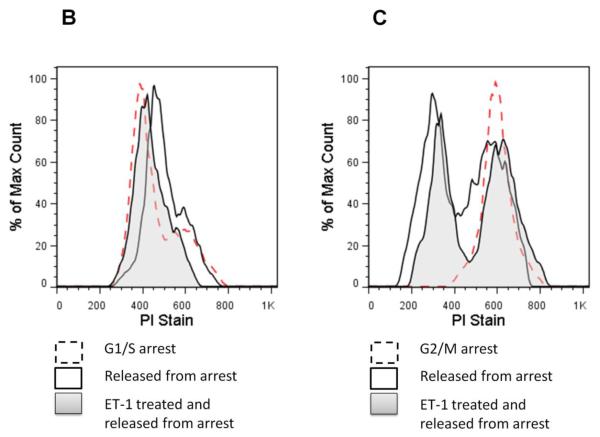
Figure 2. Effects of ET-1 on cell cycle progression in CHO ETB.
(A) Effects of ET-1 on S phase progression in CHO ETB cells using [3H]-thymidine incorporation. All cells were arrested in late G1 of the cell cycle by treatment with 2 mM hydroxyurea for approximately 24 hours. All cells were then pulsed with [3H]-thymidine for 2 hours at the indicated time intervals after being either not released from arrest or released from arrest with or without 10 nM ET-1. Bar height indicates the counts per minute (CPM) average and the error bars are the standard deviation. *p< 0.05 vs. untreated control, #p< 0.001 vs. untreated control. (B,C) Progression of ET-1 treated CHO ETB cell transit from G1/S arrest (B) or G2/M arrest (C). Progression was determined with flow cytometry. Dashed lines indicate cells arrested at G1/S by hydroxyurea (B) or at G2/M by nocodazole (C). Solid lines indicate cells 6 hours after release from arrest, tinted lines indicate cells 6 hours after release from arrest with 10 nM ET-1 treatment. Propidium iodide, PI, stain was measured as a histogram of FL2A after gating out debris and aggregates.
Flow cytometric analysis by propidium iodide DNA staining was used to further determine the effects of ET-1 on phase progression following release from G1/S and G2/M arrest. Illustrated in Fig. 2B, the ET-1 treated peak shows considerable overlap with the G1/S arrested peak, while the control (no added ET-1) has shifted more towards G2. With regard of the effect of ET-1 on mitosis (Fig. 2C), the ET-1 treated and control peaks after release from G2/M are overlapping.
Effects of ET-1 dosage on cell growth and rate of DNA synthesis
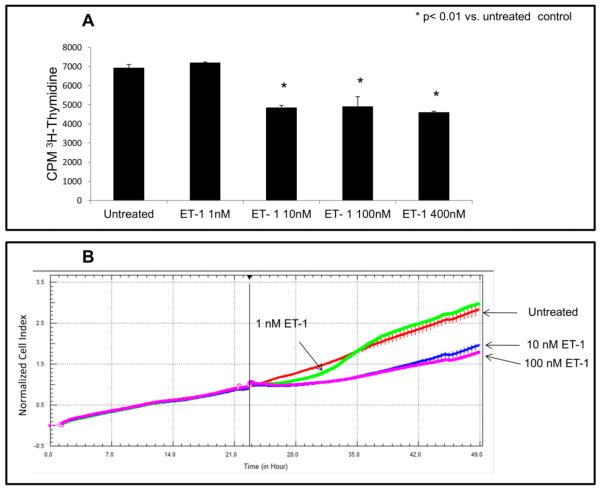
Fig. 3A shows a dosage-dependent response to ET-1 induced cell growth inhibition in CHO ETB cells. Treatment with 1 nM ET-1 resulted in short-term inhibition whereas treatment with 10 or 100 nM ET-1 resulted in a more sustained growth inhibition. Fig. 3B shows the effect of increasing ET-1 concentration on the rate of DNA synthesis at the 4-6 hour time interval. Maximal effect was reached at 10 nM ET-1.
Figure 3. Effects of ET-1 dosage on growth inhibition in CHO ETB cells.
(A) 3H-thymidine incorporation was performed as previously described on CHO ETB cells but with different ET-1 concentrations (0, 1, 10, 100, and 400 nM). Cells were pulsed with [3H]-thymidine during the interval of 4-6 hours after ET-1 addition. Bar height indicates the CPM average and the error bars are the standard deviation. *p< 0.01 vs. untreated control. (B) Growth curve of CHO ETB cells treated with different ET-1 concentrations (0, 1, 10, and 100 nM) generated by real-time cell impedance measurements. ET-1 was added 24 hours after cells were seeded. To offset any small differences in cell growth before ET-1 addition, cell index values were normalized in the graph after ET-1addition. All points in the curves represent the normalized cell index average and the error bars are the standard deviation.
Effects of ET-1 receptor agonists and antagonists on cell proliferation
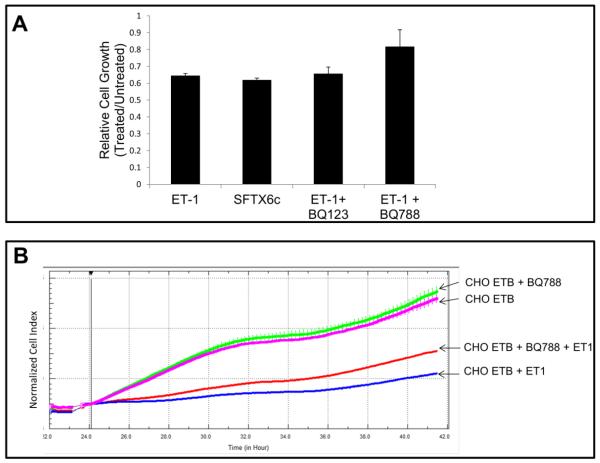
Fig. 1A illustrated that growth inhibition in CHO ETB cells was detectable 24 hours after treatment with 10 nM ET-1. We used this time point to measure cell division by counting cell number after treatment with ET-1 receptor agonists and antagonists. Fig. 4A shows that ETB specific agonist, SFTX6c, inhibited CHO ETB similarly to ET-1 with about a 35% reduction in cell number (55% reduction in cell number when subtracting out initial day cell counts). It also shows that the ETB antagonist, BQ788 with ET-1, only had an 18% reduction in growth rate and therefore partial recovery of growth compared to ET-1 alone. Furthermore, Fig. 4B shows that BQ788, in real-time cell proliferation, recovered some cell growth of ET-1 treated CHO ETB after 24 hours.
Figure 4. Relative growth of CHO ETB cells treated with ET-1 agonists and antagonists.
(A) Relative growth of cells by counting cells treated with 10 nM ET-1, 10 nM SFX6c, 10 nM ET-1 and 1 mM BQ123, or 10 nM ET-1 and 0.5 mM BQ788 after 1 day. For relative cell growth, CHO ETB treated and untreated cells were counted in triplicate and the average of the cell counts for the treated were divided by the average cell counts for the untreated. This experiment was then performed in duplicate with the bars representing the average between the two relative cell growth values and the error bars representing the standard deviation of those values. (B) Real-time growth of CHOETB treated with 0.5 mM BQ788 and/or 10 nM ET-1 in growth medium. Inhibitor was added about 24 hours after cells were seeded and agonist was added an hour later. To offset any small differences in cell growth before agonist addition, cell index values were normalized in the graph after agonist addition. All points in the curves represent the normalized cell index average and the error bars are the standard deviation.
Effect on growth of ETB downstream signal inhibitors
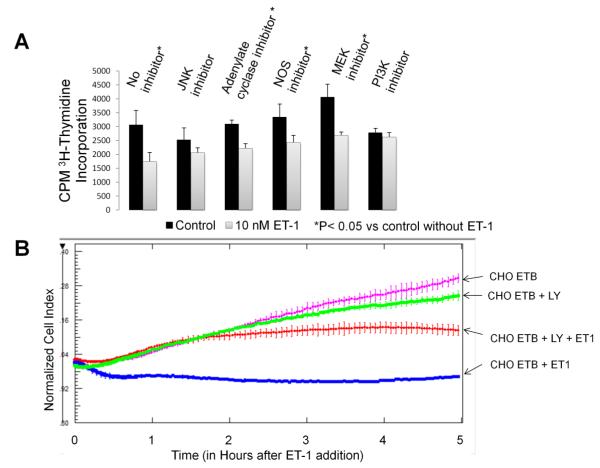
[3H]-thymidine incorporation was used to determine the effect of ET-1 on the rate of DNA synthesis in presence of inhibitors of adenylate cyclase (100 uM DDA), NOS (100 uM L-NAME), and the phosphorylation of JNK (20 uM SP600125), MEK1/2 (10 uM U0126) and PI3K (50 uM LY294002). Since these inhibitors are known to be effectors of cell growth, we compared the amount of [3H]-thymidine incorporation in cells treated with inhibitor against cells treated with both inhibitor and ET-1. Only the PI3K and JNK inhibitors had no significant effects (p<0.05) between the amount of [3H]-thymidine incorporation in cells treated with inhibitor vs. cells treated with inhibitor plus ET-1(Fig. 5A). This suggests that PI3K and JNK are necessary for the ET-1 effect on S phase progression. To further test whether the PI3K inhibitor, LY294002, reverses ET-1 induced inhibition of cell division, we measured real-time cell impedance of this inhibitor in the presence of ET-1. Fig. 5B shows that LY294002 does rescue CHO ETB cells from immediate growth inhibition with ET-1 treatment. However, over time this inhibition ceases.
Figure 5. Effects of ET-1/ETB downstream inhibitors on the rate of DNA synthesis and cell division.
(A) [3H]-thymidine incorporation was performed as previously except some cells were pre-incubated 30 minutes with 100 uM DDA (adenylate cyclase inhibitor), 100 uM L-NAME (NOS inhibitior), 20 uM SP600125 (JNK inhibitor), 10 uM U0126 (MEK1/2 inhibitor) or 50 uM LY294002 (PI3K inhibitor). Cells were pulsed with [3H]-thymidine during the time interval of 3-5 hours after 10 nM ET-1 addition. Bar height indicates the CPM average and the error bars are the standard deviation. *p< 0.05 vs. untreated control. (B) The effect of LY294002 (PI3K inhibitor) on cell division in CHO ETB treated with 10 nM ET-1 as measured by real-time cell impedance. LY294002 (50 uM) was added 24 hours after the cells were seeded. ET-1 (10 nM) was added an hour later. To offset any small differences in cell growth before ET-1 addition, cell index values were normalized in the graph after ET-1 addition. All points in the curves represent the normalized cell index average and the error bars are the standard deviation.
Real-time detection of morphological changes mediated by ETA or ETB receptor activation
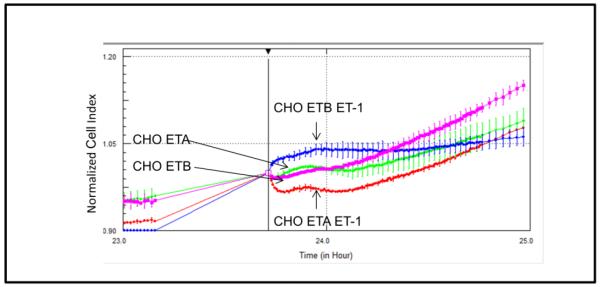
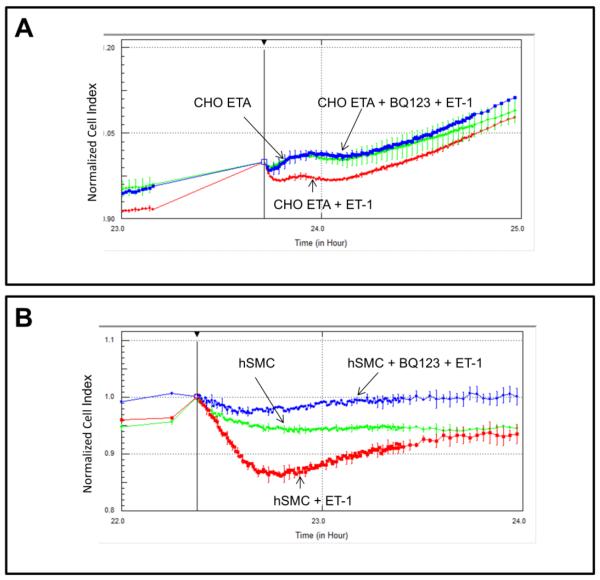
Detection of morphological changes in the cells following exposure to ET-1 was performed using a cell-substrate impedance-based method. Fig. 6A presents a graph of normalized cell index following ET-1 addition to either CHO ETA or CHO ETB cells. Both control CHO ETA and control CHO ETB display similar normalized cell index; conversely, when treated with ET-1 they contrast in their morphological changes. When compared to the controls, ET-1 treated CHO ETA cells illustrate a lower normalized cell index or constricted morphology while ET-1 treated CHO ETB cells show a higher cell index or cellular dilation. Comparative morphological changes due to ET-1 exposure in CHO ETA cells and hSMC are illustrated in Fig 7A and B. The hSMC express both ETA and ETB receptors [9]. Both CHO ETA cells and hSMC show contraction when treated with ET-1 (Fig. 7A and 7B). In the CHO ETA cells, BQ123 abrogates the ET-1 induced contraction (Fig. 7A). In the hSMC, exposure to ET-1 leads to cellular contraction. When treated BQ123, an ETA antagonist, the hSMC then dilated as a result of action of the ETB receptor (Fig. 7B).
Figure 6. Effects of ET-1 on CHO ETA and CHO ETB cell morphology by cell impedance measurements.
Cells were treated with or without 10 nM ET-1 24 hours after seeding. All points in the curves represent the normalized cell index average and the error bars are the standard deviation.
Figure 7. Comparison of ET-1 induced morphological effects on CHO ETA (A) and hSMC (B) by cell impedance measurements.
Cells were pre-incubated with or without 1 uM BQ123 for 1 hour 24 hours after seeding, followed by 10 nM ET-1 addition. All points in the curves represent the normalized cell index average and the error bars are the standard deviation.
Discussion
ET-1 activation of the ETB receptor leads to a cellular growth reduction. This phenomenon was detected via end-point cell counting, real-time impedance-based detection of cell proliferation, cell cycle analysis, and by determining the rate of cellular [3H]-thymidine incorporation. Cell counting and real-time impedance measurements illustrated the effect of ET-1 on CHO ETB cell division, but did not provide information as to where in the cell cycle this takes place. We therefore arrested the cells in late G1 phase and then released them to allow for synchronized progress into S phase. Since late G1 registers negligible [3H]-thymidine incorporation which then takes place in S phase, this approach provided us with a precise and readily measurable assay to study cell proliferation. Also flow cytometric analysis with propidium iodide DNA staining revealed that ET-1 delays cell cycle progression through S phase, but does not delay transit from G2/M to G1.
Exposure to ET-1 in the CHO ETB led to lower [3H]- thymidine incorporation compared to the CHO ETB control without treatment. As Fig. 2A shows, ET-1 treated CHO ETB had a slower velocity and longer duration S phase compared to control. This effect was detected within two hours of ET-1 addition. A previous study looking at activated hepatic stellate cells which express predominately endogenous ETB receptors also show growth inhibition due to ET-1 [10]. However, in those cells ET-1 inhibition occurred only in the presence of serum or platelet-derived growth factor BB. One concern about ET-1 induced growth inhibition in our study was that it occurred in the presence of serum. Given that serum contains many growth factors, hormones, and other compounds that could be interacting with ET-1, we further tested whether this phenomenon occurred with low (0.5%) or no serum. We found that ET-1 induced growth reduction in CHO ETB was serum-independent (data not shown). In all cases, 10%, 0.5% and 0% serum, ET-1 reduced the growth rate of CHO ETB. This means that ET-1 is not interacting with serum factors to inhibit growth.
Downstream of ETB, PI3K was shown to be involved based on its inhibitor’s ability to recover growth. PI3K is known to be involved in cell proliferation, however it is usually seen as a growth promoter. In this case, the inhibition of PI3K with L294002 allowed for the recovery of ET-1 induced slowed growth. It would be of interest to determine whether CHO ETB growth inhibition via ET-1/ETB/PI3K has other downstream targets such as Akt or mTOR and if this pathway relates to other functions such as migration or cell survival. This novel ETB/PI3K pathway may be important in our understanding of cell growth regulation in cells with endogenous ETB receptors. This is especially true in vascular tissue, in which endothelin dysregulation could lead to increased proliferation and onset of vascular diseases, such as pulmonary hypertension.
JNK, which is also known to be involved in cell growth, may also play a role as indicated by its recovery of growth in ET-1 treated CHO ETB cells. This is not surprising as MAP kinases are known to mediate many cytoplasmic and nuclear signals in the cell. Interestingly, NO and cAMP, which are known effectors of proliferation, were not shown to be involved in this growth inhibition pathway. Although one cannot rule out the possibility that NO was secreted by the CHO ETB cells leading to dilatory effects, we can rule out NO being involved in CHO ETB anti-proliferation based on the failure of its inhibitor to recover growth.
The ET-1 induced morphological changes clearly show contrast between the actions of the ETA and ETB receptors. These changes were detected using a cell-substrate impedance-based method which has previously been verified to detect morphological changes due to GPCR activation [8]. ET-1 receptors, like other GPCRs, activate small Rho GTPases which control actin cytoskeleton organization [11, 12]. In this study, ET-1 induced a contracted short-term morphological change in CHO ETA and a more expanded short-term morphological change in CHO ETB. The amount of ET-1 induced expansion in CHO ETB cells was dose-dependent.
Interestingly, hSMC displayed a similar morphological response to ET-1 as CHOETA. This dramatic lowering of normalized cell index in hSMC mimics ET-1 induced smooth muscle contraction. Earlier studies have shown that stress-fiber formations in CHOETA are mediated by Gq/PLC and G12 and in CHOETB by Gq/PLC and G13 [13-15]. It is not clear whether this difference in G12 vs. G13 activation can account for the differences in short-term morphology between CHOETA and CHOETB in response to ET-1 treatment. As far as smooth muscle, ET-1 is known to induce contraction via two mechanisms: one is a calcium-dependent Gq/PLC phosphorylation of myosin light chain (MLC) and the second is a calcium-sensitization mechanism through RhoA/Rho-kinase inactivating MLC phosphatase [16]. It is possible that ET-1 activates similar pathways leading to short-term cytoskeleton changes in CHOETA cells and as it does in hSMC contraction.
Of importance is the fact that ETB activation may transmit signals for more relaxed cell morphology. Presently, ETB is thought to regulate vasodilation by secretion of NO and prostacyclin from endothelial cells. However, it remains to be seen which downstream effectors of ETA and ETB are responsible for their opposing short-term morphologies. Currently, it is not clear whether ET-1 treated CHO ETB cells are secreting dilatory effectors or they are signaling dilation through direct intracellular signaling. Secretion of NO as a dilatory effector is possible because wild-type CHO have been shown to express endogenous NOS isoforms [17, 18], however NO was already ruled out as a contributor of growth inhibition. On the other hand, expression of prostacyclin receptors in CHO has been shown to be negligible, making the possibility of prostacyclin being the dilatory or anti-proliferative effector unlikely [19]. Given the evidence, ET-1 activation of ETB likely leads to intracellular pathways, which directly and not through secreted effectors, cause both the dilatory and growth inhibitory effects of CHO ETB cells.
These phenomena in ET-1 induced CHO ETB cell growth and morphology suggest that there may be other underling ET-1 signals not yet understood. Up to now only subtle differences in signaling between the two receptors have been documented, primarily involving Gs alpha and Gi alpha cAMP signaling. This implies that there are other unknown signals, particularly in CHO ETB, downstream of Gi alpha or possibly independent of Gi alpha. Identifying these possible novel signals for cell dilation and growth inhibition may allow researchers to enhance these signals for the amelioration of vascular diseases, such as pulmonary hypertension.
Highlights.
ET- hinders cell proliferation in CHO cells transfected with ETB.
ET-1 also decreases the rate of DNA synthesis in CHO ETB cells.
JNK and PI3K appear to be involved in this reduction of DNA synthesis.
ETB activation in CHO ETB cells and hSMCs leads to dilatory morphological changes.
In CHO ETA and hSMCs, ETA activation leads to constrictive morphological changes.
Acknowledgements
This work was supported in part by National Institutes of Health/National Lung, Heart, and Blood Institute Grant HL25776.
Footnotes
Publisher's Disclaimer: This is a PDF file of an unedited manuscript that has been accepted for publication. As a service to our customers we are providing this early version of the manuscript. The manuscript will undergo copyediting, typesetting, and review of the resulting proof before it is published in its final citable form. Please note that during the production process errors may be discovered which could affect the content, and all legal disclaimers that apply to the journal pertain.
References
- [1].Aramori I, Nakanishi S. Coupling of two endothelin receptor subtypes to differing signal transduction in transfected Chinese hamster ovary cells. J Biol Chem. 1992;267:12468–12474. [PubMed] [Google Scholar]
- [2].Sugawara F, Ninomiya H, Okamoto Y, Miwa S, Mazda O, Katsura Y, Masaki T. Endothelin-1-induced mitogenic responses of Chinese hamster ovary cells expressing human endothelinA: the role of a wortmannin-sensitive signaling pathway. Mol Pharmacol. 1996;49:447–457. [PubMed] [Google Scholar]
- [3].Nilsson D, Wackenfors A, Gustafsson L, Ugander M, Ingemansson R, Edvinsson L, Malmsjo M. PKC and MAPK signalling pathways regulate vascular endothelin receptor expression. Eur J Pharmacol. 2008;580:190–200. doi: 10.1016/j.ejphar.2007.10.071. [DOI] [PubMed] [Google Scholar]
- [4].Sandhu H, Ansar S, Edvinsson L. Comparison of MEK/ERK pathway inhibitors on the upregulation of vascular G-protein coupled receptors in rat cerebral arteries. Eur J Pharmacol. 2010;644:128–137. doi: 10.1016/j.ejphar.2010.06.053. [DOI] [PubMed] [Google Scholar]
- [5].Xu CB, Zheng JP, Zhang W, Zhang Y, Edvinsson L. Lipid-soluble smoke particles upregulate vascular smooth muscle ETB receptors via activation of mitogen-activating protein kinases and NF-kappaB pathways. Toxicological sciences : an official journal of the Society of Toxicology. 2008;106:546–555. doi: 10.1093/toxsci/kfn173. [DOI] [PubMed] [Google Scholar]
- [6].Yeligar S, Tsukamoto H, Kalra VK. Ethanol-induced expression of ET-1 and ET-BR in liver sinusoidal endothelial cells and human endothelial cells involves hypoxia-inducible factor-1alpha and microrNA-199. J Immunol. 2009;183:5232–5243. doi: 10.4049/jimmunol.0901084. [DOI] [PMC free article] [PubMed] [Google Scholar]
- [7].Aquilla E, Whelchel A, Knot HJ, Nelson M, Posada J. Activation of multiple mitogen-activated protein kinase signal transduction pathways by the endothelin B receptor requires the cytoplasmic tail. J Biol Chem. 1996;271:31572–31579. doi: 10.1074/jbc.271.49.31572. [DOI] [PubMed] [Google Scholar]
- [8].Yu N, Atienza JM, Bernard J, Blanc S, Zhu J, Wang X, Xu X, Abassi YA. Real-time monitoring of morphological changes in living cells by electronic cell sensor arrays: an approach to study G protein-coupled receptors. Anal Chem. 2006;78:35–43. doi: 10.1021/ac051695v. [DOI] [PubMed] [Google Scholar]
- [9].Davie N, Haleen SJ, Upton PD, Polak JM, Yacoub MH, Morrell NW, Wharton J. ET(A) and ET(B) receptors modulate the proliferation of human pulmonary artery smooth muscle cells. Am J Respir Crit Care Med. 2002;165:398–405. doi: 10.1164/ajrccm.165.3.2104059. [DOI] [PubMed] [Google Scholar]
- [10].Mallat A, Fouassier L, Preaux AM, Gal CS, Raufaste D, Rosenbaum J, Dhumeaux D, Jouneaux C, Mavier P, Lotersztajn S. Growth inhibitory properties of endothelin-1 in human hepatic myofibroblastic Ito cells. An endothelin B receptor-mediated pathway. J Clin Invest. 1995;96:42–49. doi: 10.1172/JCI118052. [DOI] [PMC free article] [PubMed] [Google Scholar]
- [11].Barman SA. Vasoconstrictor effect of endothelin-1 on hypertensive pulmonary arterial smooth muscle involves Rho-kinase and protein kinase C. American journal of physiology. Lung cellular and molecular physiology. 2007;293:L472–479. doi: 10.1152/ajplung.00101.2006. [DOI] [PubMed] [Google Scholar]
- [12].Mackay DJ, Hall A. Rho GTPases. J Biol Chem. 1998;273:20685–20688. doi: 10.1074/jbc.273.33.20685. [DOI] [PubMed] [Google Scholar]
- [13].Kawanabe Y, Hashimoto N, Masaki T. Characterization of G proteins involved in activation of nonselective cation channels by endothelin(B) receptor. Br J Pharmacol. 2002;136:1015–1022. doi: 10.1038/sj.bjp.0704805. [DOI] [PMC free article] [PubMed] [Google Scholar]
- [14].Kawanabe Y, Okamoto Y, Enoki T, Hashimoto N, Masaki T. Ca(2+) channels activated by endothelin-1 in CHO cells expressing endothelin-A or endothelin-B receptors. Am J Physiol Cell Physiol. 2001;281:C1676–1685. doi: 10.1152/ajpcell.2001.281.5.C1676. [DOI] [PubMed] [Google Scholar]
- [15].Kawanabe Y, Okamoto Y, Nozaki K, Hashimoto N, Miwa S, Masaki T. Molecular mechanism for endothelin-1-induced stress-fiber formation: analysis of G proteins using a mutant endothelin(A) receptor. Mol Pharmacol. 2002;61:277–284. doi: 10.1124/mol.61.2.277. [DOI] [PubMed] [Google Scholar]
- [16].Wynne BM, Chiao CW, Webb RC. Vascular Smooth Muscle Cell Signaling Mechanisms for Contraction to Angiotensin II and Endothelin-1. J Am Soc Hypertens. 2009;3:84–95. doi: 10.1016/j.jash.2008.09.002. [DOI] [PMC free article] [PubMed] [Google Scholar]
- [17].Florio T, Arena S, Pattarozzi A, Thellung S, Corsaro A, Villa V, Massa A, Diana F, Spoto G, Forcella S, Damonte G, Filocamo M, Benatti U, Schettini G. Basic fibroblast growth factor activates endothelial nitric-oxide synthase in CHO-K1 cells via the activation of ceramide synthesis. Mol Pharmacol. 2003;63:297–310. doi: 10.1124/mol.63.2.297. [DOI] [PubMed] [Google Scholar]
- [18].Sampaio WO, Souza dos Santos RA, Faria-Silva R, da Mata Machado LT, Schiffrin EL, Touyz RM. Angiotensin-(1-7) through receptor Mas mediates endothelial nitric oxide synthase activation via Akt-dependent pathways. Hypertension. 2007;49:185–192. doi: 10.1161/01.HYP.0000251865.35728.2f. [DOI] [PubMed] [Google Scholar]
- [19].Chow KB, Wong YH, Wise H. Prostacyclin receptor-independent inhibition of phospholipase C activity by non-prostanoid prostacyclin mimetics. Br J Pharmacol. 2001;134:1375–1384. doi: 10.1038/sj.bjp.0704388. [DOI] [PMC free article] [PubMed] [Google Scholar]


