Fig. 8.
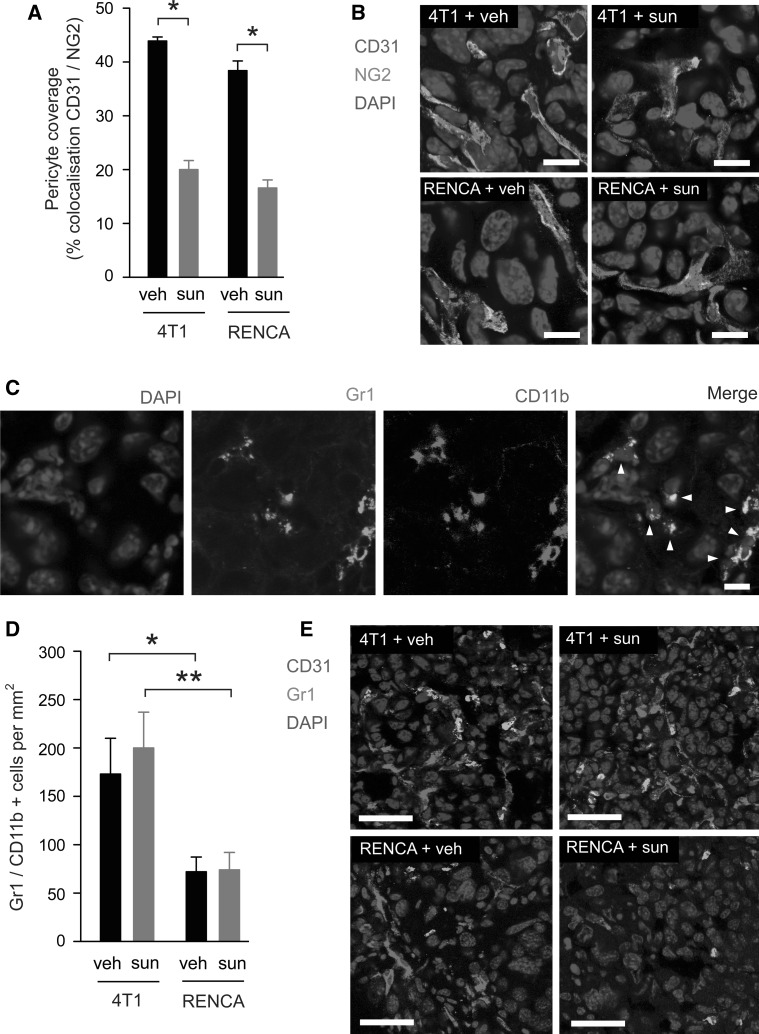
Quantification of pericyte coverage and myeloid cell recruitment in tumours. Balb/c mice were injected intravenously with 4T1-luc or RENCA-luc cells and then treated with vehicle (veh) or 60 mg/kg/day sunitinib (sun) for 14 days, at which time point mice were culled and lungs were collected for histological analysis. a, b Quantification of pericyte coverage in 4T1 and RENCA tumours treated with vehicle or sunitinib. Bar graph in a shows percentage colocalisation between CD31 and NG2 ± SEM. * P = 0.0001, n = 8 mice per treatment group. In b, representative high power fields from each experimental group are shown with CD31 (red), NG2 (green) and DAPI (blue). c Representative high power field containing Gr1 and CD11b dual positive cells (arrowheads). Staining for Gr1 (green), CD11b+ (red) and DAPI (blue). d, e Quantification of Gr1 and CD11b dual positive cells in 4T1 and RENCA tumour nodules from vehicle and sunitinib treated mice. Graph in d shows number of Gr1/CD11b+ cells per mm2 ± SEM. *P = 0.02, **P = 0.007, n = 8 mice per treatment group. In e, representative low power fields from each experimental group are shown with CD31 (red), Gr1 (green) and DAPI (blue). CD11b staining is omitted in e, but all of the cells shown were confirmed to be dual positive for both Gr1 and CD11b. Scale bar = 20 μM in b and c and 50 μM in e. (Color figure online)

