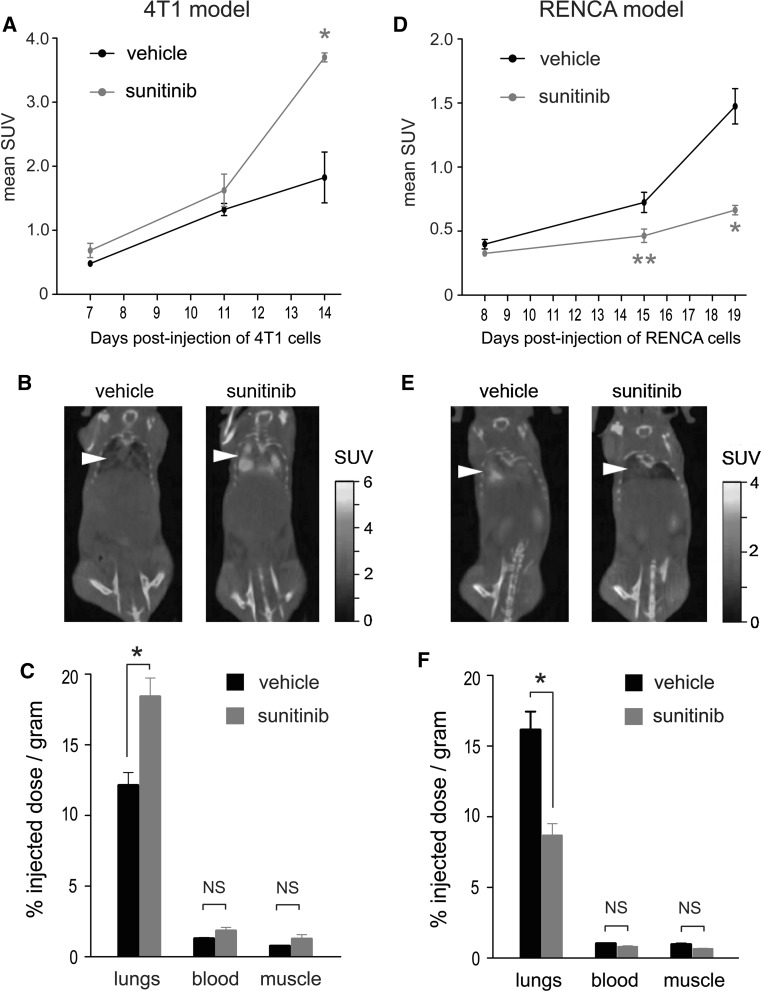
Fig. 9.
Measurement of tumour glucose uptake. Balb/c mice were injected intravenously with 4T1-luc cells (a–c) or RENCA-luc cells (d–f) and then treated with daily vehicle or 60 mg/kg/day sunitinib on a continuous dosing schedule. 18FDG uptake was measured by 18FDG-PET/CT imaging of live animals or by gamma counting of resected tissues. a, d Graphs show mean standard uptake value (SUV) measured in the lungs of 4T1 (a) or RENCA (d) tumour-bearing mice using 18FDG-PET/CT imaging at the indicated time point. *P = 0.02, **P = 0.002, n = 2 mice per experimental group (left and right lungs from each mouse were analysed separately). b, e Representative 18FDG-PET/CT images are shown of 4T1 tumour bearing mice at 14 days (b) and RENCA tumour bearing mice at 19 days (e) after tumour cell implantation, respectively. Arrowhead indicates location of chest cavity. c, f Gamma counting was used to measure the amount of 18FDG present in lungs, blood and muscle obtained post-mortem from 4T1 (c) or RENCA (f) tumour bearing mice at 14 days (c) or 19 days (f) after tumour cell implantation, respectively. Counts were corrected to the tissue mass in order to calculate the percentage injected dose present per gram of tissue. The graphs show the percentage injected dose per gram of tissue ± SEM. *P = 0.01, n = 7 − 10 mice per experimental group. NS = no significant difference

