The analysis of sets of concentration-time curves obtained simultaneously from the venous outflow of an organ can nowadays provide information on cellular uptake and efflux rates and on solute binding and sequestration or substrate consumption. The technological prerequisite was the development of methods for obtaining indicator dilution curves with minimal distortion due to the sampling system and for several indicators (usually radioactive tracers) simultaneously (Chinard, Vosburgh, and Enns, 1955). The analysis has become more complicated, but more precise and realistic, over the past 3 decades since Sangren and Sheppard (1953) presented their model for blood-tissue exchange; theirs was a pioneering contribution since it provided a mathematical expression for a single capillary-intestitial fluid (ISF) unit which was realistic in accounting for gradients along the length of the capillary and in accounting for both blood-to-ISF and ISF-to-blood fluxes. More recent developments have accounted for axial diffusion (Bassingthwaighte et al., 1970; Bassingthwaighte, 1974), cellular uptake (Ziegler and Goresky, 1971), return from the cell (Rose, Goresky and Bach, 1977), and transport within erythrocytes as well as in the plasma (Goresky, Bach, and Nadeau, 1975; Roselli and Harris, 1980). The applications include studies limited to estimating transcapillary exchange rates (e.g. Guller et al., 1975, on Na+ in the heart) and, more interestingly, on the abundance and affinity of hormone binding sites in the heart (e.g. Cousineau et al., 1981 for norepinephrine). In this presentation we focus on the estimation of cellular uptake rates.
The analytical techniques can now account for heterogeneity of regional flows in organs, but not for heterogeneities of properties or exchange rates (Levin, Kuikka, and Bassingthwaighte, 1981; Rose and Goresky, 1976). In the most recent analyses, the capillary-tissue models were fitted to a whole set of dilution curves simultaneously in order to minimize the degrees of freedom in obtaining the best estimates of parameters (Levin, Kuikka, and Bassingthwaighte, 1980). In this overview an example of these approaches to estimating myocardial uptake rates for glucose is presented.
Three factors are of particular importance in using the multiple indicator dilution technique for estimating cellular uptake rates: 1. the required information is in the tails of the dilution curves 15 to 60 seconds after the peak, so that the blood sampling should extend 1½ minutes or more; 2. multiple reference solutes are needed for accurate analysis; and 3. the analysis cannot be applied to highly diffusible solutes which participate in diffusional shunting from inflow to outflow or between capillary-tissue units.
Methods
1 The multiple indicator technique
This technique, introduced by Chinard et al. (1955), incorporates the idea that data on a set of “reference” solutes are obtained simultaneously with those on the solute or substrate of interest. The “reference” solutes are chosen to differ from the test solute in their volumes of distribution or in their ability to traverse membrane barriers.
The technique is either to inject as a bolus or to infuse at constant rate into the inflow a set of tracers of differing molecular characteristics. In designing an experiment to assess transcapillary exchange, one chooses a reference tracer which does not escape from the blood, and a permeant or test substance which does escape. Displacements of the outflow pattern of the test substance from that of the reference substance are then interpreted as resulting from the processes underlying the transcapillary exchange of that substance. For estimating the cell permeability-surface area product PSM, one desires a second reference substance which enters the ISF but not the cell. Sets of dilution curves in the venous outflow are obtained by collecting a sequence of blood samples taken at short intervals at known times (0.2 to a few seconds apart) and measuring the tracer concentrations. The data give information from which the probability density function of transit times h(t) is calculable for each tracer. Alternatively, the residue functions for the tracers RR (t) and RD (t) are recorded by use of an external multichannel γ-detector-analyzer system. From the pairs or multiples of curves obtained simultaneously the investigator can then derive information on the features of the system which have led to the separation of the tracers. For example, from the difference between the curves (outflow or residue) for the reference intravascular marker and for a permeant tracer, the investigator may attempt via the modeling to extract an estimate of the rate of capillary-tissue exchange of the test substance. From differences in mean transit times and the measurement of the flow provided by the curves, he can obtain estimates of the mean transit time volumes, which reflect the volumes of distribution of the tracers. By far the most definitive and satisfactory way to obtain the estimates of the important exchange rates and volumes has been to fit the observed dilution curves with models for blood-tissue exchange.
The intravascular reference curve is critical since it describes all the dispersion within the vascular system; it is essential that the reference indicator be carried in the blood stream in exactly the same fashion as is the tracer of interest, i.e., having the same intravascular volume of distribution, axial and radial diffusivity, etc. For organs such as heart and brain, albumin or larger molecules serve adequately as references for small hydrophilic solutes which do not enter erythrocytes, so long as differences in intravascular diffusivity are unimportant.
For estimating cellular uptake one prefers to use two or more reference tracers simultaneously. In the experiments of Kuikka et al. (1979) for estimating the cellular uptake and return flux of D-glucose to the effluent blood, we used albumin as the intravascular reference, L-glucose as an extracellular marker with the same capillary PSC as for D-glucose, and 2-deoxy-D glucose as a reference having a similar (slightly higher) cellular uptake rate but a much lower (perhaps zero) cellular efflux. Each of these reference tracer dilution curves gives redundant information on the parts of the system which are common to two or more tracers so that the accuracy of the estimates of the parameters of the model is much improved. The use of multiple simultaneous functions which must all be fitted by the model is the strongest technique for demonstrating shortcomings of the models yet, at the same time, is one of the strongest techniques for showing the self-consistency of a model, and for obtaining accurate estimates of the physiological parameters.
2 Model of an aggregate of Capillary-ISF-cell units in an organ
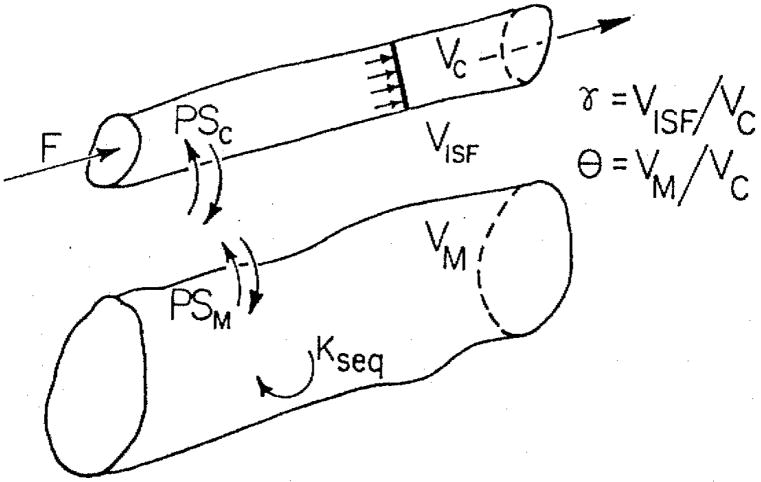
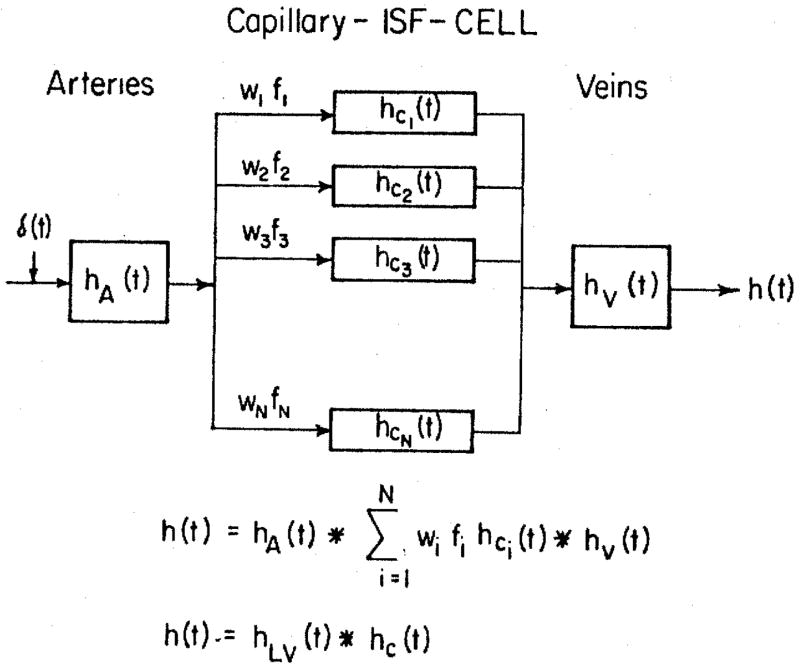
The modeling in the heart is based on the Krogh-cylinder type model assuming that the organ is composed of an aggregate of these in parallel, each behaving independently of the others. The capillary-ISF-cell unit is diagrammed in figure 1 and the aggregation of these in figure 2.
Fig. 1.
Capillary-ISF-cell model with resistances in series. Here Fs stands for solute flow; PSC and PSM are permeability-surface area products for capillary walls and myocyte membrane, respectively; Vc, VISF, and VM are the volumes of distribution of tracers in capillary, ISF, and cell regions, γ = VISF/Vc and ϑ = VM/Vc are ratios of ISF and cell accessible volumes of distribution to capillary volume, and kseq is a sequestration constant within the cell.
Fig. 2.
Capillary-ISF-Tissue Transport Model. The transport functions of the regions of exchange are independent of the transport functions of the arteries and veins, hA (t) and hV (t). The capillary-tissue regions are considered to be alike except for their relative flows, the fi’s; the fraction of mass having flow fi is wi, so that the fraction of tracer traversing a region i with flow fi is wifi. The asterisk denotes the process of convolution. The large vessel transport function hLV (t) is a convolution of hA (t) and hV (t).
The organ model shown in figure 2 differs from that of Rose and Goresky (1976); in their model, the transit times in the capillaries were linearly related to those in each in an equally large set of large vessels in parallel. The quantitative effect of the choice of model on the estimates of PS is not yet known.
3 Estimation of Parameters
Calculation of the sensitivity functions of our model, figure 2, showed the maximum sensitivity to PSM to be in the late downslope phase of the indicator dilution curves, a region in which there is also reflux from ISF to blood. Therefore, manual calculations for PSM was impossible and the model was fitted to all the members of the set of simultaneously obtained dilution curves using the optimizer developed by Levin et al. (1980), which utilizes the sensitivity functions to obtain rapid convergence.
Two different approaches are possible when fitting the curves. One is to use the probability density function of regional microsphere depositions to give the relative regional flows, the fi’s and the Wi’s, and to estimate the parameters shown in figure 1. The other is to consider the flow heterogeneity as unknown, but with fi’s distributed in a specific fashion around the mean, for example as a Gaussian distribution, and then to optimize the parameters in figure 1 plus the dispersion of the flow distribution. The latter approach would be deemed useful if it is demonstrated that the heterogeneity so estimated were similar to that observed experimentally with microspheres.
Results
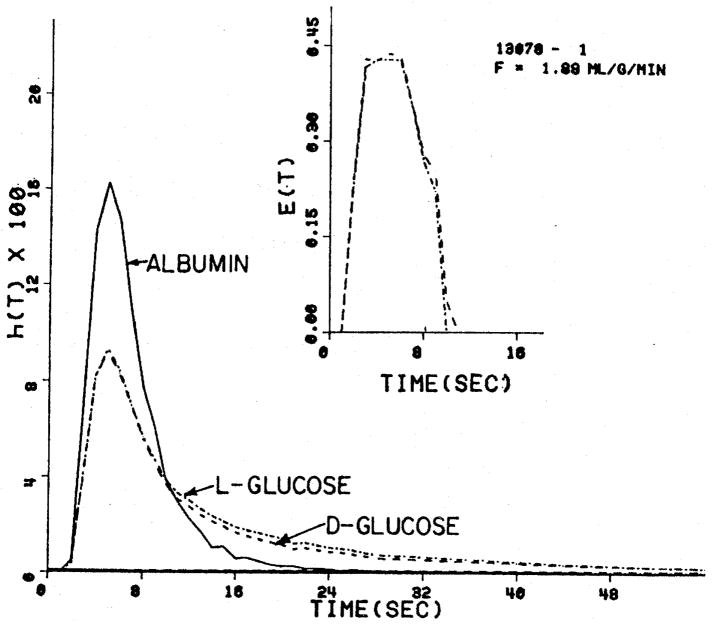
A set of indicator dilution curves for albumin, D-glucose, and L-glucose are shown in figure 3. The D-glucose curve is lower than the L-glucose curve because of the uptake into the myocardial cell, there being no entry of L-glucose into the cell, according to Park et al. (1968), although it crosses the capillary wall into the ISF with the same facility as does D-glucose.
Fig. 3.
Coronary sinus outflow dilution curves for D- and L-glucose. The D-glucose uptake shows as a small difference from L-glucose in the tail of the curves.
Multicapillary models fitted to such curves gave estimates of PSC of about 0.4 ml g−1 min−1 and PSM of about 0.2 ml g−1 min−1 for D-glucose. These values were obtained using the heterogeneity of flows defined by the microsphere depositions.
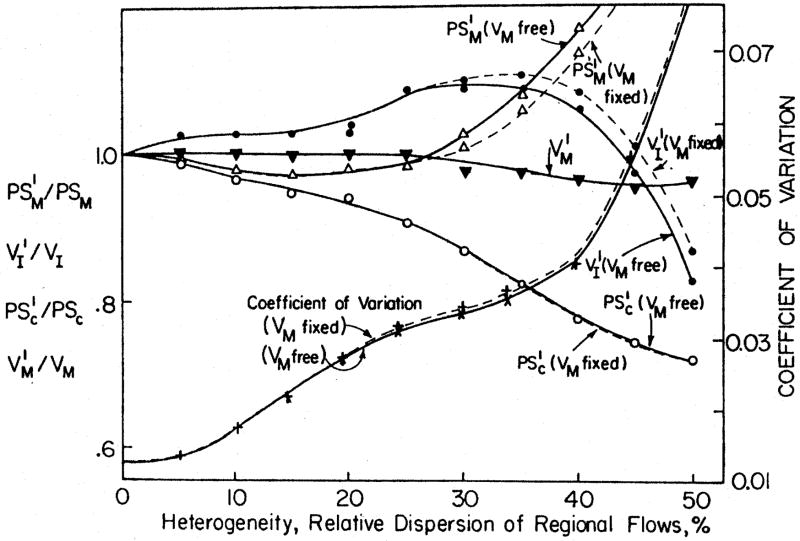
The importance of using the multicapillary modeling is shown in figure 4. When curves generated from a completely defined multicapillary model (as in fig. 2) were fitted with a single capillary model in order to estimate parameters, the error in estimates was zero when there was no heterogeneity, as shown by the convergence at 1.0 on the left ordinate in the figure. With a relative dispersion of regional flows of 10 to 25 % there was minor under-estimation of PSM at the particular value tested, and increasingly great overestimation with heterogeneities having relative dispersions greater than 25 %. (The error in capillary PSC was to underestimate it by 15 to 30 % when dispersion was great.)
Fig. 4.
Overestimation of PSM by single capillary model with reflux from the cell to the ISF and from ISF to blood. True parameter values were: PSC = 1.0 ml g−1 min−1, VISF/Vc = 5.0, PSM = 1.0 ml g−1 min−1, VM/VC = 20.0. Mean flow was set to be 1.0 ml g−1 min−1.
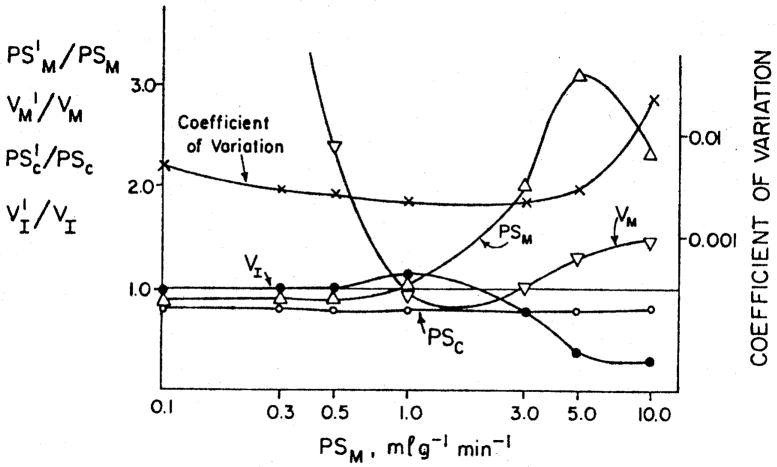
The relative error in estimates of PSM depends on the value of PSM. This is shown in figure 5. When PSM is small then the systematic error is a small underestimate; but it may be recalled by looking at figure 3, that any noise in the data will inevitably be associated with substantial random errors. When PSM is larger than 1 ml g−1 min−1, then it tends to be greatly overestimated. The peak of overestimation is at about 5 ml g−1 min−1 as the model becomes increasingly sensitive to changes in PSM when cell uptake is very large.
Fig. 5.
Error in estimates of PSM and other parameters over the physiologic range of values of PSM. This figure is essentially a cross-section of the preceding figure with a constant relative dispersion of 35 %.
Finally, the method of estimating the heterogeneity itself from the dilution curves via the model fitting has proven very useful. The estimated relative dispersions were 60 % of the measured relative dispersions with a correlation coefficient of 0.90 (N = 22). Why not 100 % is not clear.
Conclusion
It is important to take into account the heterogeneity of flows when estimating PSM when the cell uptake rate is above 1 ml g−1 min−1. At lower PSM’s the need is not so great when PSC is about 1 ml g−1 min−1 because of counteropposing influences of the various parameters on the shapes of the curves. It is not known whether this generally applies when PSC is much higher or much lower than 1 ml g−1 min−1.
Acknowledgments
The research was supported by NIH grants HL19135 and by Reynolds Corporation. Mr. James Rees assisted in the computer work and Wilma Dlouhy in the preparation of the manuscript.
References
- Bassingthwaighte JB. A concurrent flow model for extraction during transcapillary passage. Circulat Res. 1974;35:483–503. doi: 10.1161/01.res.35.3.483. [DOI] [PMC free article] [PubMed] [Google Scholar]
- Bassingthwaighte JB, Knopp TJ, Hazelrig JB. A concurrent flow model for capillary-tissue exchanges. In: Crone, Lassen, editors. Capillary Permeability (Alfred Benzon Symp II) Munksgaard; Copenhagen: 1970. pp. 60–80. [Google Scholar]
- Chinard FP, Vosburgh GJ, Enns T. Transcapillary exchange of water and of other substances in certain organs of the dog. Amer J Physiol. 1955;183:221–234. doi: 10.1152/ajplegacy.1955.183.2.221. [DOI] [PubMed] [Google Scholar]
- Cousineau D, Rose CP, Goresky CA. Labeled catecholamine uptake in the dog heart: interactions between capillary wall and sympathetic nerve uptake. Circulat Res. 1980;47:329–338. doi: 10.1161/01.res.47.3.329. [DOI] [PubMed] [Google Scholar]
- Goresky CA, Bach GG, Nadeau BE. Red cell carriage of label: its limiting effects on the exchange of materials in the liver. Circulat Res. 1975;36:328–351. doi: 10.1161/01.res.36.2.328. [DOI] [PubMed] [Google Scholar]
- Guller B, Yipintsoi T, Orvis AL, Bassingthwaighte JB. Myocardial sodium extraction at varied coronary flows in the dog: estimation of capillary permeability by residue and outflow detection. Circulat Res. 1975;37:359–378. doi: 10.1161/01.res.37.3.359. [DOI] [PMC free article] [PubMed] [Google Scholar]
- Kuikka J, Bouskela E, Bassingthwaighte JB. D-, L-, and 2-deoxy-D-glucose uptakes in the isolated blood perfused dog heart. Biblthca Anat. 1979;18:239–242. [PMC free article] [PubMed] [Google Scholar]
- Levin M, Kuikka J, Bassingthwaighte JB. Sensitivity analysis in optimization of time-distributed parameters for a coronary circulation model. Med Prog Technol. 1980;7:119–124. [PMC free article] [PubMed] [Google Scholar]
- Levin M, Kuikka J, Bassingthwaighte JB. Estimation of myocardial capillary and cellular permeability-surface area products with heterogeneity of regional flows. Circulat Res. (submitted) [Google Scholar]
- Park CR, Crofford OB, Kono T. Mediated (nonactive) transport of glucose in mammalian cells and its regulation. J Gen Physiol. 1968;52:296–318. [PMC free article] [PubMed] [Google Scholar]
- Rose CP, Goresky CA. Vasomotor control of capillary transit time heterogeneity in the canine coronary circulation. Circulat Res. 1976;39:541–545. doi: 10.1161/01.res.39.4.541. [DOI] [PubMed] [Google Scholar]
- Rose CP, Goresky CA, Bach GG. The capillary and sarcolemmal barriers in the heart: an exploration of labeled water permeability. Circulat Res. 1977;41:515–533. doi: 10.1161/01.res.41.4.515. [DOI] [PubMed] [Google Scholar]
- Roselli RJ, Harris TR. A four phase model of capillary tracer exchange. Ann Biomed Eng. 1980;7:203–238. doi: 10.1007/BF02364115. [DOI] [PubMed] [Google Scholar]
- Sangren WC, Sheppard CW. A mathematical derivation of the exchange of a labeled substance between a liquid flowing in a vessel and an external compartment. Bull Math Biophys. 1953;15:387–394. [Google Scholar]
- Ziegler WH, Goresky CA. Transcapillary exchange in the working left ventricle of the dog. Circulat Res. 1971;29:208–220. doi: 10.1161/01.res.29.2.181. [DOI] [PubMed] [Google Scholar]


