Abstract
State of the art biological imaging methods, such as confocal microscopy, create 3D volumes by sampling on a cartesian grid. This cartesian coordinate system is often not convenient for visualization and analysis of multi layered organs or tissues. The ascidian embryonic tail, for example, is organized along anterioposterior (AP), dorsoventral (DV) and left-right (LR) axes that are locally orthogonal but curved in the XYZ microscope space. Here, we propose a “curvicylindrical” coordinate system for analysis of such biological structures. By extracting representative paths that traverse different tissue layers, the embryo can be visualized in a small number of 2D images (3 images in the case of the ascidian tail). As we demonstrate, this reduction of the dimensionality from 3D to 2D facilitates the initialization process for high quality segmentation of different cell types, and identification of tissue boundaries.
Keywords: Coordinate system, transformation, cell segmentation, tissue segmentation, morphogenesis
1. INTRODUCTION
Quantitative studies of embryonic morphogenesis ideally require the temporal analysis of cell shape across entire tissues, organs, or embryos. Typical model organisms have stereotyped body shapes with distinct body axes, but these embryonic axes of symmetry are rarely aligned with the cartesian coordinate system of the microscope, and are typically curved. This makes it more difficult to visualize and study different aspects of a multilayered organism in a 3D microscopic image. Some approaches use atlas matching to register the images to a known model in order to have a canonical measurement across different samples. For example the work in [1] straightens C. elegans images to align them to a common reference for further analysis.
In this paper, we introduce the curvicylindrical coordinate system (CC) for representing biological structures that show cylindrical organization. The ascidian embryonic tail is an example of such a structure. Also, we develop new computational tools defined in this coordinate system for analytical studies of morphogenesis.
Ascidians, such as Ciona, are the closest invertebrate relatives of the vertebrates. The small size and simplicity of ascidian embryo make it well suited for in toto imaging and analysis. Like many biological structures, the ascidian tail is organized as a multilayered cylinder. The notochord forms the core of the cylinder, and is surrounded by a middle layer that consists of lateral muscle cells, a dorsal neural tube, and a ventral endodermal strand. The third and outer layer of the tail consists of epidermis (Figure 1). In 3D confocal images, the topography of this cylindrical architecture varies significantly between images, but the basic topology does not.
Fig. 1.
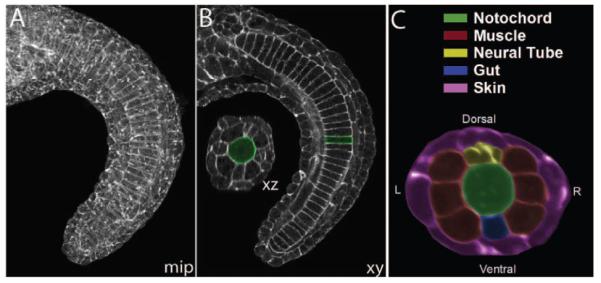
An example of a confocal image of an ascidian embryo tail. (A) the maximum intensity projection of the stack, (B) a lateral section (XY) and a cross section (XZ) view, and (C) a pseudo-colored cross section showing different cell types.
We map these 3D images from the microscope-based coordinate system into the new CC coordinate system, where the three basis vectors are the main biological axes of the embryo (AP, DV and LR). This gives rise to a more biologically meaningful coordinate system with numerous advantages. In particular, it allows for the different tissue layers to be virtually unwrapped and viewed as single 2D images. This representation also reduces the dimensionality of the problem in downstream applications such as cell initialization for segmentation, and the study of intertissue relations during morphogenesis.
Cell segmentation is a crucial step for quantitative studies of cell morphodynamics. Previously proposed and potential methods for 3D cell membrane segmentation such as Active Surfaces [2], Subjective Surfaces [3], Viscous Watershed [4], and Fast Marching [5] are typically initiated with a seed inside each cell. Excessive seed points can result in over segmentation while insufficient initial points typically cause under-segmentation. Some cell segmentation approaches such as [3] use a nuclear channel for initialization. However, a nuclear channel is not always available, and nuclei detection in dense tissues is itself a non-trivial challenge. Manual initialization of cells in a 3D multilayered volume is not only time consuming but also very difficult as the user has to go back and forth between the slices to make sure there is only one seed point in each cell.
Our tissue unwrapping approach (Section 3) decouples the 3D volume into a small set of 2D images, where each image corresponds to one tissue layer. In the case of ascidian embryo, three images are enough to represent all the layers in the tail. This dimensionality reduction allows for a fast and accurate initialization. Consequently, we were able to achieve high quality segmentation results for different cell types even using a simple segmentation algorithm such as watershed. Results are reported in Section 6.
Based on the curvicylindrical representation, we also developed a new method for finding the tissue boundaries with-out segmenting individual cells (Section 5). Our method registers the tail into a cylindrical model and identifies the boundaries between the layers in the curvicylindrical coordinate using Fast Marching.
We are currently using these visualization and analysis tools in diverse studies of ascidian tail axial morphogenesis.
2. TRANSFORMATION TO CURVICYLINDRICAL COORDINATE SYSTEM
In this section we define the 3D transformation into the CC system and describe how one can reduce the dimensionality by choosing representative paths along the tissue layers. First, we identify the embryonic axes. In the case of the ascidian embryo tail, the main axis is the anterioposterior (AP) axis that runs from the head to the tip of the tail. As the different tissue layers are all nearly parallel to this axis, the boundaries between the layers are defined on the planes orthogonal to it (See Figure 1).
We define the curvicylindrical transformation as follows. Each point X = [x, y, z] in the Cartesian coordinate is mapped to the point X′ = [r, θ, ρ], where ρ is the distance on the anterioposterior axis from the starting point P0 in the head; r represents the distance from this axis on the orthogonal plane and θ is the angle from the dorsoventral axis on this plane. The transformation can be written as follows.
| (1) |
| (2) |
| (3) |
where, Px is the projection of point X onto the AP axis, and P0 is the starting point of this axis. The distance function dAP measures the length of the curve on the AP axis that connects the two points. The normal vector is on the orthogonal plane that intersects the AP axis at Px, and points to the dorsal-ventral direction. 〈.,.〉 represents the inner product of the two vectors. Figure 2-a illustrates the axes in our system with respect to the tail. Part of the tail is shown along with the cross section of the tail on the orthogonal plane.
Fig. 2.
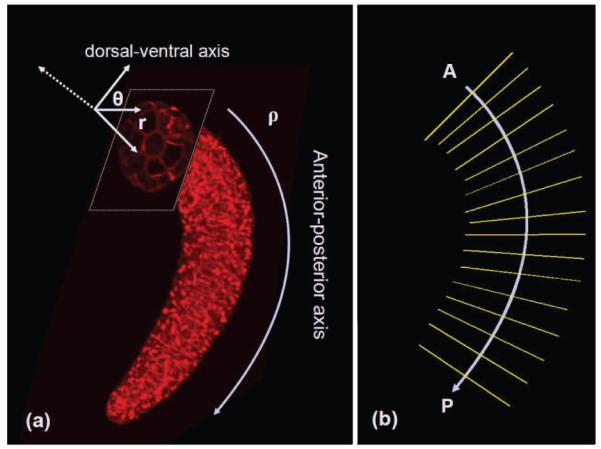
(a) The curvicylindrical coordinate system with respect to part of an ascidian tail; (b) sampling planes, which are orthogonal to the AP axis.
Since the notochord is the central structure in the tail, we chose the midline of the notochord to be the anterioposterior axis for our coordinate system. This line is slightly different from the medial axis of the embryo tail due to the fact that the notochord is not exactly in the center of the tail, and is not perfectly parallel to the boundaries of the volume. Thus, we select a few points (4-5) along the notochord midline and use cubic interpolation to obtain the AP axis.
After finding the AP axis, the volume is resampled on the planes orthogonal to this axis (See Figure 2-b). However, instead of resampling all the points in the volume, we only consider a quantified number of contours on the orthogonal planes and sample along those contours. Each contour traverses one of the three tissue layers in the tail (notochord, muscle-neural tube-gut, and skin layers) as shown in Figure 3.
Fig. 3.

Sampling contours for the three tissue layers in an ascidian embryo, from left to right: notochord, muscle and skin layers.
The cross section of the tail is usually not a perfect circle. Thus, to ensure that each sampling contour remains inside only one layer, the contours are obtained by morphological erosion of the binary mask of the embryo. The structuring elements used for the erosion are binary disks with radii of , where is the average radius of the cross section, and 0 < αi < 1 for i = 1, 2, 3. Based on our dataset, we selected the ratios α1, α2, and α3 for notochord, muscle and skin layers to be 0.8, 0.45 and 0.15 respectively.
For each value of , the closest point on the contour with that angle is sampled. We chose N to be 360 for a dense sampling. In order to enhance the quality of the edges and reduce the noise, we average the values over a number of pixels on the neighboring contours.
3. TISSUE UNWRAPPING
By acquiring the values around the sampling contours, as described in the previous section, we obtain 2D images of “unwrapped tissue layers” on the ρ – θ planes. This representation reduces the dimensionality from 3D to 2D and allows biologists to view different aspects of the entire tissue in one image. In addition to the visualization advantages, the unwrapping process facilitates the cell initialization step, which is necessary for most cell segmentation algorithms as will be described in Section 4.
Figure 4 shows the three tissue layers (notochord, muscle and skin layers) of a sample embryo. In the notochord layer, the values around the contour are ideally zero unless the plane is located at the boundary between two consequent notochord cells. This gives the unwrapped notochord layer a ladder-like pattern (Figure 4-a). In the second layer, the two symmetrical patterns of large cells on the right and the left (Figure 4-b) are muscle cells, whose lateral sections along the AP axis have hexagonal or pentagonal shape. The strips between these two patterns are neural tube and endodermal strand.
Fig. 4.
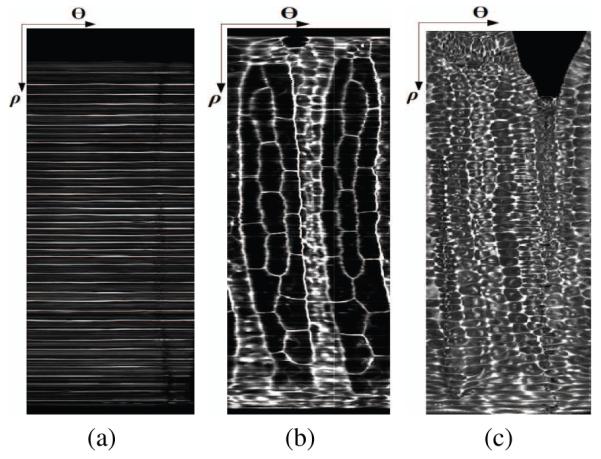
The unwrapped tissue layers of ascidian embryo tail: (a)notochord, (b) muscle-neural tube-gut, and (c) skin.
4. CELL SEGMENTATION
As the largest cells in the tail, the 40 notochord cells and 36 muscle cells are of particular interest and importance in our morphogenesis studies. Therefore, accurate segmentation of these cells is crucial to us. In the original 3D volume it is difficult to manually place a seed point for segmentation inside each of these 76 cells, as the relevant coordinates are spread across many z planes. Moreover, because of the uneven intensity of cell membrane staining, segmentation can leak into the neighboring tissues unless the cells in those tissues are also initialized. After unwrapping the tissue layers (Section 3), the initialization process becomes straightforward and is done in a semi-automatic manner quickly and accurately as described below.
The segmentation is done as follows. First, the 3D coherence enhancing diffusion filtering [6] is used to enhance cell membranes and reduce the noise. Then, the initialization is done on the three unwrapped images (Figure 4). The 40 initial points for notochord cells are obtained by projecting the ladder-shape layer in Figure 4-a into the ρ axis. The 39 boundary lines are first detected as the local maxima of the projection. The mid point between each pair of lines is considered a notochord seed point. For the 1st and the 40th cells, the distance between the second cell and first line, and the distance between the 39th cell and last line, are used respectively. An example of notochord initialization is shown in Figure 5-a.
Fig. 5.
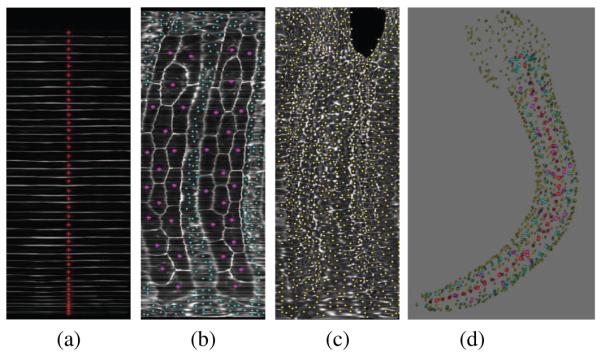
Initialization is done using the 2D tissue images as in (a), (b) and (c). The obtained seed points are converted back into the original coordinates for segmentation as shown in (d).
The 36 muscle cells are initialized manually on the corresponding unwrapped layer (the magenta points in Figure 5-b). Also, a rough bounding polygon for the muscle region is generated by selecting a number of points around the borders of this region. This polygon is used to mask the muscle region before initialization of the remaining cells.
For the remaining tissues (neural tube, gut and skin), the unwrapped images are divided into non-overlapping blocks of size K × K pixels (K = 15 in our experiments). In each block, the point with minimum intensity is selected as the initial point. This provides a dense sampling inside the cells that were not of our interest in this study, which prevents the segmentation of the muscle and notochord cells from leaking into other tissues.
After obtaining all the initial points on the 2D images, their coordinates are converted back to the original XYZ coordinate system (Figure 5-d) and the segmentation is performed in that coordinate space. With our typical images, these initial points give rise to a good segmentation using the seeded watershed transform [7], though more sophisticated methods could also be used. We segmented the muscle and notochord cells in a set of 21 embryos at 9 different stages of tail extension. Figures 6 and 7 illustrate examples of the segmentation results for muscle and notochord cells.
Fig. 6.
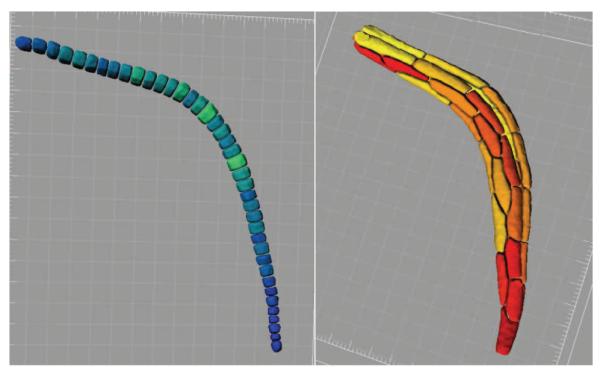
Segmentation results for notochord cells (left) and muscle cells (right).
Fig. 7.
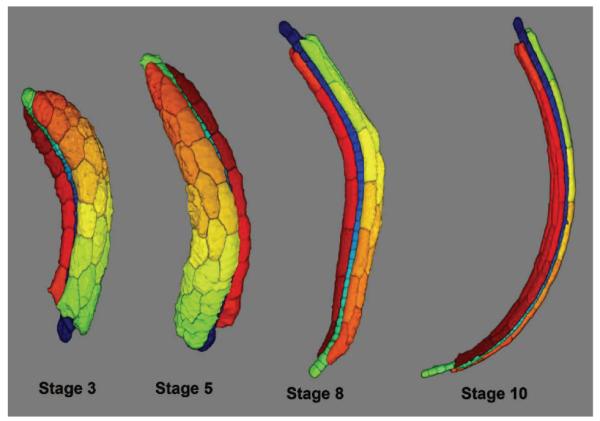
3D rendering of segmented muscle and notochord cells at four different stages.
5. TISSUE SEGMENTATION
Another problem that can be simplified in the CC coordinate system is tissue segmentation, which can be defined as finding the boundaries of different tissue layers without segmenting individual cells. In the case of the ascidian tail the layers are formed around the notochord in a curved cylindrical shape. Thus, in the curvicylindrical coordinate system, the boundaries are approximately parallel to the θ axis in the θ–r planes (Figure 8). Therefore, the problem can be defined in this plane as finding almost horizontal paths with highest accumulative intensity that run from θ = 0 to θ = 2π Marching (FM) algorithm [5] for finding minimum energy paths in the image with inverted intensity (negative image).
Fig. 8.
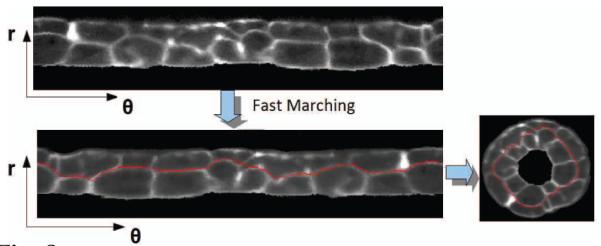
Using Fast Marching to find the tissue boundaries, which are parallel to the θ axis in the curvicylindrical coordinate system.
There is one issue that compromises the results of this method. As mentioned before, the tail is usually not a perfect cylinder (See the cross section images on the left of Figure 10). Thus, the tissue boundaries deviate significantly form a horizontal line in the r – θ plane, which results in the failure of the FM method. Although this deformation does not affect the notochord significantly, it does deform the second and third layers. Thus, the above mentioned method works well for finding the boundary between the notochord and the muscle layer but it may fail for detecting the boundaries between the second and third layers. To address this issue we employed a 3D non-rigid registration method based on thin plate spline (TPS) interpolation [8] to register the tail into a semi-cylinder after straightening the AP axis (sampling the orthogonal planes), and before transformation into polar coordinates. A number of points on the outer boundary of the tail and on the notochord boundaries are used to find the transformation into a semi-cylindrical model (Figure 9) that consists of a stack of circles whose radii are estimated based on the sampled boundary points.
Fig. 10.
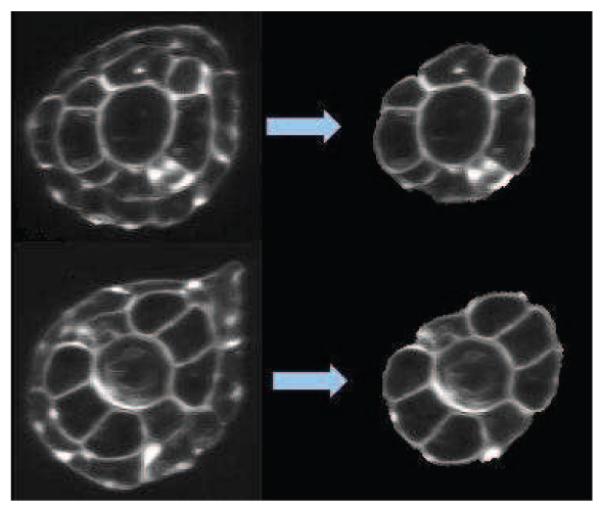
Results of the skin layer detection (left: original cross sections, and right: result of skin layer detection and removal.
Fig. 9.
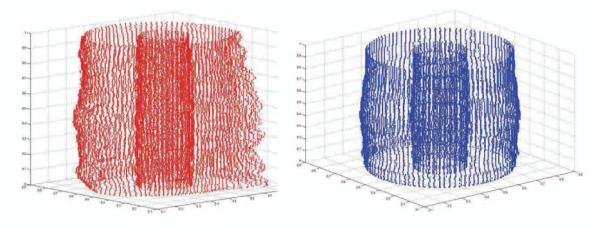
Non-rigid registration of the the tail points (left) into a semi cylindrical model (right).
After registration, the volume is mapped into the curvicylindrical coordinate system and fast marching is employed to find the boundaries between the tissue layers as described above. Figure 10 shows results of the skin layer identification and removal in the tail.
6. EXPERIMENTAL RESULTS
Using our initialization approach, we employed 3D watershed to segment a set of 21 embryos (840 notochord cells and 756 muscle cells). The results were visually verified by an expert. The segmentation results were classified into 3 classes: (1) correctly segmented, (2) mostly correct with small leaking blobs, and (3) unacceptable boundaries. Out of the 1596 segmented cells, 97 (6%) were classified in the second class, where the cell is correctly segmented but is attached to an extra blob (with the average volume of 5% of the actual volume). 18 cells (1.1%) were classified in the third class, while the rest (92.9%) were labeled as correct.
For objective validation of the results, we manually generated a ground truth for 40 cells in 3D 1. The precision, recall and F measure were obtained by measuring the intersection of the segmented and ground truth volumes. The average precision, recall and F with their standard deviation were P = 91.2% (σP = 3.1), R = 92.3% (σR = 2.6), and F = 91.7% (σF = 1.7) respectively.
7. CONCLUSION
In this paper we proposed an object-oriented basis system, which transforms the microscope-centered images of ascidian embryo tail into the curvicylindrical coordinate system based on the structure of the embryo. Through this representation, we were able to decouple the multi-layered 3D volume to a few 2D images of unwrapped tissue layers. As shown here, this representation facilitated both visualization and quantitative analysis of cell shapes through high quality cell and tissue segmentation.
Acknowledgments
This work was sponsored by grant HD059217 from NIH.
Footnotes
The authors would like to thanks Diana Delibaltov for generating the ground truth.
REFERENCES
- [1].Peng Hanchuan, Long Fuhui, Liu Xiao, Kim Stuart K., Myers Eugene W. Straightening caenorhabditis elegans images. Bioinformatics. 2008;24(2):234–242. doi: 10.1093/bioinformatics/btm569. [DOI] [PMC free article] [PubMed] [Google Scholar]
- [2].Ortiz De Solorzano C, Malladi R, Lelivre SA, Lockett SJ. Segmentation of nuclei and cells using membrane related protein markers. Journal of Microscopy. 2001 Mar;201(3):404–415. doi: 10.1046/j.1365-2818.2001.00854.x. [DOI] [PubMed] [Google Scholar]
- [3].Zanella C, Campana M, Rizzi B, Melani C, Sanguinetti G, Bourgine P, Mikula K, Peyrieras N, Sarti A. Cells segmentation from 3-d confocal images of early zebrafish embryogenesis. Image Processing, IEEE Transactions on. 2010 Mar;19(3):770–781. doi: 10.1109/TIP.2009.2033629. [DOI] [PubMed] [Google Scholar]
- [4].Luengo-Oroz M, Duloquin L, Castro C, Savy T, Faure E, Lombardot B, Bourgine P, Peyrieras N, Santos A. Can voronoi diagram model cell geometries in early sea-urchin embryogenesis?; 5th IEEE International Symposium on Biomedical Imaging, ISBI 2008; 2008.pp. 504–507. [Google Scholar]
- [5].Sethian JA. A fast marching level set method for monotonically advancing fronts. Proc. Nat. Acad. Sci. 1995:1591–1595. doi: 10.1073/pnas.93.4.1591. [DOI] [PMC free article] [PubMed] [Google Scholar]
- [6].Weickert Joachim. Coherence-enhancing diffusion filtering. Int. J. Comput. Vision. 1999;31(2-3):111–127. [Google Scholar]
- [7].Meyer F, Beucher S. Morphological segmentation. Journal of Visual Communication and Image Representation. 1990;1(1):21–46. [Google Scholar]
- [8].Chui Haili, Rangarajan Anand. A new point matching algorithm for non-rigid registration. Comput. Vis. Image Underst. 2003;89(2-3):114–141. [Google Scholar]


