Abstract
To date, the lack of a method for inducing plant cells and their Golgi stacks to differentiate in a synchronous manner has made it difficult to characterize the nature and extent of Golgi retailoring in biochemical terms. Here we report that auxin deprivation can be used to induce a uniform population of suspension-cultured tobacco (Nicotiana tabacum cv BY-2) cells to differentiate synchronously during a 4-d period. Upon removal of auxin, the cells stop dividing, undergo elongation, and differentiate in a manner that mimics the formation of slime-secreting epidermal and peripheral root-cap cells. The morphological changes to the Golgi apparatus include a proportional increase in the number of trans-Golgi cisternae, a switch to larger-sized secretory vesicles that bud from the trans-Golgi cisternae, and an increase in osmium staining of the secretory products. Biochemical alterations include an increase in large, fucosylated, mucin-type glycoproteins, changes in the types of secreted arabinogalactan proteins, and an increase in the amounts and types of molecules containing the peripheral root-cap-cell-specific epitope JIM 13. Taken together, these findings support the hypothesis that auxin deprivation can be used to induce tobacco BY-2 cells to differentiate synchronously into mucilage-secreting cells.
As already recognized by plant anatomists in the latter half of the 19th century and recently rediscovered with the introduction of novel antibody probes, plant tissues can be distinguished not only by their size and shape, but also by the chemical properties of the cell walls of each tissue (Knox and Roberts, 1989; Pennell et al., 1989; Knox et al., 1991; Roberts, 1994). Because the Golgi apparatus is the site where the bulk of the cell wall matrix molecules are synthesized (e.g. complex polysaccharides, AGPs, and Hyp-rich glycoproteins), it is obvious that during tissue development the secretory apparatus of each cell must adapt to the changing synthetic demands associated with the production of different types of cell wall molecules (Driouich et al., 1994).
Direct evidence for the tissue-specific retailoring of plant Golgi stacks has come mainly from two sources: electron microscopic observations of cryofixed cells and immunocytochemical studies of cells labeled with antibodies against defined epitopes of cell wall molecules. For example, in tobacco (Nicotiana tabacum) and Arabidopsis root tips, characteristic changes in both the architecture and the cisternal-staining patterns of Golgi stacks have been shown to accompany the developmental differentiation of meristematic cells, first into gravity-sensing columella cells and then into slime-secreting peripheral cells (Staehelin et al., 1990). Similarly, activation of the secretory apparatus of barley aleurone cells by the hormone GA3 leads not only to an increase in the number and size of Golgi-associated vesicles, but also to changes in the size distribution of freeze-fractured particles in the Golgi membranes (Fernandez and Staehelin, 1985).
In clover root tips certain pectic polysaccharide epitopes are typically associated with the medial and cis-Golgi cisternae in cortical cells, but in peripheral root-cap cells they are associated with the trans-Golgi cisternae and the TGN (Lynch and Staehelin, 1992, 1995). Similar variations in Golgi-enzyme localization have been found in different animal cell types (Roth, 1991).
Tissue-specific retailoring of plant Golgi stacks has also been found to include the development of structures known as intercisternal filaments, which are located between trans cisternae and sometimes between medial-trans cisternal pairs of Golgi stacks in mucilage-secreting cells, but not in meristematic cells (Mollenhauer, 1965; Turner and Whaley, 1965; Mollenhauer and Morré, 1975; Staehelin et al., 1990). Although their function has yet to be determined, the fact that they seem to align with protein complexes in the cisternal membranes suggests that they may anchor the Golgi enzymes involved in mucilage synthesis, thereby preventing them from being dragged into the large secretory vesicles during the packaging of these very large molecules (Staehelin et al., 1990).
The characterization in plants of the nature and extent of Golgi retailoring in biochemical terms requires the isolation and purification of Golgi stacks from specific cell types in quantities sufficient for biochemical analysis. Because cost-effective methods for producing such Golgi fractions from plant tissues have yet to be formulated, we have sought to develop an alternative approach by inducing a uniform population of suspension-cultured cells to differentiate in a synchronous manner.
Plant growth and development is controlled to a significant extent by seven types of hormones: auxins, cytokinins, GAs, ethylene, ABA, brassinosteroids, and jasmonates. In this study we have focused on the role of auxins in the differentiation of slime-secreting cells. Auxins are a group of natural and synthetic plant hormones that affect cell growth and division (Taiz and Zeiger, 1991). For example, the application of the natural auxin IAA to shoots stimulates cell elongation, whereas its application to roots inhibits elongation and promotes adventitious root formation. At the cellular level, one of the earliest responses in pea stem epidermal cells to IAA treatment is a transient increase in the percentage volume fraction of Golgi stacks in the cytoplasm, but this increase lasts for less than 90 min (Cunninghame and Hall, 1985). A more sustained increase in the amount of Golgi material, in parallel with increased rates of cell elongation, has been noted in IAA-treated oat coleoptiles (Quaite et al., 1983).
Auxin also affects a number of developmental processes, such as gravitropism, leaf abscission, and fruit development. Removal of auxin from the growth medium of suspension-cultured carrot cells has been shown to cause their arrest in G1 (Nishi et al., 1977) and to induce rapid cell elongation (Lloyd et al., 1980). Furthermore, auxin deprivation can be used to induce anthocyanin production (Ozeki and Komamine, 1981), alterations in cell wall polysaccharides (Masuda et al., 1984), and glycosidase activities (Masuda et al., 1985).
Based on these findings, we hypothesized that by manipulating auxin levels, we may also be able to manipulate the secretory activity and functional organization of Golgi stacks in tobacco BY-2 cells in a reproducible manner. The BY-2 cell line (Nagata et al., 1992) is well suited for experimental studies; it grows quickly and its cell cycle can be synchronized to about 70% with a combination of aphidicolin and propyzamide (Nagata et al., 1992; Samuels et al., 1995). More importantly for our studies, BY-2 cells can be grown with only the synthetic auxin analog 2,4-D as a hormone supplement. Therefore, one would expect the cells to respond to the removal of this hormone from the growth medium.
Here we report that auxin deprivation can be used to induce tobacco BY-2 cells to differentiate synchronously into a mucilage-secreting type of cell during a 4-d period. The cells stop dividing and undergo a process of synchronized elongation and differentiation, which includes morphological changes in Golgi stack membranes and biochemical changes in glycoprotein and proteoglycan secretion. We discuss the potential usefulness of this system in studying the molecular basis of tissue-specific Golgi stack retailoring in plants.
MATERIALS AND METHODS
Plant Materials and Culture Conditions
Suspension-cultured tobacco (Nicotiana tabacum cv BY-2) cells were kindly provided by Dr. R. Cyr (Department of Biology, Pennsylvania State University, University Park) and cultured in a modified Murashige-Skoog basal salt medium (no. 5524, Sigma) in which KH2PO4, thiamine-HCl, and inositol were increased to 370, 1, and 100 mg/L, respectively. The cells grown in this medium were supplemented with 3% Suc and 0.2 mg/L 2,4-D at pH 5.0 on a shaker (125 rotations/min) at 25°C in the dark. Cells were subcultured by regularly transferring 2 mL of a 7-d-old culture into 100 mL of fresh medium in a 500-mL flask.
Auxin-deprivation experiments for microscopy were performed by briefly centrifuging (30 s at 200g) 2 mL of a 7-d culture, washing the cells twice with modified Murashige-Skoog medium prepared without 2,4-D, and resuspending the cells in 100 mL of the auxin medium in a 500-mL flask as before.
Light Microscopy and DAPI Staining
Light micrographs of control and auxin-deprived tobacco BY-2 cells were taken (Axioskop MC100 microscope, Zeiss), and cell lengths and widths were measured from negatives. In cells found in files, cell length was defined as the dimension perpendicular to the plane of cell division. In isolated cells, cell length was defined as the longest dimension.
BY-2 cell nuclei were stained with DAPI. Cells were fixed with ethanol:acetic acid, 3:1 (v/v) for 1 h, briefly spun in a microcentrifuge at 3000g, resuspended in culture medium, and brought to 1 μg/mL DAPI. The mitotic index (the percentage of cells in mitosis) was determined using a fluorescence microscope (Zeiss) with an excitation filter of 365 nm and a barrier filter of 420 nm.
The rat monoclonal antibody JIM 13 was a generous gift of Drs. Paul Knox and Keith Roberts and is described by Knox et al. (1991).
High-Pressure Freezing and Freeze Substitution
Five- to 7-d-old cultures were harvested by centrifugation (1000g) and mixed in a 1:9 (v/v) ratio with 20% (w/v) aqueous dextran (Mr 38,800) in fresh culture medium to act as an extracellular cryoprotectant. This cell suspension was then poured onto a 30-μm nylon mesh and further concentrated by wicking off the liquid over the lip of an Erlenmeyer flask. Specimens were frozen in a high-pressure freezing apparatus (model HPM010, Balzers, Hudson, NH), as described by Craig and Staehelin (1988), and were stored in liquid nitrogen before freeze substitution. Samples were freeze substituted by the method of Zhang and Staehelin (1992), infiltrated at room temperature for 5 to 6 d in increasing concentrations of resin diluted in acetone, and embedded either in Embed 812 or London Resin White (Polysciences, Warrington, PA) at 55°C overnight.
Electron Microscopy
Thin sections (about 0.1 μm) were cut (Ultracut E, Reichert, Vienna, Austria) and picked up on Formvar-carbon-coated copper or nickel grids (200 mesh, Polysciences). The Embed 812-embedded sections were mounted on copper grids and counterstained with 2% uranyl acetate in water for 5 min and Reynold's lead citrate for 1 min, and examined at 80 kV in an electron microscope (model CM10, Philips, Eindhoven, The Netherlands). Nickel grids were used exclusively for antibody-labeling experiments.
The number of trans and total cisternae were counted from electron micrographs of Golgi at 4 d for control cells and at 1.5 and 4.5 d for auxin-deprived cells (n > 45). Comparisons were made between the groups using an ANOVA test.
The London Resin White-embedded sections were immunolabeled with JIM 13 (at full strength) and a 10-nm colloidal gold-conjugated goat anti-rat secondary antibody using the method of Zhang and Staehelin (1992). The average number of gold particles per Golgi and per equivalent area of cytoplasm (0.14 μm2) were counted for controls and for cells subjected to 1.5 and 4 d of auxin deprivation. Comparisons were made between the groups using an ANOVA test.
Secreted Material
Secreted material was collected from BY-2 cells grown with or without auxin at 3 d after subculture. Ten grams of cells was incubated in 200 mL of culture for 3 h at 24°C. The medium was collected and the insoluble material was spun out at 27,000g for 40 min at 4°C. Secreted proteins were collected by dialyzing the samples against distilled water with a 12,000 to 14,000 Mr cutoff membrane (no. 25225-260, VWR Scientific, West Chester, PA). Secreted proteins were analyzed by standard SDS-PAGE on 12 to 15% gradient gels. Samples were normalized for protein concentration before loading, and the gels were silver stained (Blum et al., 1987).
Gels were blotted to nitrocellulose, and the expression of the JIM 13 epitope was analyzed by the standard western-blot procedure. The expression of glycoproteins was analyzed by a modified western-blot procedure using horseradish peroxidase-conjugated concanavalin A (no. L8146, Sigma) for the detection of high-Man N-linked glycans and UEA-1 (no. L6397, Sigma) for the detection of complex N- and O-linked glycans.
AGPs were analyzed quantitatively and qualitatively by rocket and crossed-gel electrophoresis, respectively. The method of van Holst and Clarke (1986) was used, except that 15 (instead of 30) μg/mL of β-glucosyl Yariv's artificial antigen (no. 100-4, Biosupplies Australia, Parkville) was used in the gel. A linear relationship between AGP concentration and rocket height was confirmed with gum arabic (Biosupplies Australia) as a standard.
RESULTS
Effects of Auxin Deprivation on Cell Division and Cell Elongation
Tobacco BY-2 cells were subcultured into fresh Murashige-Skoog medium containing either 0.2 mg/L 2,4-D (control) or no 2,4-D (auxin deprived). Cells deprived of auxin remained physiologically active for about 1 week, as judged by their cytoplasmic streaming and by their ability to be stained with fluorescein diacetate, a vital dye (data not shown).
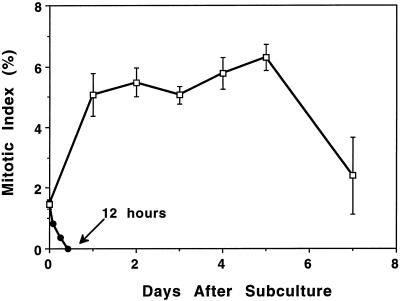
Cells were fixed with ethanol:acetic acid, 3:1 (v/v), stained with DAPI, and observed under a fluorescence microscope to determine the effects of auxin deprivation on the mitotic index. Mitotic nuclei were counted and the mitotic index was determined at different time points after subculture. We found that in cells of a 7-d culture, after about 12 h of auxin deprivation, the mitotic index dropped from 1.5 to 0%, in contrast to that of control cells, which increased from 1.5 to 6% 1 d after subculture (Fig. 1).
Figure 1.
Inhibition of cell division is induced by auxin-deprived growth conditions. The average mitotic index of control cells (□) increased from 1.5 to about 6% after 1 d. The average mitotic index of auxin-deprived cells (•) decreased from 1.5 to 0% after 12 h. se is indicated for each data point by error bars.
BY-2 cells were deprived of auxin for variable amounts of time and transferred back into control growth medium to test whether the cells cultured without auxin lost their ability to reenter the cell cycle. Their mitotic indices were then monitored. These experiments demonstrated that cells deprived of auxin for up to 5 d were able to reenter the cell cycle, but the longer they went without auxin, the longer they took to recover. For example, after 3 d of auxin deprivation the mitotic index of the cells transferred to the auxin-containing medium took about 7 d to return to control levels (about 6%).
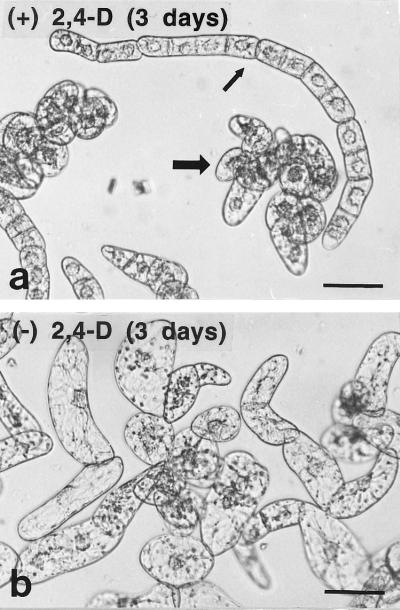
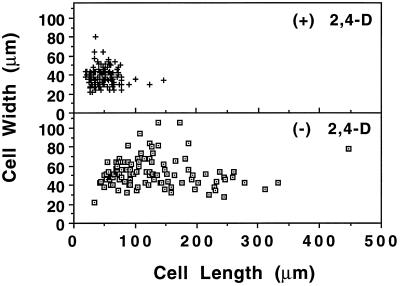
Auxin deprivation also caused a change in general cell size and shape (Fig. 2). Within 24 h most of the auxin-deprived cells began to form clumps, in contrast to the mostly chain-like structures of control cultures. The lengths and widths of more than 100 cells were measured after 3 d in both control and auxin-deprived media (Fig. 3). The scatterplots show that auxin deprivation not only caused an increase in average length and width, but also in the variance of sizes. The outliers in the scatterplot after auxin deprivation were both long, thin cells and large, round cells.
Figure 2.
Light micrographs of BY-2 tobacco cells 3 d after subculture with (a) and without (b) auxin. Control cells were found both in long chains (small arrow) and in clusters (large arrow). Auxin-deprived cells were elongated and did not form chains. Bars = 0.2 μm.
Figure 3.
Scatterplot showing length and width of both control (top) and auxin-deprived (bottom) cells. Although auxin deprivation caused an increase in both average cell length and width, the most striking change was in cell length. The variance of the values also increased with auxin deprivation.
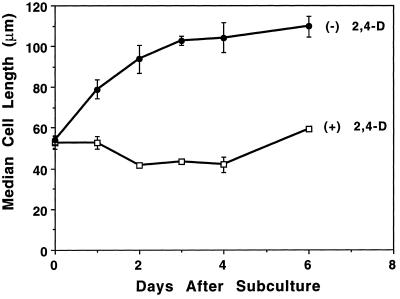
Cell length was measured at different times and the median length was calculated for each to further analyze the effects of auxin deprivation on cell size. An average median length was determined based on three separate experiments (Fig. 4). This dimension was chosen because the greatest overall change in cell size was in length rather than in width (Fig. 3). Whereas the length of control cells varied between 40 and 60 μm during the 6-d culturing period (the slight decrease in length after 1 d corresponding to the increase in mitotic index), auxin-deprived cells essentially doubled their average length, from 54 to 110 μm during the first 3 d of culturing, and then maintained that length. An increase in the size of the vacuoles appeared to drive most of this growth.
Figure 4.
Auxin-deprived growth conditions induced elongation of BY-2 cells. The median cell length of the control cells (□) varied between 40 and 60 μm and decreased after 1 d. This decrease corresponded to the increase in mitotic index (Fig. 1). The median cell length of the auxin-deprived cells (•) increased to 110 μm after 3 d and then tapered off. se is indicated for each data point by error bars.
Morphological Changes in the Golgi Apparatus
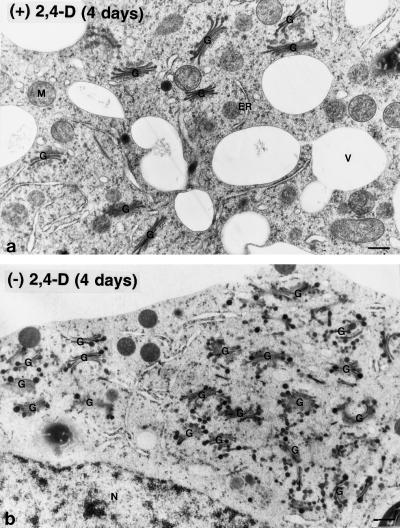
Morphological changes in the Golgi apparatus of auxin-deprived BY-2 cells were analyzed in cells preserved by high-pressure-freezing/freeze-substitution methods and examined by electron microscopy. In control cells the Golgi stacks were typically dispersed singly or in small groups throughout the cytoplasm and did not change their morphological characteristics during a 6-d culturing period (Fig. 5a). In contrast, auxin deprivation caused major clustering of the Golgi stacks in the vicinity of the nucleus (Fig. 5b) and systematic changes in Golgi stack architecture (Figs. 6 and 7). The clustering was already pronounced within 24 h of treatment, whereas the morphological changes progressed more gradually.
Figure 5.
Electron micrographs of Golgi stacks from control (a) and auxin-deprived (b) BY-2 cells. In the control cells the Golgi stacks had a uniform distribution throughout the cytoplasm. In the auxin-deprived cells the Golgi stacks clustered together near the nucleus. G, Golgi stacks; M, mitochondria; N, nucleus; and V, vacuole. Bars = 0.5 μm.
Figure 6.
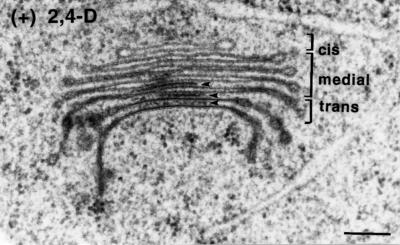
Electron micrograph of a Golgi stack from a control BY-2 cell. The cis, medial, and trans cisternae are labeled. Intercisternal elements are indicated with arrows. Bar = 0.2 μm.
Figure 7.
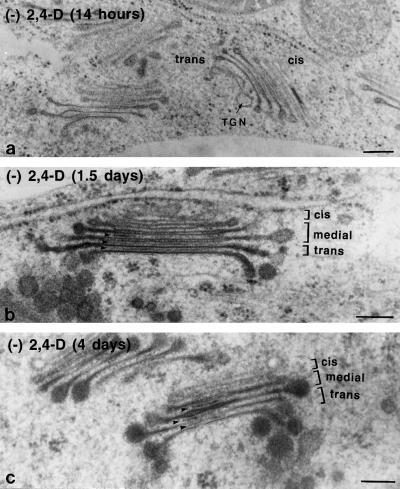
Electron micrographs of Golgi stacks from auxin-deprived BY-2 cells. Cells were fixed at 14 h (a), 1.5 d (b), and 4 d (c) after auxin deprivation. The cis, medial, and trans cisternae are labeled in b and c. Intercisternal filaments are indicated by arrowheads. After 14 h one could already see hypertrophied cisternal margins and a clustering of the stacks. After 1.5 d an increase in the size of the cisternal margins and an increase in the staining of intercisternal elements could be seen. After 3 to 4 d densely staining material appeared in the medial cisternae, and misshapen or thickened regions appeared in the interior of the Golgi stack. Bars = 0.2 μm.
The auxin deprivation-induced alterations in Golgi stack architecture involved both the structure of the different types of cisternae and their marginal buds and the staining of the lumenal contents. A typical control Golgi stack is illustrated in Figure 6. Based on the morphological criteria defined by Staehelin et al. (1991), this Golgi stack possessed one cis, four medial, and two trans cisternae. Typical features of cis cisternae are their end location, smaller-than-average diameter, wider lumen, and relatively light staining of membrane and lumenal contents. The medial cisternae occupy the central section of the stack. They have a well-defined, flat central domain and margins that are both fenestrated and bulbous. The contents of the relatively wide medial cisternae exhibited a mottled staining pattern that increased with density toward the trans cisternae. The trans cisternae were recognized by their osmotically collapsed lumen, where the membranes appeared tightly pressed together, and their darkly staining products. A TGN was seen associated with some but not all Golgi stacks.
Because the TGN was not infrequently displaced to one side of the Golgi stacks in suspension-cultured cells (Fig. 6; see also Zhang and Staehelin, 1992), the lack of a TGN in any given micrograph of a Golgi stack may simply reflect the plane of the section. However, in some instances the trans-most trans-Golgi cisterna assumes certain structural characteristics of a TGN, such as branched marginal domains, suggesting that it may assume TGN functions.
In response to auxin deprivation, the Golgi stacks underwent distinct morphological changes in a synchronized manner (Fig. 7). By 14 h after the cells were transferred to the auxin-free growth medium, the first clustering of Golgi stacks was seen, producing large, ribosome-excluding domains, and some of the trans cisternae exhibited slightly hypertrophied cisternal margins (Fig. 7a). One to 1.5 d after auxin deprivation, large, dense vesicles accumulated around the stacks, and the bulbous margins of all trans cisternae became hypertrophied (Fig. 7b). In addition, the TGN disappeared from the trans side of the Golgi stacks and was replaced by an accumulation of densely staining vesicles. After 3 to 4 d, the bulbous margins of the trans- Golgi cisternae doubled in diameter from 45 to more than 90 nm, which corresponds to an 8-fold increase in volume, and their contents became more heavily and uniformly stained (Fig. 7c). Densely staining contents also accumulated in the medial Golgi cisternae, and the medial and trans cisternae more frequently developed misshapen or expanded regions in the interior of the Golgi stacks.
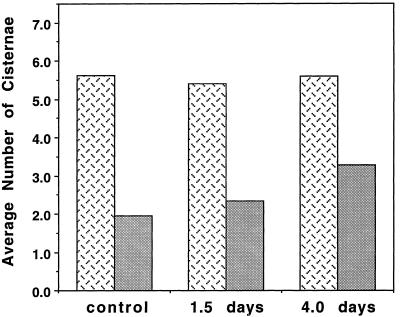
Although the total number of Golgi cisternae per stack did not change significantly during auxin deprivation, the average number of trans-type cisternae per stack increased from 1.9 for control cells, to 2.4 for 1.5-d auxin-deprived cells, to 3.3 for 4-d auxin-deprived cells (Fig. 8). ANOVA of the number of trans-type cisternae in the control, 1.5-d, and 4-d groups showed P < 0.0001 (F value = 40.3), a significant difference. There was no significant difference in total number of cisternae between the three groups (P = 0.464, F = 0.772). The total number of Golgi stacks counted was 74 for the control group, 54 for the 1.5-d group, and 47 for the 4-d group.
Figure 8.
Histogram illustrating the auxin-deprivation-induced increase in the number and proportion of trans-type cisternae (gray bars) in relation to the total number of cisternae (stippled bars). The total number of cisternae did not significantly change over time, but the average number of trans-type cisternae increased after 1.5 and 4 d of auxin deprivation.
Golgi stacks of control BY-2 cells also contain small sets of parallel, 3- to 5-nm-diameter, intercisternal fibers sandwiched between their trans cisternae (and sometimes also between the trans-most medial cisternae [Fig. 6]; see also Staehelin et al., 1990). In cells grown in auxin-deprived conditions, both the number of intercisternal fibers and the general staining of these fibrous domains increased significantly (Fig. 7c).
Changes in the Composition of Secreted Proteins
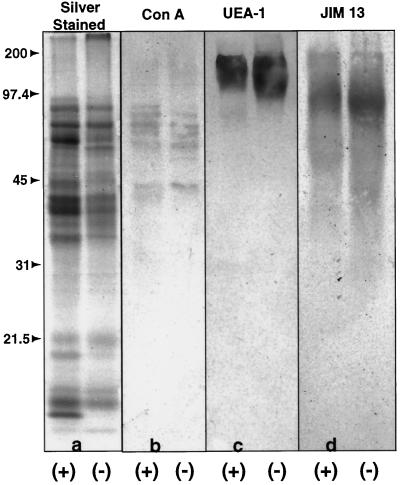
To characterize biochemically the effects of auxin deprivation on the secretory pathway of tobacco BY-2 cells, we analyzed changes in the secreted proteins by SDS-PAGE and by peroxidase-conjugated lectin western blotting. BY-2 cells deprived of auxin for 3 d secreted more than twice the amount of protein as control cells (4.2 ± 0.32 μg/mL total protein in control cells versus 8.9 ± 1.8 μg/mL in auxin-deprived cells). Analysis of the secreted proteins by SDS-PAGE (Fig. 9a) demonstrated further that auxin deprivation also produced qualitative changes in the profile of secreted proteins. When samples were normalized for protein concentration, the SDS gels of the secreted proteins of the control cultures appeared to have more and darker-staining bands. Bands that appeared in the control samples that were absent or at reduced levels in the auxin-deprived samples were found at approximately 7, 18.5, 35 (a doublet in the control sample became a singlet in the auxin-deprived sample), 60, 92, and 134.5 kD. On the other hand, a small number of bands in the auxin-deprived sample were found at higher levels of staining than in the control sample, including proteins at 4, 27.2, 52, and >200 kD. Because this last band was very diffuse and barely entered the gel, it possibly represented a very large glycoprotein, a covalently cross-linked protein aggregate, or a very basic protein-like extensin that does not migrate normally on SDS gels.
Figure 9.
SDS-PAGE (a) and western blots (b–d) of secreted material from control (+) and auxin-deprived (−) BY-2 cells. Molecular mass in kilodaltons is indicated to the left of the gels. All lanes were loaded with equal amounts of proteins. Western blots were probed with the lectins concanavalin A (Con A) and UEA-1 and with the monoclonal antibody JIM 13. b, Concanavalin A, a Man-specific lectin, showed minor changes in a set of N-linked glycoproteins between 45 and 97.5 kD. c, UEA-1, a Fuc-specific lectin, showed a major increase in a single, diffuse band between 100 and 200 kD. d, JIM 13, a marker of root-cap differentiation, showed an increase in staining between 40 and 180 kD. All gel images were digitized.
Lectin western blots were used to characterize changes in secreted glycoproteins. Concanavalin A is a Man-specific lectin, making it a useful marker of N-linked glycoproteins. UEA-1 is a Fuc-specific lectin that has been used as a marker of N- and O-linked mucin-like glycoproteins (Mitsui et al., 1990). Concanavalin A faintly stained a number of bands between 45 and 97.5 kD in both control and auxin-deprived samples (Fig. 9b). Although, on the whole, the proteins in the control lane were of slightly higher apparent molecular mass than those in the auxin-deprived lane, there were only a few differences in the banding patterns. The control samples showed a greater staining of protein bands at 51 and 89 kD, whereas the auxin-deprived samples showed a greater staining of a band at 73 kD. UEA-1 stained a single large diffuse band between 100 and 200 kD in both control and auxin-deprived auxin lanes (Fig. 9c). The auxin-deprived band was broader (extended farther down the gel) than the control band, suggesting that there was an increase in the production of a high-molecular-mass, mucin-like glycoprotein. This band, although very large, still did not coincide with the high-molecular-mass material at the top of the auxin-deprived polyacrylamide gel.
Analysis of AGPs
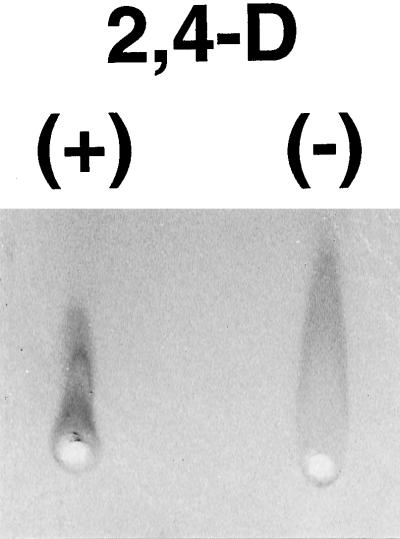
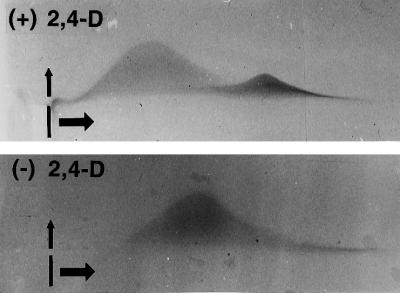
To assess total AGP secretion in 3-d-old control and auxin-deprived cells, rocket-gel electrophoresis with Yariv's artificial antigen (Yariv et al., 1962) was used. Auxin-deprived cells secreted twice as much AGP as control cells, as judged by the height of the rockets (Fig. 10). Crossed-gel electrophoresis of the control AGP samples showed a larger and broader peak of material that migrated more slowly in the horizontal first dimension (size separation), and a second, smaller peak that migrated more quickly (Fig. 11, top). In contrast, only one broad AGP peak with a slight shoulder on its faster-migrating side is seen in the auxin-deprived cell sample (Fig. 11, bottom). Whereas this shoulder material seems to align with the small peak material of the control cell samples, the major peak of the auxin-deprived AGPs occupies a distinctly different position on the gels between the two peaks of the control.
Figure 10.
Quantitative differences in AGPs from control (+) and auxin-deprived (−) cells. Rocket-gel electrophoresis with β-glucosyl Yariv's artificial antigen was used to quantitatively compare control and auxin-deprived secreted material from BY-2 cells. The auxin-deprived cells secreted twice as much AGP as did the control, as shown by the height of the rockets.
Figure 11.
Qualitative differences in AGPs from control (top) and auxin-deprived (bottom) cells. Crossed-gel electrophoresis with β-glucosyl Yariv's artificial antigen was used to qualitatively compare control and auxin-deprived secreted material from BY-2 cells. The wells in which the samples were loaded are indicated. The samples were first run in the horizontal direction and then in the vertical direction. The AGPs from the control cells formed two distinct peaks, whereas those from the auxin-deprived cells formed only one peak. The peak from the auxin-deprived cells traveled farther in the first dimension than did the major peak from the control cells.
Immunoelectron Microscopy with the JIM 13 Antibody
Based on the changes in Golgi morphological features, the altered staining properties of the contents of the enlarged budding vesicles on the trans side of the stacks (Figs. 7 and 8), and the changes in composition of the secretory products (Figs. 9–11), we postulated that the auxin-deprived growth conditions induced a retailoring of BY-2 cell Golgi stacks in a manner similar to the retailoring of the Golgi that occurs during the differentiation of slime-secreting root-tip cells (Staehelin et al., 1990; Lynch and Staehelin, 1992). To further substantiate this hypothesis, we examined the effects of auxin-containing and auxin-deprived growth conditions on the production of molecules containing the JIM 13 epitope, a marker for slime-secreting root-cap cells. Figure 12 demonstrates that JIM 13 is a marker of root-cap differentiation in tobacco cells, since the monoclonal antibody labeled the peripheral slime-secreting cells of the tobacco root cap as it does the carrot root cap (Knox et al., 1991). If tobacco BY-2 cells are related to root-cap cells, then auxin deprivation should either induce the de novo appearance of molecules containing the JIM 13 epitope or increase the amount of JIM 13 epitope-containing molecules produced.
Figure 12.
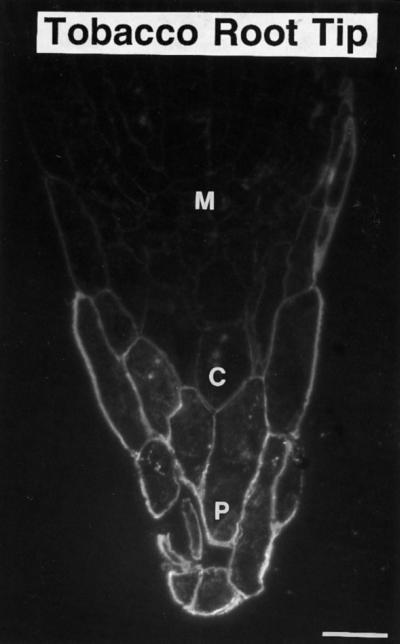
Immunofluorescence micrograph of a tobacco root tip stained with the monoclonal antibody JIM 13. Staining was specifically localized to the peripheral root-cap cells. M, Meristem; C, columella; and P, peripheral root-cap cells. Bar = 50 μm.
We probed western blots of secreted material from the control and auxin-deprived cells with JIM 13 (Fig. 9d). Because the epitope is normally localized to the outer plasma membrane and cell wall, we hypothesized that it would also be released into the extracellular medium. As shown in Figure 9d, both the control and the auxin-deprived cells produced and secreted JIM 13-epitope-containing molecules, but the auxin-deprived cells secreted more than the control cells. Although this increase mimicked the increase in the UEA-1-stained fucosylated glycoproteins (Fig. 9c), the staining patterns shown in Figure 9, c and d, indicate that the JIM 13 epitopes are associated with a different set of proteins than the UEA-1 epitopes. In both the control and auxin-deprived lanes of Figure 9d, the JIM 13-stained material extended from 40 to 180 kD. The most darkly staining zone in both the control and auxin-deprived smears appeared at around 116 kD, and in the auxin-deprived lane this broad band was both more heavily stained and extended farther down the gel than the material in the control lane.
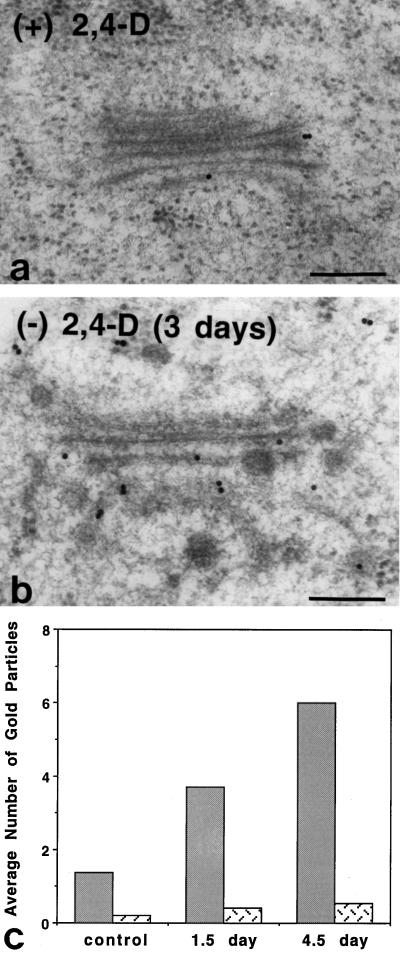
We also immunolabeled high-pressure-frozen/freeze-substituted BY-2 cell sections with JIM 13. A comparison of the immunolabeling patterns of Golgi stacks of control, 1.5-d auxin-deprived cells, and 4.5-d auxin-deprived cells showed a progressive increase in JIM 13 labeling of the Golgi cisternae with the increased time in auxin-deprived growth conditions (Fig. 13). In the 4.5-d cells, the number of Golgi-associated molecules that labeled with JIM 13 was 4-fold higher than in the control cells. ANOVA showed a significant difference between the control, 1.5-d, and 4.5-d groups (P = 0.0006, F = 8.682).
Figure 13.
Immunogold labeling of BY-2-cell Golgi stacks with JIM 13. Immunoelectron micrographs of control (a) and auxin-deprived (b) BY-2 cells showed an increase in the number of gold particles over the Golgi stacks and surrounding cytoplasm in the auxin-deprived cells. c, Histogram illustrating that gold-particle labeling over the Golgi stacks (gray bars) increased from an average of 1.4 particles in control cells, to 3.7 particles in 1.5-d auxin-deprived cells, to 6.0 particles in 4-d auxin-deprived cells. Gold-particle labeling over the surrounding cytoplasm (stippled bars) increased from 0.22 particle in control cells, to 0.40 particle in 1.5-d auxin-deprived cells, to 0.54 particle in 4-d auxin-deprived cells. Bars = 0.2 μm.
A count of gold particles over an area of cytoplasm equivalent to the surface area of an average Golgi stack cross-section (0.14 μm2) also showed a 2-fold increase. Because the small secretory vesicles cannot always be adequately resolved structurally in the samples processed for immunolabeling, they are most likely responsible for this increase in cytosolic immunogold staining. As with the Golgi labeling, there was a significant difference between the control and auxin-deprived values (P < 0.01). The cell walls of both control and auxin-deprived cells exhibited quite heavy gold labeling, but the labeling density was not statistically different between the two types of cells (data not shown). Most likely, the cell walls have a limited capacity to bind JIM 13-epitope-containing molecules, which permits the excess molecules to leach into the growth medium.
DISCUSSION
Auxin Deprivation Causes Tobacco BY-2 Cells to Become Physiologically Synchronized
The goal of this study was to develop a method for inducing plant suspension-cultured cells to differentiate synchronously in a manner that involved a structural and functional retailoring of the Golgi apparatus, analogous to what occurs in plant tissues during normal development. To this end we have demonstrated that tobacco BY-2 cells can be induced to differentiate synchronously by transferring them to an auxin-free growth medium. Auxin deprivation blocked cell division, as seen by a drop in mitotic index, and induced cell elongation, as shown by a doubling of median cell length (Figs. 1–4). Similar developmental responses, a cessation of cell division in G1 (Nishi et al., 1977), and an increase in cell length (Lloyd et al., 1980; Komamine and Kawahara, 1991), were found previously in auxin-deprived suspension-cultured carrot cells.
The principal evidence in support of the hypothesis that auxin deprivation induces tobacco BY-2 cells to undergo a tissue-specific type of differentiation came from changes in the AGPs produced by these cells. AGPs are general markers of tissue differentiation (van Holst and Clarke, 1986). In pea flowers, for example, specific AGPs are excluded from the reproductive cells (Pennell and Roberts, 1990), and in carrot roots, specific AGPs mark the development of such areas as the stele and the root cap (Knox and Roberts, 1989). In maize seedlings, AGPs demonstrate different temporal and spatial expression patterns in cells designated for apoptosis (Schindler et al., 1995). In this study auxin-deprived tobacco BY-2 cells not only secreted greater quantities of AGP, but also produced a qualitatively different type of AGP, as shown by rocket- and crossed-gel electrophoresis (Figs. 11 and 12).
We have yet to determine whether these biochemical changes are caused by an alteration in the protein or polysaccharide portion of the AGPs. However, this qualitative change in AGP secretion is indicative of a differentiation into a new tissue type (van Holst and Clarke, 1986), and suggests that the auxin-deprived cells do undergo a developmental switch. Therefore, auxin deprivation of BY-2 cells appears to be a suitable method for producing large quantities of physiologically synchronized cells. Auxin-deprived cells fulfill the general criteria of tissue differentiation (Taiz and Zeiger, 1991): they are metabolically, structurally, and functionally distinct from control cells. Auxin-deprived cells may therefore be exploited for studying the retailoring of the Golgi apparatus during differentiation.
Auxin Deprivation Induces Changes in Golgi Stack Distribution and Architecture
One of the earliest morphological changes in the Golgi apparatus of auxin-deprived cells is a clustering of the stacks in the vicinity of the nucleus (Fig. 5b). Golgi stack clustering also occurs in plant cells exposed to the secretion-blocking drug brefeldin A (Satiat-Jeunemaitre and Hawes, 1992; Driouich et al., 1993) and the microfilament-depolymerizing drug cytochalasin D (Satiat-Jeunemaitre et al., 1996). Most likely, this clustering is caused by the loss of cytoplasmic streaming and by changes in the Golgi matrix, the ribosome-excluding filamentous matrix that surrounds each Golgi stack and its TGN (Staehelin and Moore, 1995). Because brefeldin A and cytochalasin D induce clustering of the Golgi stacks by different mechanisms (Satiat-Jeunemaitre et al., 1996), it has yet to be determined if auxin deprivation alters Golgi stack distribution by affecting the cytoskeleton, by affecting secretion, or by a combination of both. Antibody staining against the microfilament cytoskeleton in control and auxin-deprived cells is needed to further investigate the effects of auxin deprivation on Golgi stacks.
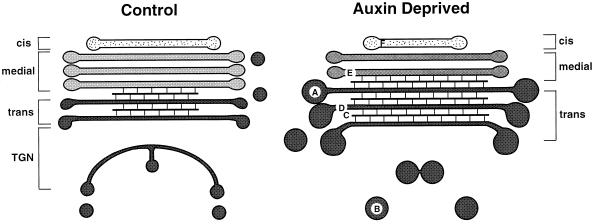
Auxin deprivation also induced a number of morphological changes in the BY-2 Golgi stacks, some of which are diagrammed in Figure 14. Of these, the most important would appear to be the increase in the number and proportion of trans-Golgi cisternae, a doubling of the diameter (which corresponds to an 8-fold increase in volume) of the darkly staining vesicles that bud from the margins of the trans cisternae, and the loss of a distinct TGN system. Although these types of Golgi changes do not resemble those found in a number of differentiated tissues such as tapetal (Steer, 1977), pollen (Hess, 1993), or papillar cells (Kishi-Nishizawa et al., 1990), they do resemble those that accompany the retailoring of Golgi stacks in polysaccharide slime-secreting cells. Golgi stacks with hypertrophied margins and large, densely staining vesicles have been observed in the slime-secreting alga Micrasterias denticulata (Meindl et al., 1992), in pollen tubes of Lilium longiflorum (Lancelle and Hepler, 1992), and in the slime-secreting epidermal and peripheral root-cap cells of maize, tobacco, and Arabidopsis (Whaley et al., 1959; Mollenhauer et al., 1961; Staehelin et al., 1990). In the latter three, Golgi stacks have also been reported to contain increased numbers of trans cisternae and TGN (Staehelin et al., 1990), and to occasionally be clustered together near the nucleus (Whaley et al., 1959). Taken together, the observed changes in Golgi stack architecture of auxin-deprived BY-2 cells closely parallel the changes in Golgi stack morphological features associated with the development of slime-secreting cells.
Figure 14.
Model of the morphological changes in the Golgi apparatus during auxin deprivation. Schematic diagrams of control and auxin-deprived Golgi are shown with the cis, medial, and trans cisternae, and the TGN. Auxin deprivation induces a doubling in diameter of the budding vesicles around the cisternal margins (A), an increase in densely staining vesicles beyond the trans cisternae (B), an increase in the width and staining of intercisternal filaments (C), an increase in the number and proportion of trans cisternae (D), an increase in the staining of the medial and trans cisternae (E), and a decrease in staining of the cis cisternae.
Auxin-Deprived Tobacco BY-2 Cells Resemble Slime-Secreting Root-Cap Cells
The BY-2 cell line was developed from a callus grown on a cultured tobacco seed embryo (Nagata et al., 1992), so the precise tissue of origin of the BY-2 cells is not known. Based on our findings to date, however, it is possible that the BY-2 cells originated from meristematic root cells. As discussed in the preceding sections, auxin deprivation causes BY-2 cells to undergo morphological changes that resemble those seen during the differentiation of polysaccharide slime-secreting root-cap cells.
Root-cap cells are derived from the distal meristem in the root tip. As the meristematic cells divide, cells are displaced outward in files and differentiate first into the gravity-sensing columella cells and then into the slime-secreting cells (Whaley et al., 1959; Staehelin et al., 1990). The polysaccharide slime, or mucigel, produced by the differentiated peripheral cells has been studied most extensively in root tips from maize seedlings. Mucigel consists of hydrophilic polysaccharides and swells in contact with water (Samtsevich, 1965). The average molecular mass of the slime polymers produced by maize cv SX-17 was found to be 2 × 10⁶ kD by exclusion chromatography, ultracentrifugal analysis, and the relative viscosity of ethanol-precipitated material (Paul et al., 1975, as cited by Rougier, 1981).
Mucigel molecules are synthesized by Golgi-associated enzymes of the peripheral root-cap cells (for review, see Rougier, 1981). They contain Glc, Gal, Xyl, Ara, and uronic acid (Jones and Morré, 1973; Moody et al., 1988), and studies with radioactive precursors and fluorescent lectins have also shown a high Fuc content (Paull and Jones, 1975; Wright, 1975; Piché et al., 1985). Some of the glycoproteins in the mucigel fraction possess polysaccharide side chains that are attached to Thr residues via Xyl (Green and Northcote, 1978; Moody et al., 1988).
Juniper and Roberts (1966) suggested that the appearance of hypertrophied dictyosomes may be the result of a sudden increase in carbohydrate supply from the breakdown of starch granules. This seems likely because the mucigel is mainly composed of polysaccharides and has a pectin-like composition (Wright and Northcote, 1974, 1976; Wright, 1975). The mucigel molecule has PGA interspersed with regions of Glc material and has a central β-(1,4)-glucan core. It is possible that this central core makes the molecule fibrillar, whereas an outer matrix makes it hydrophilic.
If auxin deprivation induces a slime-secreting-cell-like differentiation, as is suggested by the similarities in Golgi morphological characteristics, one would expect to see an increase in the secretion of fucosylated products and high-molecular-mass molecules in auxin-deprived cells. As described below, both of these were found.
Auxin Deprivation Affects Protein Secretion
The proliferation of large, densely staining Golgi buds and secretory vesicles in auxin-deprived BY-2 cells appears to reflect a biochemical change in cell metabolism and secretion. Auxin deprivation induces an increase in total secreted protein and, as shown by SDS-PAGE in Figure 9a, induces differences in the protein profile of secreted material from control and auxin-deprived BY-2 cells. Although equal concentrations of protein were loaded on all of the lanes of the polyacrylamide gels (shown in Fig. 9), the intensity of the silver-stained bands (Fig. 9a) appears more consistent with the control lane having more protein. Furthermore, more bands appeared in the control lane than in the auxin-deprived lane. This discrepancy is most likely caused by a lack of reactivity of certain glycoproteins to the silver stain, as shown by the fact that the UEA-1-stained, Fuc-containing, high-molecular-mass bands (Fig. 9c) have no counterparts in the silver-stained gels (Fig. 9a)
A major, slightly smeared band is evident at the very top of the auxin-deprived lane in the silver-stained gel (Fig. 9a). The smeared nature of this band suggests that it might also be a high-molecular-mass glycoprotein. Alternatively, this material could be a highly basic glycoprotein, such as extensin, that does not migrate normally in conventional SDS gels (Memelink et al., 1993). If, as hypothesized, auxin deprivation mimics root-cap development, this material may be related to the mucigel secreted by the root-cap cells.
Anti-Fuc lectin western-blot analysis showed a major increase in a large, Fuc-containing protein (100–200 kD) in auxin-deprived cells (Fig. 9c). What was striking about this blot was that this very broad band was the only band to be recognized by UEA-1. Because Fuc is a large component of root-cap slime, this finding provides more evidence for a relationship between auxin-deprived cells and root-cap-slime-secreting cells. The Fuc band migrated considerably farther into the gel than the band at the top of the gel described in the preceding paragraph, so it is unlikely to be part of the same molecule. These two bands likely represent separate components of the slime.
Auxin Deprivation Induces an Increase in Secretion of Molecules Containing the JIM 13 Epitope
The JIM 13 monoclonal antibody was raised against AGP2 from suspension-cultured carrot root cells by Knox et al. (1991), and predominantly labels the outer surface of the plasma membrane. In carrot roots the antibody labels the epidermis and the future xylem in the upper root and the peripheral slime-secreting cells in the root cap. In tobacco root tips we found low staining in the future xylem but very high staining in the peripheral root-cap and epidermal cells (Fig. 12). Therefore, we decided to use the antibody as a marker of slime-secreting-cell development.
Western blots against secreted protein from control and auxin-deprived BY-2 cells showed both a quantitative and a qualitative change in the JIM 13 AGP epitope (Fig. 9d). When samples were normalized for total protein concentration, an increase in JIM 13 staining was seen in the auxin-deprived lane. Most of the staining in both control and auxin-deprived cells was found in a diffuse band around 116 kD, slightly higher (slower migrating) than for carrot suspension-cultured-cell preparations (Knox et al., 1991). The major JIM 13 band was slightly lower in the auxin-deprived lane than in the control lane, suggesting a qualitative shift in the epitope. Because JIM 13 recognizes a polysaccharide group of an AGP that contains up to 95% carbohydrate (Pennell et al., 1989; Knox et al., 1991), this shift most likely represents an alteration in the polysaccharide content rather than in the protein backbone. This shift in size is therefore most likely a Golgi-mediated posttranslational event rather than a translational event.
Because the JIM 13 band in both lanes migrated significantly faster than the glycoprotein(s) detected by UEA-1 staining, it is unlikely that the anti-Fuc lectin labeled the JIM 13-epitope-containing molecules. The Fuc-containing molecules in the polysaccharide slime are most likely a separate component from the JIM 13 AGP.
It is not known how much of the total secreted AGP is represented by the JIM 13 epitope, but a second, more lightly staining smear in the auxin-containing lane appeared farther down the gel, at around 70 kD. Because the crossed-gel electrophoresis also showed two peaks of AGP for the auxin-containing cells and one major peak (with a shoulder) for the auxin-deprived cells, the JIM 13 epitope may constitute a large percentage of the total AGP.
McCann et al. (1993) found that both control and auxin-deprived carrot suspension-cultured cells had large concentrations of JIM 13 epitope in the cell wall. We were also unable to detect significant differences in JIM 13 immunogold particle accumulation between control and auxin-deprived cells (data not shown). Because this appears counter to the increase in JIM 13 epitope we found in the secreted material from auxin-deprived BY-2 cells, we needed to determine whether the increase in secreted JIM 13 represented an actual increase in the production of the epitope or simply a change in the release of the epitope to the extracellular medium.
Immunoelectron microscopy with the JIM 13 antibody indicates that the epitope is synthesized in the Golgi apparatus (Fig. 13) and that the increase in JIM 13 staining on the western blots of the secreted proteins (Fig. 9d) is attributable to an increased production of molecules with JIM 13 epitopes in the Golgi apparatus. Because the JIM 13-epitope-containing molecules have to pass through the cell wall to reach the extracellular medium, the lack of change of JIM 13 staining in the cell walls of the control and auxin-deprived BY-2 cells suggests that the cell wall-binding capacity for JIM 13-epitope-containing molecules is already saturated in the control cells. Therefore, no significant difference in gold-particle concentration is seen in the walls, because as epitope production increases in the Golgi apparatus, epitope secretion increases into the extracellular medium.
In tobacco root caps the meristematic and young columella cells produce no detectable JIM 13 epitope (Fig. 12). The fact that the control BY-2 cells already synthesize some JIM 13-epitope-containing molecules indicates that the control cells are not equivalent to root tip meristematic cells or young columella cells, but rather are akin to late-stage columella cells. Auxin deprivation therefore appears to induce in tobacco BY-2 cells a series of morphological changes in the Golgi apparatus and concomitant changes in the nature of secretory products that mimic the final developmental changes in the formation of slime-secreting cells from late-stage columella cells.
Future Studies
Auxin deprivation induces suspension-cultured BY-2 cells to differentiate in a manner that resembles the development of root-cap-slime-secreting cells. This has been demonstrated through morphological changes in the Golgi stacks, qualitative and quantitative changes in the secretion of general tissue differentiation markers, and an increase in Golgi staining of the specific root-cap-slime-cell marker JIM 13.
Further studies of auxin-deprived BY-2 cells may also lead to the discovery of new markers for root-cap differentiation. For example, we plan to investigate changes in secreted pectic polysaccharides, since the ratio of methylesterified to unesterified polygalacturonic acid residues has been shown to be related to peripheral root-cap-cell development (Hawes and Lin, 1990; Lynch and Staehelin, 1992; Stephenson and Hawes, 1994).
Finally, auxin deprivation opens up new doors for biochemical studies of Golgi differentiation. As discussed in the introduction, it has been nearly impossible in the past to purify Golgi stacks of a single tissue type. By using auxin-deprived suspension-cultured cells, we can isolate much larger quantities of Golgi membranes and study changes in the integral membrane proteins involved in the morphological and functional differentiation of the plant Golgi apparatus.
ACKNOWLEDGMENTS
We gratefully acknowledge Drs. Paul Knox and Keith Roberts (John Innes Centre, Norwich, UK) for their generous gift of the JIM 13 monoclonal antibody. Thanks go to Dr. Malcolm Bennett at the University of Warwick (UK) and to Janet Meehl at the University of Colorado for their comments and suggestions on the manuscript. Thanks also go to Dr. Tom Giddings for help with the electron microscopy, and to Diane Lorenz for help with the preparation of figures.
Abbreviations:
- AGP
arabinogalactan protein
- ANOVA
analysis of variance
- DAPI
4′,6-diamidino-phenylindole
- TGN
trans-Golgi network
Footnotes
This work was supported by a National Institutes of Health grant (no. 18639 to L.A.S.).
LITERATURE CITED
- Blum EA, Beier H, Gross HJ. Improved silver staining of plant proteins, RNA, and DNA in polyacrylamide gels. Electrophoresis. 1987;8:93–99. [Google Scholar]
- Craig S, Staehelin LA. High pressure freezing of intact plant tissues: evaluation and characterization of novel features of the endoplasmic reticulum and associated membrane systems. Eur J Cell Biol. 1988;46:80–93. [PubMed] [Google Scholar]
- Cunninghame ME, Hall JL. A quantitative stereological analysis of the effect of indoleacetic acid on the dictyosomes in pea stem epidermal cells. Protoplasma. 1985;125:230–234. [Google Scholar]
- Driouich A, Levy S, Staehelin LA, Faye L. Structural and functional organization of the Golgi apparatus in plant cells. Plant Physiol Biochem. 1994;32:731–749. [Google Scholar]
- Driouich A, Zhang GF, Staehelin LA. Effect of brefeldin A on the structure of the Golgi apparatus and on the synthesis and secretion of proteins and polysaccharides in sycamore maple (Acer pseudoplatanus) suspension-cultured cells. Plant Physiol. 1993;101:1363–1373. doi: 10.1104/pp.101.4.1363. [DOI] [PMC free article] [PubMed] [Google Scholar]
- Fernandez DE, Staehelin LA. Structural organization of ultrarapidly frozen barley aleurone cells actively involved in protein secretion. Planta. 1985;165:455–468. doi: 10.1007/BF00398090. [DOI] [PubMed] [Google Scholar]
- Green JR, Northcote DH. The structure and function of glycoproteins synthesized during slime-polysaccharide production by membranes of the root-cap cells of maize (Zea mays) Biochem J. 1978;170:599–608. doi: 10.1042/bj1700599. [DOI] [PMC free article] [PubMed] [Google Scholar]
- Hawes MC, Lin H-J. Correlation of pectolytic enzyme activity with the programmed release of cells from root caps of pea (Pisum sativum) Plant Physiol. 1990;94:1855–1859. doi: 10.1104/pp.94.4.1855. [DOI] [PMC free article] [PubMed] [Google Scholar]
- Hess MW. Cell-wall development in freeze-fixed pollen: intine formation of Ledebouria socialis (Hyacinthaceae) Planta. 1993;189:139–149. [Google Scholar]
- Jones DD, Morré DJ. Golgi apparatus mediated polysaccharide secretion by outer root cap cells of Zea mays. III. Control by exogenous sugars. Physiol Plant. 1973;29:68–75. doi: 10.1007/BF00384849. [DOI] [PubMed] [Google Scholar]
- Juniper BE, Roberts RM. Polysaccharide synthesis and the fine structure of root cells. J R Microsc Soc. 1966;85:63–72. [Google Scholar]
- Kishi-Nishizawa N, Isogai A, Watanabe M, Hinata K, Yamakawa S, Shojima S, Suzuki A. Ultrastructure of papillar cells in Brassica campestris revealed by liquid helium rapid-freezing and substitution-fixation method. Plant Cell Physiol. 1990;31:1207–1219. [Google Scholar]
- Knox JP, Linstead PJ, Peart J, Cooper C, Roberts K. Developmentally regulated epitopes of cell surface arabinogalactan proteins and their relation to root tissue pattern formation. Plant J. 1991;1:317–326. doi: 10.1046/j.1365-313X.1991.t01-9-00999.x. [DOI] [PubMed] [Google Scholar]
- Knox JP, Roberts K. Carbohydrate antigens and lectin receptors of the plasma membrane of carrot cells. Protoplasma. 1989;152:123–129. [Google Scholar]
- Komamine A, Kawahara R, eds (1991) Mechanisms of Somatic Embryogenesis: Morphological, Physiological, and Molecular Biological Aspects. Vol Osaka University, Osaka, Japan
- Lancelle SA, Hepler PK. Ultrastructure of freeze-substituted pollen tubes of Lilium longiflorum. Protoplasma. 1992;167:215–230. [Google Scholar]
- Lloyd C, Lowe S, Peace G. The mode of action of 2,4-D in counteracting the elongation of carrot cells grown in culture. J Cell Sci. 1980;45:257–268. doi: 10.1242/jcs.45.1.257. [DOI] [PubMed] [Google Scholar]
- Lynch MA, Staehelin LA. Domain-specific and cell type-specific localization of two types of cell wall matrix polysaccharides in the clover root tip. J Cell Biol. 1992;118:467–479. doi: 10.1083/jcb.118.2.467. [DOI] [PMC free article] [PubMed] [Google Scholar]
- Lynch MA, Staehelin LA. Immunocytochemical localization of cell wall polysaccharides in the root tip of Avena sativa. Protoplasma. 1995;188:115–127. [Google Scholar]
- Masuda H, Ozeki Y, Amino S, Komamine A. Changes in cell wall polysaccharides during elongation in a 2,4-D free medium in a carrot suspension culture. Physiol Plant. 1984;62:65–72. [Google Scholar]
- Masuda H, Ozeki Y, Amino S, Komamine A. Changes in the activities of various glycosidases during carrot cell elongation in a 2,4-D-free medium. Plant Cell Physiol. 1985;26:995–1001. [Google Scholar]
- McCann MC, Stacey NJ, Wilson R, Roberts K. Orientation of macromolecules in the walls of elongating carrot cells. J Cell Sci. 1993;106:1347–1356. doi: 10.1242/jcs.106.4.1347. [DOI] [PubMed] [Google Scholar]
- Meindl U, Lancelle S, Hepler PK. Vesicle production and fusion during lobe formation in Micrasterias visualized by high-pressure freeze fixation. Protoplasma. 1992;170:104–114. [Google Scholar]
- Memelink J, Swords KMM, Kam RJd, Schilperoort RA, Hoge JHC, Staehelin LA. Structure and regulation of tobacco extensin. Plant J. 1993;4:1011–1022. doi: 10.1046/j.1365-313x.1993.04061011.x. [DOI] [PubMed] [Google Scholar]
- Mitsui T, Kimura S, Igaue I. Isolation and characterization of Golgi membranes from suspension-cultured cells of rice (Oryza sativa L.) Plant Cell Physiol. 1990;31:15–25. [Google Scholar]
- Mollenhauer HH. An intercisternal structure in the Golgi apparatus. J Cell Biol. 1965;24:504–511. doi: 10.1083/jcb.24.3.504. [DOI] [PMC free article] [PubMed] [Google Scholar]
- Mollenhauer HH, Morré DJ. A possible role for intercisternal elements in the formation of secretory vesicles in plant Golgi apparatus. J Cell Sci. 1975;19:231–237. doi: 10.1242/jcs.19.2.231. [DOI] [PubMed] [Google Scholar]
- Mollenhauer HH, Whaley WG, Leech JH. A function of the Golgi apparatus in outer rootcap cells. J Ultrastruct Res. 1961;5:193–200. doi: 10.1016/s0022-5320(61)90014-4. [DOI] [PubMed] [Google Scholar]
- Moody SF, Clarke AE, Bacic A. Structural analysis of secreted slime from wheat and cowpea roots. Phytochemistry. 1988;27:2857–2861. [Google Scholar]
- Nagata T, Nemoto Y, Hasezawa S. Tobacco BY-2 cell line as the “Hela” cell in the cell biology of higher plants. Int Rev Cytol. 1992;132:1–30. [Google Scholar]
- Nishi A, Kato K, Takahashi M, Yoshida R. Partial synchronization of carrot cell culture by auxin deprivation. Physiol Plant. 1977;39:9–12. [Google Scholar]
- Ozeki Y, Komamine A. Induction of anthocyanin synthesis in relation to embryogenesis in a carrot suspension culture: correlation of metabolic differentiation with morphological differentiation. Physiol Plant. 1981;53:570–577. [Google Scholar]
- Paul RE, Jones RL. Studies on the secretion of maize root cap slime. II. Localization of slime polymer. Plant Physiol. 1975;56:300–306. doi: 10.1104/pp.56.2.300. [DOI] [PMC free article] [PubMed] [Google Scholar]
- Pennell R, Knox J, Scofield G, Selvendran R, Roberts K. A family of abundant plasma membrane associated glycoproteins related to the arabinogalactan proteins is unique to flowering plants. J Cell Biol. 1989;108:1967–1977. doi: 10.1083/jcb.108.5.1967. [DOI] [PMC free article] [PubMed] [Google Scholar]
- Pennell RI, Roberts K. Sexual development in the pea is presaged by altered expression of arabinogalactan protein. Nature. 1990;344:547–549. [Google Scholar]
- Piché Y, Ackerley CA, Peterson RL. Localization of L-fucose in the root cap and slime of Zea mays L. utilizing fluorescent lectin conjugates and colloidal gold-lectin techniques. Plant Sci. 1985;40:179–184. [Google Scholar]
- Quaite E, Parker RE, Steer MW. Plant cell extension: structural implications for the origin of the plasma membrane. Plant Cell Environ. 1983;6:429–432. [Google Scholar]
- Roberts K. The plant extracellular matrix: in a new expansive mood. Curr Opin Cell Biol. 1994;6:688–694. doi: 10.1016/0955-0674(94)90095-7. [DOI] [PubMed] [Google Scholar]
- Roth J. Localization of glycosylation sites in the Golgi apparatus using immunolabeling and cytochemistry. J Electron Microsc Tech. 1991;17:121–131. doi: 10.1002/jemt.1060170202. [DOI] [PubMed] [Google Scholar]
- Rougier M. Secretory activity of the root cap. In: Tanner W, Loewers F, editors. Encyclopedia of Plant Physiology, New Series, Vol 13b. Heidelberg, Germany: Springer-Verlag; 1981. pp. 542–574. [Google Scholar]
- Samtsevich SA. Active excretions of plant roots and their significance. Fiziol Rast. 1965;12:837–846. [Google Scholar]
- Samuels AL, Giddings TH, Staehelin LA. Cytokinesis in tobacco BY-2 and root tip cells: a new model of cell plate formation in higher plants. J Cell Biol. 1995;130:1–13. doi: 10.1083/jcb.130.6.1345. [DOI] [PMC free article] [PubMed] [Google Scholar]
- Satiat-Jeunemaitre B, Hawes C. Redistribution of a Golgi glycoprotein in plant cells treated with brefeldin A. J Cell Sci. 1992;103:1153–1166. [Google Scholar]
- Satiat-Jeunemaitre B, Steele C, Hawes C. Golgi-membrane dynamics are cytoskeleton dependent: a study on Golgi stack movement induced by brefeldin A. Protoplasma. 1996;191:21–33. [Google Scholar]
- Schindler T, Bergfeld R, Schopfer P. Arabinogalactan proteins in maize coleoptiles: developmental relationship to cell death during xylem differentiation but not to extension growth. Plant J. 1995;7:25–36. doi: 10.1046/j.1365-313x.1995.07010025.x. [DOI] [PubMed] [Google Scholar]
- Staehelin LA, Giddings TH, Kiss JZ, Sack FD. Macromolecular differentiation of Golgi stacks in root tips of Arabidopsis and Nicotiana seedlings as visualized in high pressure frozen and freeze-substituted samples. Protoplasma. 1990;157:75–91. doi: 10.1007/BF01322640. [DOI] [PubMed] [Google Scholar]
- Staehelin LA, Giddings TH, Levy S, Lynch MA, Moore PJ, Swords KMM. Organization of the secretory pathway of cell wall glycoproteins and complex polysaccharides in plant cells. In: Hawes C, Coleman J, Evans D, editors. Endocytosis, Exocytosis and Vesicle Traffic in Plants. Cambridge, UK: Cambridge University Press; 1991. pp. 183–198. [Google Scholar]
- Staehelin LA, Moore I. The plant Golgi apparatus: structure, functional organization and trafficking mechanisms. Annu Rev Plant Physiol Plant Mol Biol. 1995;46:261–288. [Google Scholar]
- Steer MW. Differentiation of the tapetum in Avena: the endoplasmic reticulum and Golgi apparatus. J Cell Sci. 1977;28:71–86. doi: 10.1242/jcs.28.1.71. [DOI] [PubMed] [Google Scholar]
- Stephenson MB, Hawes MC. Correlation of pectin methylesterase activity in root caps of pea with root border cell separation. Plant Physiol. 1994;106:739–745. doi: 10.1104/pp.106.2.739. [DOI] [PMC free article] [PubMed] [Google Scholar]
- Taiz L, Zeiger E (1991) Plant Physiology. The Benjamin/Cummings Publishing Company, Redwood City, CA
- Turner FR, Whaley WG. Intercisternal elements of the Golgi apparatus. Science. 1965;147:1303–1304. doi: 10.1126/science.147.3663.1303. [DOI] [PubMed] [Google Scholar]
- van Holst G-J, Clarke AE. Organ-specific arabinogalactan-proteins of Lycopersicon peruvianum (Mill) demonstrated by crossed electrophoresis. Plant Physiol. 1986;80:786–789. doi: 10.1104/pp.80.3.786. [DOI] [PMC free article] [PubMed] [Google Scholar]
- Whaley W, Kephart J, Mollenhauer H. Developmental changes in the Golgi-apparatus of maize root cells. Am J Bot. 1959;46:743–751. [Google Scholar]
- Wright K. Polysaccharides of root-cap slime from five maize varieties. Phytochemistry. 1975;14:1793–1798. [Google Scholar]
- Wright K, Northcote DH. The relationship of root-cap slimes to pectins. Biochem J. 1974;139:525–534. doi: 10.1042/bj1390525. [DOI] [PMC free article] [PubMed] [Google Scholar]
- Wright K, Northcote DH. Identification of β 1→4 glucan chains as part of a fraction of slime synthesized within the dictyosomes of maize root caps. Protoplasma. 1976;88:225–239. [Google Scholar]
- Yariv J, Rapport MM, Graf L. The interaction of glycosides and saccharides with antibody to the corresponding phenylazo- glycosides. Biochem J. 1962;85:383–388. doi: 10.1042/bj0850383. [DOI] [PMC free article] [PubMed] [Google Scholar]
- Zhang GF, Staehelin LA. Functional compartmentalization of the Golgi apparatus of plant cells. An immunocytochemical analysis of high pressure frozen and freeze-substituted sycamore maple suspension culture cells. Plant Physiol. 1992;99:1070–1083. doi: 10.1104/pp.99.3.1070. [DOI] [PMC free article] [PubMed] [Google Scholar]


