Abstract
The use of ultrashort femtosecond pulsed lasers to effect membrane permeabilisation and initiate both optoinjection and transfection of cells has recently seen immense interest. We investigate femtosecond laser-induced membrane permeabilisation in mammalian cells as a function of pulse duration, pulse energy and number of pulses, by quantifying the efficiency of optoinjection for these parameters. Depending on pulse duration and pulse energy we identify two distinct membrane permeabilisation regimes. In the first regime a nonlinear dependence of order 3.4-9.6 is exhibited below a threshold peak power of at least 6 kW. Above this threshold peak power, the nonlinear dependence is saturated resulting in linear behaviour. This indicates that the membrane permeabilisation mechanism requires efficient multiphoton absorption to produce free electrons but once this process saturates, linear absorption dominates. Our experimental findings support a previously proposed theoretical model and provide a step towards the optimisation of laser-mediated gene delivery into mammalian cells.
Ultrashort pulse lasers operating in the femtosecond (fs) time domain have found a multitude of applications in the field of biophotonics1. The nonlinear nature of light-matter interaction makes the correct choice of laser parameter critical for achieving the best possible results when performing experiments or laser-medical procedures. Therefore it is necessary to fully understand the interaction between light and biological matter for all parameters in order to make the correct parameter choice. Principally, the laser wavelength, pulse energy, spatial beam profile, laser repetition rate, irradiation time and pulse duration determine the exact form of the interaction with biological matter. The response of the biological matter is very sensitive to these parameters.
A transient change in mammalian cell membrane permeability can be achieved by focusing ultrashort laser pulses onto the cell membrane. This transient change depends upon the optical absorption properties of the cells and laser parameter choice. Techniques such as single cell optoinjection2 and phototransfection3 in which membrane-impermeable material (non-genetic and genetic) is introduced into cells through the transient permeabilisation of the cell membrane have offered new insights into fundamental biological questions4. There have been several studies concerning the laser parameter space for cell membrane permeabilisation experiments. In particular, the optoinjection efficiency for varying pulse energy and number of pulses has been investigated2,5. The phototransfection efficiency has been characterised for varying laser fluence3 and novel beam shapes6. In terms of pulse duration, one study demonstrated optoinjection and phototransfection of cells using sub-20 fs pulses7.
The ability to engineer irreversible changes in cell morphology have found a number applications in single-cell nano-surgery and tissue modifcation8,9. In this regime extensive studies have been completed for a wide parameter space including pulse energy5 and repetition rate10,11. In one study the nano-surgery threshold for three pulse durations was investigated12. However, up to date there have there have been no detailed investigations into the pulse duration dependence of transient membrane permeabilisation for optoinjection.
Here, we present results from optoinjection experiments performed at a range of pulse durations from 17 fs to 143 fs. For completeness we also performed optoinjection experiments with various pulse energies at constant pulse durations and also examined the role the number of pulses have upon optoinjection efficiency. Optoinjection experiments offer a consistent and reproducible direct measure of the membrane permeabilisation probability. Our study provides detailed information about the linear and nonlinear absorption behaviour required to initiate membrane permeabilisation. Importantly, we have covered a wide parameter range, and in particular the ability to accurately measure the pulse duration in situ has enabled this study to be performed.
Results
We performed optoinjection experiments in Chinese Hamster Ovary (CHO) cells using Propidium Iodide (PI) as the impermeable dye for indicating successful laser-induced cell membrane permeabilisation. Fig. 1 shows an example sequence of images obtained in the optoinjection experiments. In the first instance, a phase contrast image is taken of the sample cell population before laser irradiation. In the second instance, cells within the same population that were irradiated and successfully optoinjected with PI are indicated by red (false colour) fluorescence, as obtained 5 minutes post-irradiation. Finally, the cells which remained viable with intact membranes after laser irradiation fluoresce green 90 minutes post-irradiation according to the uptake of the dye Calcein AM. The optoinjection efficiency (ratio of successfully optoinjected cells to total number of cells irradiated in the sample) was calculated for each parameter of interest for 8 samples (n = 8), each containing 30 cells. For full experimental details please refer to the methods section below. The relationship between the parameters is discussed in Table 1. The laser parameter space considered and results are summarised in Table 2. The results from each parameter space explored are discussed in the subsections below.
Figure 1. Example image of cells optically injected with PI and tested for viability with CAM.
Left: Before shooting (phase contrast), Centre: PI uptake at 5 minutes post-irradiation (false colour), Right: CAM viability test at 90 minutes post-irradiation (false colour).
Table 1. The three varied parameters: pulse duration, pulse energy and number of pulses influence peak power and total energy in the manner shown on the table. The expressions associated with peak power (Ppeak) and total energy (Etotal) are also shown with k being a constant depending on the temporal profile of the pulse. The table also shows whether the parameter is generally associated with influencing either the nonlinear or linear absorption mechanisms and the associated expression.
Pulse duration ( ) ) |
Pulse energy (Ep) | Number of pulses (Np) | Expression | |
|---|---|---|---|---|
| Peak power (Ppeak) | ∝  –1 –1
|
∝ Ep | no effect |  |
| Total energy (Etotal) | no effect | ∝ Ep | ∝ Np | Etotal = EpNp |
| Associated absorption mechanisms | Nonlinear only | Nonlinear and linear | Linear only |  |
| Fig. reference: | 2 | 3 | 4 |
Table 2. Summary of experimental parameter space explored. Sets 1–3 refer to experiments involving varying the pulse duration, sets 4-6 refer to experiments involving varying the pulse energy and sets 7–9 refer to experiments involving varying the number of pulses. Also note the threshold peak powers are calculated at the inflection points on the data fits; the inflection points are unavailable for sets 3 and 6 and are listed as N/A in the table. Finally, the mean pulse numbers were calculated by considering a Gaussian error function fitted to the data in Fig. 4 and performing a linear regression fit to find the mean pulse number. The ERF was numerically differentiated to find the probability density function (PDF) and corresponding standard deviation. Where not applicable these are also listed as N/A.
| Experimental set: (Fig. reference) | Pulse duration range (fs) | Pulse energy range (nJ) | Number of pulses (×106) | Photon order (nef) | Threshold peak power (kW) | Mean pulse number (×106) |
|---|---|---|---|---|---|---|
| 1: (2) | 17–68 | 0.5 | 3.0 | 1.5 ± 0.2 | 8 ± 2 | N/A |
| 1: (2) | 68–143 | 0.5 | 3.0 | 3.5 ± 2.0 | as above | N/A |
| 2: (2) | 17–80 | 1.1 | 1.5 | 1.5 ± 0.2 | 11 ± 2 | N/A |
| 2: (2) | 80–143 | 1.1 | 1.5 | 6.6 ± 2.5 | as above | N/A |
| 3: (2) | 17–80 | 1.8 | 0.4 | 3.6 ± 0.5 | N/A | N/A |
| 4: (3) | 17 | 0.33–0.6 | 3.0 | 0.9 ± 0.2 | 18 ± 2 | N/A |
| 4: (3) | 17 | 0.26–0.33 | 3.0 | 7.6 ± 2.0 | as above | N/A |
| 5: (3) | 68 | 0.53–0.8 | 3.0 | 1.3 ± 0.5 | 7 ± 1 | N/A |
| 5: (3) | 68 | 0.40–0.53 | 3.0 | 5.7 ± 2.3 | as above | N/A |
| 6: (3) | 17 | 0.53–0.8 | 0.4 | 3.3 ± 1.0 | N/A | N/A |
| 7: (4) | 17 | 0.5 | 0.4–3.0 | N/A | N/A | 1.1 ± 0.5 |
| 8: (4) | 44 | 0.5 | 0.8–6.0 | N/A | N/A | 3.4 ± 1.5 |
| 9: (4) | 80 | 0.5 | 1.5–7.5 | N/A | N/A | 10 ± 6 |
The role of pulse duration
The ability to controllably and accurately vary the pulse duration through both (i) Multiphoton intrapulse interference phase scan (MIIPS) characterisation13 (ii) second-order dispersive stretching allows us to confidently state the FWHM of the pulse duration and is discussed in detail in the methods section below. As we are interested in the nonlinear absorption characteristics we note that the pulse duration defines the peak power by an inverse reciprocal relationship14. Varying the pulse duration is equivalent to varying the peak power, which in turn affects the nonlinear absorption characteristics. Importantly, the peak power is varied without any change in pulse energy, which allows us to exclusively examine the nonlinear characteristics independently of linear absorption characteristics.
It is well established that the time-averaged intensity (Sn) obtained in nonlinear processes (e.g. multiphoton) for a given number of photons (n) follows  for a given pulse energy (Ep) and pulse duration (
 )15. Since the optoinjection process depends upon the membrane permeabilisation resulting from free electron plasma generation on the cellular membrane, its efficiency is a function of linear and nonlinear absorption mechanisms and can be expressed in terms of the number of photons (n) that are responsible for the observed effect. However, due to the intricate interplay and interdependence of multiple light-matter interaction mechanisms exhibiting different nonlinearities8 the optoinjection efficiency cannot be represented as a simple sum of separate contributions from each of them. Therefore in the subsequent analysis we introduce an effective photon number, nef and express the optoinjection efficiency as
  . We use this effective photon number nef to indicate the dominating order of the photon absorption process. However, in the presence of multiple competing processes nef does not have a clear interpretation and thus may not necessarily have an integer value, as indeed we find to be the case. The effective photon number nef is obtained for constant
  or Ep by relating the logarithm of
  to the gradient in the linear regions of the optoinjection efficiency plotted on a log-log scale.
Fig. 2 clearly illustrates the importance of pulse duration on optoinjection efficiency. For all three data sets the optoinjection efficiency was seen to rapidly decrease with increasing pulse duration with a marked transition in behaviour occurring at around 80 fs. Relating the gradients of optoinjection efficiency in the short pulse and longer pulse regions separately to the effective photon number, nef we obtained the effective photon numbers summarised in Table 2. The effective photon order was between 1.3 and 1.7 below 68 fs for set 1 and below 80 fs for set 2. Above these threshold pulse durations the effective photon number was between 3.5 and 9.1. It must be noted that this is the maximum range of effective photon number with the larger recorded error resulting from the requirement of log-log data. The point of inflection between high and low gradient defines the threshold value between the two distinct regimes. Where possible we calculated the threshold peak power of each transitionary point. Taking into account experimental error we found the threshold peak powers to lie within the range 6–13 kW. We note that for set 3 the behaviour is distinctly different, with a higher effective photon number. Most probably this results from the significantly greater pulse energy and fewer number of pulses being used in this particular experimental set.
Figure 2. Membrane permeabilisation efficiency as function of pulse duration ( ), with each data point represented by mean ± standard error of mean (s.e.m).
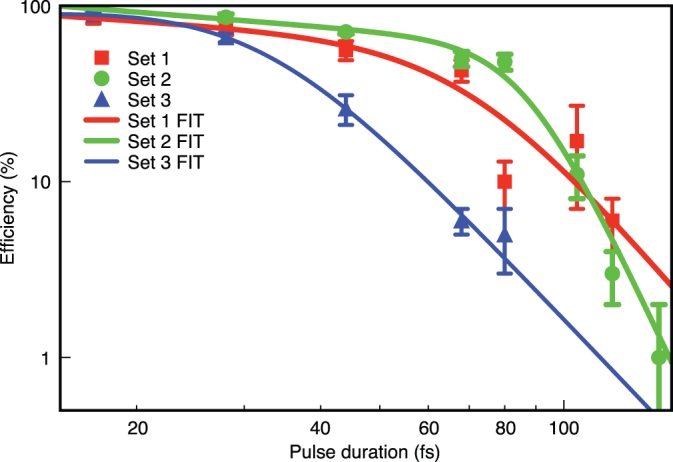
The fits shown represent continuous functions whose gradients are equivalent to linear fits in the limit of either the shorter or longer pulse duration regions. The point of inflection in each fit defines the transition value from low to high photon order.
The role of pulse energy
An alternative way of controllably varying the peak power involves changing the pulse energy with the results shown in Fig. 3. In contrast with varying the pulse duration, this method of controlling the peak power simultaneously changes the total energy the cell is subjected to during exposure to the femtosecond laser beam. For each data set a rapid increase in optoinjection efficiency was observed for increasing pulse energy. A marked transition was also observed between lower pulse energies and higher pulse energies whereby the rapid increase in efficiency switches to a more gentle increase in efficiency. In the same way as previously the effective photon numbers were obtained for pulse energy ranges over which a linear fit could be performed and these are summarised in Table 2. We found that below the threshold point the effective photon order was between the (maximum) range 3.4 and 9.6 for sets 4 and 5. Again, it must be noted that this is the maximum range of effective photon number with the larger error resulting from the requirement of log-log data. Above the threshold, the effective photon order was very close to unity for both experimental sets, which implies a nearly linear relationship. The threshold peak powers were found to be within the range of 6–20 kW for sets 4 and 5. Set 6 behaved in a similar way to set 3, with the common factor between the two sets being the number of pulses used. Evidently this similarity must be due to the greater peak power associated with these data sets, even though the method of peak power increase differs between sets 3 and 6.
Figure 3. Membrane permeabilisation efficiency as function of pulse energy (Ep), with each data point represented by mean ± s.e.m.
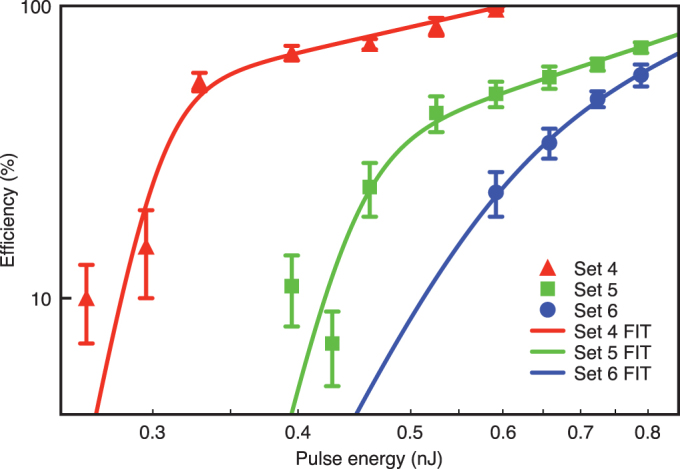
The fits shown represent continuous functions whose gradients are equivalent to linear fits in the limit of either the lower or higher pulse energy regions. The point of inflection in each fit defines the transition value from high and low photon order.
The role of number of pulses
Finally, Fig. 4 shows the total energy per laser exposure that was varied independently of peak power by varying the number of pulses. These experiments therefore probe the time-dependent optical absorption properties of the cell membrane. A very distinctive pattern was observed between the different pulse durations, with the steepest efficiency increase for the shortest pulses. This steep gradient implies that a rapid increase in optoinjection efficiency occurs over a narrow pulse number range. In contrast, the optoinjection efficiency did not substantially increase when the longest pulse duration was used despite significantly more pulses. The results in Fig. 4 are accompanied by fits which describe the increase in efficiency with time. Optoinjected cells only exhibit fluorescence if sufficient quantities of dye have penetrated the cell, hence resulting in a positive reading for constant levels of fluorescence excitation. Due to the probabilistic nature of each optoinjection event, the number of pulses required to permeabilise the cell will fluctuate. Therefore it is possible to describe the results in terms of a cumulative distribution function (CDF), in this case we chose an error function (ERF), which when numerically differentiated results in a probability distribution function (PDF) that corresponds to the normal distribution with an associated mean and standard deviation. Table 2 shows the mean number of pulses required to achieve a 50 % optoinjection efficiency and the corresponding standard deviation time. Clearly, the required number of pulses and standard deviation decrease significantly with the pulse duration providing robust and reliable membrane permeabilisation at short irradiation times.
Figure 4. Membrane permeabilisation efficiency as function of number of pulses, with each data point represented by mean ± s.e.m.
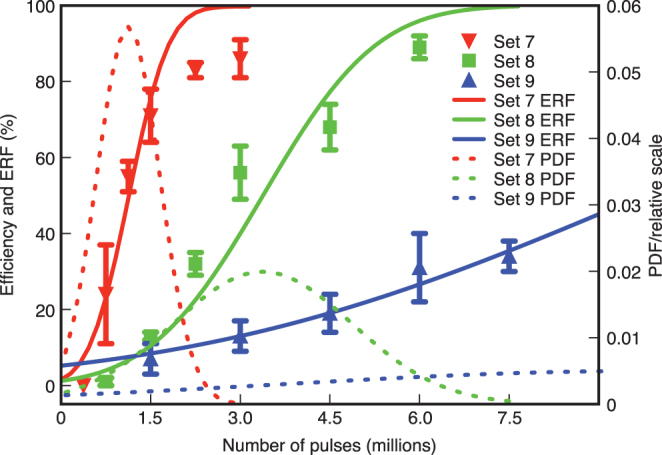
The error function, ERF (solid line) represents the cumulative density function fitted to the data. The mean and standard deviation obtained from the ERF define the probability density function, corresponding to a normal distribution (PDF, dashed line).
Discussion
Understanding the nature of the coupling between the laser parameters is crucial for describing the absorption characteristics of the cell membrane necessary for optoinjection and phototransfection. Our experimental findings show that all three laser parameters have to be appropriately adjusted in order to sufficiently permeabilise the cell membrane for efficient optoinjection. We identify some key features of our findings which help to explain the processes leading to membrane permeabilisation and hence optoinjection.
Upon irradiation, the behaviour is initially dominated by multiple-effective photon absorption of order 3.4–9.6. This behaviour is repeated in Figs. 2 and 3 for the longer pulse durations and lower pulse energies, respectively. The similarity between decreasing the pulse duration and increasing the pulse energy is strikingly similar, in that both methods appear to initiate optoinjection through increasing the peak power, with the total energy playing a minor role up until reaching a threshold point.
There is a threshold peak power in the region of at least 6kW above which the multiphotontype behaviour of permeabilisation efficiency turns into a linear dependency.
Upon reaching the peak power threshold the multiphoton absorption saturates leaving the linear absorption as the dominant mechanism. Figs. 2 and 3 consistently show this relationship in the linear regimes of shorter pulse durations and higher pulse energies, respectively.
A sufficient number of pulses are required to support efficient optoinjection for fixed pulse duration and energy. Fig. 4 illustrates that for constant pulse energy, the shortest possible pulse duration (and equivalently highest pulse energy) is necessary to initiate efficient optoinjection. At longer pulse durations, efficient optoinjection is not obtainable unless using much greater numbers of pulses. This further supports the feature identified in point 1 that the optoinjection process is initiated by the high peak power provided by shorter pulse durations, or higher pulse energies.
These findings complement the research in current literature, in particular the model of Vogel and colleagues of femtosecond optical absorption in biological material8. In particular we note how the initial multiphoton absorption events lead to the avalanche creation of a quasi-free electron plasma within the focal region, supported by tunneling ionisation, inverse Bremsstrahlung and impact ionisation events. A threshold peak power at the focus defines a critical plasma density, upon reaching which, the linear absorption dominates leading to deposition of energy within the focal region, bringing about thermo-elastic stress along with multiphoton-induced chemical breakdown near to the membrane, hence leading to cellular membrane permeabilisation. Within the parameter range used for optoinjection and phototransfection, the correct parameter choice allows the cell to repair itself, thus maintaining viability.
Our findings demonstrate that careful selection of laser parameters will achieve efficient membrane permeabilisation and this has significant importance in laser-mediated drug and gene delivery. In particular, using very short pulses (sub 20 fs) enables efficient membrane permeabilisation whilst using low total dose and a very short irradiation times, which may prove useful in high-throughput microfluidic embodiments of cell optoinjection and transfection16, where irradiation times that are as short as possible are advantageous.
Methods
Experimental arrangement and adaptive dispersion compensation
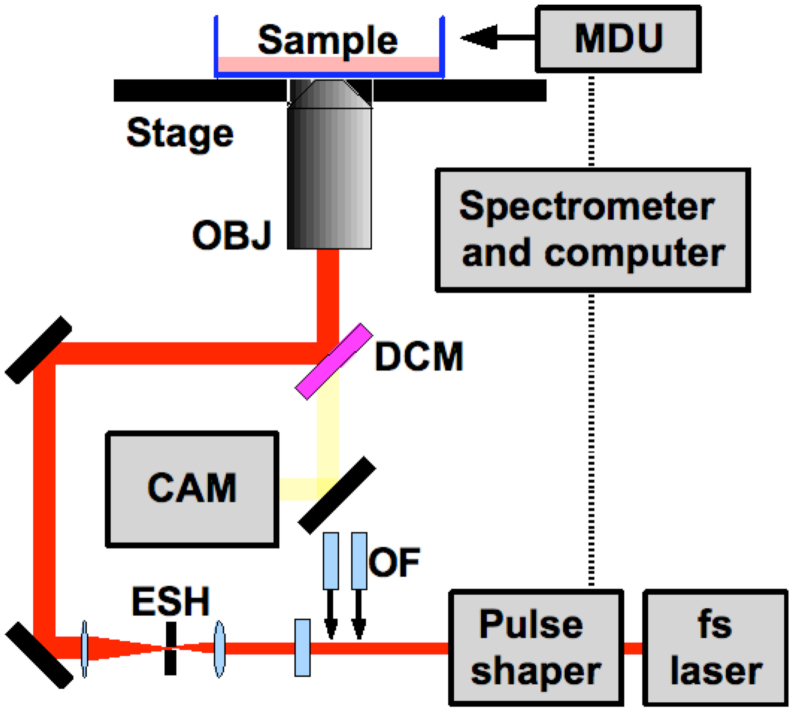
The experimental arrangement is depicted in Fig. 5. We used a KM Labs Swift 10 Titanium Sapphire oscillator (bandwidth = 60 nm, center wavelength = 800 nm, pulse duration of 17 fs) for all the studies described. A Nikon Eclipse Ti inverted microscope with fluorescent imaging capabilities was used for optoinjection experiments. A Nikon 0.8NA/60x air objective was used when acquiring and measuring the shortest possible pulse duration and for completing the optoinjection experiments. A Nikon 0.75NA/40x phase contrast objective and an Andor Clara CCD camera cooled to -55°C were used for imaging. An electronic shutter was used to controllably change the number of pulses. The typical number of pulses used in previous studies on membrane permeabilisation and phototransfection6 was 3.2 × 10⁶. In the high repetition rate regime this number of pulses has been reported as being a good balance between membrane permeabilisation efficiency and viability for similar pulse energies2.
Figure 5. Experimental setup with CAM representing the electronically cooled camera, DCM: dichroic mirror, ESH: electronically controlled shutter, MDU: MIIPS microscope detection unit, OBJ: objective lens and OF: optical flats.
The illumination scheme, mercury lamp and filter cubes are not shown for clarity.
To retain the shortest possible pulses after propagation through the entire optical setup from laser output coupler to the focus of the microscope objective, the chromatic dispersion was characterised and corrected using the multiphoton intrapulse interference phase scan (MIIPS) method13. The MIIPS method measures dispersion in situ by taking a SHG spectral signal of the pulse at the focal plane of the microscope objective and simultaneously modulating the spectral phase in the Fourier plane of an adaptive 4f pulse shaper incorporating a liquid crystal spatial light modulator. The spectral phase was fully characterised using the MIIPS method and the opposite spectral phase applied to the spatial light modulator to deliver transform-limited pulses at the focus of the microscope objective17. We controllably stretched the pulses using anti-reflection coated optical flats made of BK7 glass. The optical flats mainly contribute second-order dispersion, thus controllably stretching the pulse without introducing higher order effects. This was confirmed by measuring the dispersion introduced by the flats using the MIIPS system. The anti-reflection coating on the flats was found to maintain the same optical transmission even when multiple flats were inserted into the setup. Using a combination of 3mm and 5mm thickness flats we were able to controllably obtain FWHM pulse duration values at the sample plane from 17 fs to 28, 44, 68, 80, 105, 120 and 143 fs. We assumed that when varying the pulse duration the temporal features remained constant, as any change in the temporal features would imply a different relationship between peak power and pulse duration18.
The experimental arrangement is shown in Fig. 5. Fig. 6 shows the fundamental laser spectrum and typical phase distortion obtained and corrected by the MIIPS procedure. Crucially, the shape of the dispersion profile indicates significant higher order phase contributions that would not be easily measured and compensated for without the MIIPS procedure.
Figure 6. Fundamental laser spectrum with the retrieved spectral phase dispersion profile found by the MIIPS procedure.
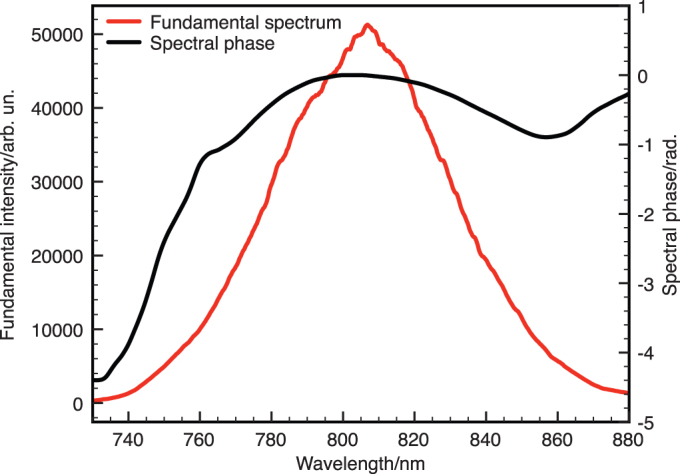
The MIIPS-based pulse shaper allows arbitrary spectral phase functions to be applied to compensate for all dispersion orders introduced by the optics.
Live cell method: membrane permeabilisation
For the optoinjection experiments, Chinese Hamster ovary (CHO) cells were cultured in medium consisting of Minimum Essential Medium (Sigma), 10% Fetal Calf Serum (Sera Laboratories International) and L-Glutamine, Penicillin and Streptomycin (Sigma). The cells were plated on 23 mm glass-bottom sample dishes (Fluorodish, World Precision Instruments) and incubated for at least 24 hours until adherent on the bottom surface.
To assess the efficiency of laser-mediated membrane permeabilisation, we utilised the optoinjection method19 with the membrane-impermeable dye, Propidium Iodide (PI, Sigma-Aldrich). The medium was removed from the sample dish containing the adherent cells. The dish was washed twice with Opti-MEM (Invitrogen) and removed. A 3 µM solution consisting of PI and Opti-MEM was added to the sample dish. The required pulse duration, pulse energy and number of pulses were then selected and the 0.8NA/60x objective used to shoot the cell of interest at 3 axial locations, each separated by 1–2 microns. It was shown previously that targeting at three sufficiently separate axial locations does not compromise viability providing the axial separation is large enough19. The pulse energy at the sample was calculated using the dual-objective transmission method20. Thirty cells were targeted and irradiated by the laser in each dish. After 5 minutes a fluorescence image was taken to check for any cells in the regions of interest that had taken in any PI as a result of laser irradiation. This was compared with a control fluorescence image to check for false positives. The efficiency of optoinjection was calculated as the ratio between successfully optoinjected (fluorescent) cells and the number of targeted cells. The PI solution was then removed and the cells were washed twice with culture medium and fresh medium was added and the cells incubated for at least 90 minutes. A live assay with Calcein AM (CAM, Invitrogen) was used to establish the viability of cells after 90 minutes19. Viability was consistently 100% for the low-medium optoinjection efficiency (< 60%) samples. Therefore viability was only checked where it became clear that it might be compromised, for example where optoinjection efficiency was high, or if a visible microbubble was observed during optoinjection.
To establish the dependence of membrane permeabilisation on femtosecond pulse duration we performed optoinjection experiments by independently varying pulse duration ( ), pulse energy (Ep) and number of pulses (Np). To obtain appropriate statistics, each experiment involving a different set of parameters was repeated 8 times per data value, with each data value presented referring to 8x30 cells.
Author Contributions
AR performed the experimental work; AR and MA designed the experimental procedures with assistance from XT and NM; AR, MA and MM analysed the data and prepared the figures; AR, MA, MM, FGM and KD wrote the manuscript; FGM and KD planned and led the project.
Acknowledgments
We thank the UK Engineering and Physical Sciences Research Council for Funding. MA thanks the Scottish Universities Life Sciences Association for support. KD is a Royal Society-Wolfson Merit Award Holder.
References
- Zipfel W., Williams R. & Webb W. Nonlinear magic: multiphoton microscopy in the biosciences. Nat. Biotechnol. 21, 1369–1377 (2003). [DOI] [PubMed] [Google Scholar]
- Baumgart J. et al. Quantified femtosecond laser based opto-perforation of living GFSHR-17 and MTH53a cells. Opt. Express 16, 3021–3031 (2008). [DOI] [PubMed] [Google Scholar]
- Stevenson D. et al. Femtosecond optical transfection of cells: viability and efficiency. Opt. Express 14, 7125–7133 (2006). [DOI] [PubMed] [Google Scholar]
- Sul J.-Y. et al. Transcriptome transfer produces a predictable cellular phenotype. Proc. Natl. Acad. Sci. USA 106, 7624–7629 (2009). [DOI] [PMC free article] [PubMed] [Google Scholar]
- Heisterkamp A. et al. Pulse energy dependence of subcellular dissection by femtosecond by femtosecond laser pulses. Opt. Express 13, 3690–3696 (2005). [DOI] [PubMed] [Google Scholar]
- Tsampoula X. et al. Femtosecond cellular transfection using a nondiffracting light beam. Appl. Phys. Lett. 91, 053902 (2007). [Google Scholar]
- Uchugonova A., König K., Bueckle R., Isemann A. & Tempea G. Targeted transfection of stem cells with sub-20 femtosecond laser pulses. Opt. Express 16, 9357–9364 (2008). [DOI] [PubMed] [Google Scholar]
- Vogel A., Noack J., Hüttman G. & Paltauf G. Mechanisms of femtosecond laser nanosurgery of cells and tissues. Appl. Phys. B 81, 1015–1047 (2005). [Google Scholar]
- Quinto-Su P. & Venugopalan V. Mechanisms of laser cellular microsurgery. Methods Cell Biol. 82, 113–151 (2007). [DOI] [PubMed] [Google Scholar]
- Kuetemeyer K., Baumgart J., Lubatschowski H. & Heisterkamp A. Repetition rate dependency of low-density plasma effects during femtosecond-laser-based surgery of biological tissue. Appl. Phys. B 97, 695–699 (2009). [Google Scholar]
- Baumgart J. et al. Repetition rate dependency of reactive oxygen species formation during femtosecond laser-based cell surgery. J. Biomed. Opt. 14, 054040 (2009). [DOI] [PubMed] [Google Scholar]
- Uchugonova A. et al. Nanosurgery of cells and chromosomes using near-infrared twelve-femtosecond laser pulses. J. Biomed. Opt. 17, 101502 (2012). [DOI] [PubMed] [Google Scholar]
- Lozovoy V., Pastirk I. & Dantus M. Multiphoton intrapulse interference. IV. Ultrashort laser pulse spectral phase characterization and compensation. Opt. Lett. 29, 775–777 (2004). [DOI] [PubMed] [Google Scholar]
- Diels J. & Rudolph W. Ultrashort laser pulse phenomena. Academic Press, 1st edition, (1996). [Google Scholar]
- Pestov D., Andegeko Y., Lozovoy V. & Dantus M. Photobleaching and photoenhancement of endogenous fluorescence observed in two-photon microscopy with broadband laser sources. J. Opt. 12, 084006 (2010). [Google Scholar]
- Marchington R., Arita Y., Tsampoula X., Gunn-Moore F. & Dholakia K. Optical injection of mammalian cells using a microfluidic platform. Biomed. Opt. Express 1, 527–536 (2010). [DOI] [PMC free article] [PubMed] [Google Scholar]
- Xu B., Gunn J., Cruz J. D., Lozovoy V. & Dantus M. Quantitative investigation of the multiphoton intrapulse interference phase scan method for simultaneous phase measurement and compensation of femtosecond laser pulses. J. Opt. Soc. Am. B 23, 750–759 (2006). [Google Scholar]
- Shane J., Mazilu M., Lee W. & Dholakia K. Effect of pulse temporal shape on optical trapping and impulse transfer using ultrashort pulsed lasers. Opt. Express 18, 7554–7568 (2010). [DOI] [PubMed] [Google Scholar]
- Antkowiak M., Torres-Mapa M., Gunn-Moore F. & Dholakia K. Application of dynamic diffractive optics for enhanced femtosecond laser based cell transfection. J. Biophotonics 3, 696–705 (2010). [DOI] [PubMed] [Google Scholar]
- Misawa H., Koshioka M., Sasaki K. & Kitamura N. Three-dimensional optical trapping and laser ablation of a single polymer latex particle in water. J. Appl. Phys. 70, 3829–3836 (1991). [Google Scholar]


