

Abstract
Adaptive radiation (AR) theory predicts that groups sharing the same source of ecological opportunity (EO) will experience deterministic species diversification and morphological evolution. Thus, deterministic ecological and morphological evolution should be correlated with deterministic patterns in the tempo and mode of speciation for groups in similar habitats and time periods. We test this hypothesis using well-sampled phylogenies of four squamate groups that colonized the New World (NW) in the Late Oligocene. We use both standard and coalescent models to assess species diversification, as well as likelihood models to examine morphological evolution. All squamate groups show similar early pulses of speciation, as well as diversity-dependent ecological limits on clade size at a continental scale. In contrast, processes of morphological evolution are not easily predictable and do not show similar pulses of early and rapid change. Patterns of morphological and species diversification thus appear uncoupled across these groups. This indicates that the processes that drive diversification and disparification are not mechanistically linked, even among similar groups of taxa experiencing the same sources of EO. It also suggests that processes of phenotypic diversification cannot be predicted solely from the existence of an AR or knowledge of the process of diversification.
Keywords: adaptive radiation, ecological opportunity, squamates, diversification, determinism, ecological limits
1. Introduction
Diversity resulting from adaptive radiation (AR) can be spectacular in both number and in form, though the processes of species and morphological diversification are often heterogeneous among clades [1–6]. While all groups may have experienced some process of diversification [3,6], it is likely that many clades have passed through an early-burst period of AR, where species entering unoccupied niches rapidly fill ecomorphological space [1,7–10], though not all groups encountering ecological opportunity (EO) show this pattern [11–16]. The theory of AR driven by EO suggests that this deterministic early-burst process governs both speciation and ecomorphological diversification, where ecological limits ultimately guide declines in rates as niches are filled [7,17]. However, an intriguing possibility is that species diversification is deterministic, while ecomorphological differences are intrinsic to the particular clade [3,18–20]. Thus, AR via EO may result in contingent morphological evolution, while processes associated with rates of diversification may be heavily deterministic.
For instance, EO apparently yielded early and rapid radiations in Dendroica warblers and West Indian anoles, but one produced birds adapted to forested areas of North America and the other lizards with shared ecomorphs adapted to various conditions on islands [17,21,22]. This obvious example indicates that the pattern of species diversification is similar between these lizards and birds, while the ecomorphological outcomes are still contingent upon the taxonomic group and geographical region. Traditional theory predicts that both morphological and species diversification will be high early in an AR, and slowly decline as niches are filled [1,17,23]. Therefore, even if the outcomes of morphological change are vastly different in groups experiencing an AR, the processes (e.g. early bursts and diversity dependence, DD) associated with this change may be predictable and deterministic [3].
Thus, the EO presented by colonization of a new region may promote deterministic patterns characterized by explosive early species diversification, but rates and patterns of morphological evolution associated with these species radiations may be contingent on the interaction between the organism, the environment and any pre-existing lineages [16,24]. If this is generally true, it would suggest that morphological diversification is decoupled (i.e. not necessarily a driving factor) from species diversification in the initial stages of an AR. Alternatively, groups experiencing high rates of phenotypic change (i.e. early bursts of morphological evolution) should be able to invade a larger breadth of niches, and thus promote rapid species diversification, implying that both processes are deterministic in an AR [25–28]. While this pattern has been detected [29], several studies have demonstrated that early bursts of species diversification may not be associated with early morphological bursts or low within-clade disparification [3,30]. On the other hand, early bursts of morphological diversification can occur without early bursts of species diversification [11,13,31].
There are several ways in which morphological and species diversification can be uncoupled. For example, it is possible for speciation rates to change while morphological variation remains static through time. In the case of allopatric speciation in non-adaptively radiating Plethodon salamanders, early bursts of species diversification occurred with little change in niche or morphology [32]. Therefore, early rapid speciation may not be accompanied by adaptive morphological change, particularly if the breadth of ecological resources is not explored. Alternatively, palaeontological and molecular phylogenetic studies have both shown that morphological variance can increase while rates of speciation decline [7,33,34]. In cases where morphology is linked to speciation rates, then the timing of ARs along the history of a group may also provide clues to the widespread disconnection between morphology and tempo. For example, a recently radiating group would likely fail to show a deceleration in rates of speciation or morphological change. It is also possible that random extinction and rapid morphological change towards the present would obscure the connection between morphological and species diversification [11,33]. Importantly, these contrasting results indicate that morphology and species diversification can be uncoupled and that the general premise of AR, which suggest that these factors are tied, may be incorrect, uncommon or difficult to detect.
Because the connection has mostly been untested for groups sharing the same source of EO, it is unclear what combinations of contingency and determinism could occur between processes of species and morphological diversification. To understand whether deterministic processes drive continental radiations, it is necessary to reduce variability associated with taxon physiology as well as area and timing of EO. Thus, to relate processes of species diversification and morphological change, we examine multiple ARs that occur in the same area in similar groups at similar times.
We have identified four groups of primarily temperate New World (NW) squamate reptiles that share a similar continental source and timing of EO: crotaline vipers, lampropeltinine ratsnakes, thamnophiine watersnakes and Plestiodon skinks. All four groups originated in the Old World (OW), likely tropical Asia, and subsequently colonized the NW through Beringia at the end of the Oligocene or Early Miocene [35–38]. All are diverse in the NW, and have produced from 3.5 to 19 times as many species as their OW sister groups [39]. Using multilocus phylogenies, we ask whether processes of species and morphological diversification are similar among groups that share the same source and timing of EO?
Taking into account phylogenetic uncertainty, we examine species diversification processes using standard likelihood and coalescent models as well as those that correct estimates given extinction rates (see the electronic supplemental material, table S1). These models assess constant diversification, changes in diversification owing to DD or ecological limits, and changes in diversification owing to external features including the environment [40–42]. Specifically, we test whether these radiations follow the same predictive deterministic processes indicated by AR theory [1,7,17]. By using measures of body size, we then ask whether processes of morphological diversification are similar among these groups and associated with any particular process of species diversification? Body size accounts for most of the variability within organisms and generally explain most physiological changes across these scales [43–45]. Size in squamates, particularly in snakes, is correlated with other adaptive morphological features, particularly gape, which governs key life-history attributes, such as prey size [46–49]. For the groups examined here, broad habitat preference in crotaline snakes and Plestiodon skinks is associated with body length [50–53], whereas size in lampropeltinine and thamnophiine snakes is linked to diet, locomotor performance and habitat preference [48,54,55]. We measure change in morphology over time using disparification analyses, and test five standard models across the phylogenies, accounting for Brownian motion (BM), increases or decreases in the rate of change through time (early and late bursts), stabilizing selection (Ornstein–Uhlenbeck, OU) and white noise [3,46,56,57]. Our results provide evidence that processes of species diversification are deterministic in groups that share a similar source of EO, whereas morphological change never occurs in early bursts and disparification is generally not predictable.
2. Methods
(a). Phylogenetic estimation
To examine patterns of species diversification in the NW squamate groups Crotalinae, Lampropeltini, Plestiodon and Thamnophiini (see the electronic supplementary material, table S2), dated phylogenies for each group were estimated using the relaxed phylogenetics method implemented in the program BEAST v. 1.6.2 [58,59]. Rates of evolution were independently drawn from an uncorrelated lognormal distribution while accounting for phylogenetic uncertainty. Trees were calibrated using fossil taxa placed at the stem of each group with an appropriate lognormal distribution (see the electronic supplementary material, text S1). Each gene was provided with its own partition and model (GTR + Γ + I) and rates and times were estimated under the uncorrelated lognormal tree-prior, with a birth–death prior on speciation rates and Jeffrey's priors on the substitution model parameters. BEAST was run for 5 × 10⁷ generations, sampling every 1000th generation, two times for each group to ensure convergence for all parameters, as determined using effective sample sizes (>200). We sampled 100 per cent, 89 per cent, 81 per cent and 78 per cent of the respective taxa for the indicated markers (in parentheses): lampropeltinines (1 mtdna, 2 ndna), NW Plestiodon (1 mtdna, 8 ndna), NW crotalines (7 mtdna, 1 ndna) and thamnophiines (6 mtdna; electronic supplementary material, text S1 and table S3).
(b). Morphological data
Morphologically diverse snakes and lizards tend to show the greatest difference on a size axis as measured by total length (TL) [35,36]. As snakes and skinks have indeterminate growth, we used log-transformed maximum TL in all species, this has been successfully applied in the studies of morphological change and evolution in both snakes and Plestiodon skinks [13,48,60]. Taxa were either measured directly for this study, or maximum TL was taken from the literature (see the electronic supplementary material, table S3).
(c). Models of species diversification
We first examine whether the posterior probability (Pp) of all trees show the signal of a non-constant speciation rate using the standard estimate for γ but under the consideration that with three of the four datasets not all NW species are sampled. For the crotalines, we sampled 81 per cent of known species (100/123), water snakes 78 per cent (45/58), lampropeltinines 100 per cent (37/37) and NW Plestiodon skinks 89 per cent (25/28). Because missing species can give the illusion of non-constant species diversification, and increased type I error [61,62], we used a modified version of the MCCRtest [13] in R [25] that accounts for missing taxa to be non-randomly sampled to the genus or higher taxonomic group. This procedure is simulated 1000 times for each group, the distribution of γ under these constant rate (CR) models is produced, and gammas from our real trees are compared with this CR distribution of gamma to assess significance.
Preferred models of species diversification were assessed across 5000 trees from the Pp distribution. Models were sorted into two basic categories: coalescent and standard likelihood models, because the former are likelihood approximations based on coalescent population genetic models taken from the literature and not comparable to the full likelihood solution of the latter. Within each category, models were ranked via AIC weights for each tree and then summarized over the entire Pp of trees (n = 5000) for each group in the R [63] function Misfits, available from co-author F.T.B. that also uses code from GEIGER [56], laser [41] and script from [40]. The nine coalescent models assess the probability of time-constant or time-variable rates of speciation (λ) and extinction (μ) and time-constant or time-variable diversity (speciation–extinction; electronic supplementary material, table S1). The 12 standard models account for Yule and birth–death processes, as well as changes in speciation rate owing to DD or external factors (SPVAR, Yule 2) such as the environment (monotonic or hyperbolic decay) and changes in extinction rate (EXVAR) or both speciation and extinction (BOTHVAR; [41]). Because none of these models can account for the impact of extinction on DD, we determined λ and μ values from the Pp tree for each group using the TreePar package in R [25], which uses a maximum likelihood (ML) method to test for constant species diversification, diversity dependence without extinction (DD − E) and diversity dependence with extinction (DD + E), where λ and μ were taken from the ML estimates [42]. We also re-parametrized λ and μ for the DD + E analyses to account for extinction when μ = 10–50% of the initial λ rate.
(d). Morphological evolution
We first determined whether there is significant phylogenetic signal for the morphological data collected for each of the four groups. We used Blomberg's K statistic [64], with 1000 randomizations in the R package ‘phytools’ [65].
We estimated the optimal model of size evolution for each squamate group using the models BM (morphological change with variance increasing from the root to tips), OU (stabilizing selection model) and early burst (morphological change decays exponentially with time) described in Harmon & Glor [66] as well as white noise, which is a non-phylogenetic model in which all species values are drawn from a single multivariate normal distribution with shared mean and variance [27,67,68] and the late burst model, where morphological change increases exponentially with time [46]. These five models were assessed using AIC weights over the Pp of trees for each group in the R function Minorthreat, available from co-author F.T.B.
We also used the node-height test to determine whether rates of morphological evolution have decreased through time. First, the absolute value of standardized independent contrasts for body size on the time-calibrated tree is calculated for each group. We correlated these contrasts with the age at each node. A significant positive relationship between contrast and age suggests that rates of morphological evolution have decreased through time [11,69,70].
We examined morphological disparity partitioning through time by modifying the code in GEIGER [56], which estimates disparity by calculating the average-squared Euclidean distance among all pairs of points in our trees for log-transformed SVL and compares these with a null model of 1000 simulations under multivariate BM to estimate a morphological disparity index (MDI), similar to previous strategies [70]. We developed the R function Badbrains, which calculates the difference in MDI between each null simulation against the mean of all null simulations to produce a distribution of null BM distances for each tree in the Pp. The difference between the MDI value of each real tree in the Pp is then compared with each respective null BM distance producing a Δ-MDI statistic, where distributions centred on zero are no different from the null, those that are negative suggest low within-clade disparity and those that are positive indicate high within-clade disparity.
3. Results
(a). Species diversification
Significantly negative gamma statistics, corrected for missing taxa, reject constant rates of species diversification in all groups (p < 0.001). Comparing nine coalescent-derived species diversification models across the Pp distribution of chronograms for each of the four groups overwhelmingly supports declines in speciation rates through time, and at least in crotalines, turnover in diversification where speciation rates are equal to extinction rates (figure 1). Similarly, among the 12 standard models of species diversification, DD has the highest AIC weights and is the most commonly found model across Pp distributions, although monotonic decay was also supported in Plestiodon skinks (figure 1).
Figure 1.

Frequency of occurrence for each of (a) the coalescent and (b) standard models with highest AIC weights (see electronic supplementary material, table S1) in the posterior probability distribution composed of 5000 trees for the four New World squamate groups. Models not present indicate they were chosen with a frequency approximately = 0.
Because the impact of DD is altered by extinction dynamics, we also examined the likelihood of DD against constant species diversification given extinction using a ML approach [34]. Here, DD with or without extinction is favoured over constant rates of species diversification (figure 2 and table 1). Both the shape and the timing of explosive species diversification are similar among groups, indicating that the Mid-Miocene showed extreme diversity accumulation in these groups (see the electronic supplementary material, figure S1).
Figure 2.

Lineage through time plots (black) for each of the four squamate groups compared with simulated curves (in grey), which use ML estimates of speciation rate (λ), extinction rate (μ) and carrying capacity (K) from the time calibrated trees. These simulated curves account for diversity dependence and extinction for each group and are contrasted against lineage through time plots from the real trees (see text and Etienne et al. [42]).
Table 1.
Tests of models of diversification for each of the four groups of squamates that account for constant rates and diversity dependence (DD) with and without extinction using TreePar [6,34]. For the DD models, estimates of speciation (λ), extinction (μ) and carrying capacities (K) were unconstrained or constrained with μ equal to 10–50% of the initial unconstrained λ. Models with the lowest AICc values and highest AIC weights are marked with an asterisk.
| taxon-model | λ | μ | K | likelihood | AICc | AIC weights |
|---|---|---|---|---|---|---|
| Crotalinae | ||||||
| constant rates | 0.198 | 0 | −188.795 | 381.717 | 0 | |
| DD unconstrained | 0.470 | 0 | 114 | −173.640 | 353.535 | *0.545 |
| DD μ = 10% | 0.549 | 0.047 | 118 | −175.017 | 354.160 | 0.398 |
| DD μ = 20% | 0.634 | 0.094 | 122 | −177.041 | 358.208 | 0.053 |
| DD μ = 30% | 0.716 | 0.141 | 127 | −179.617 | 363.360 | 0.004 |
| DD μ = 40% | 0.792 | 0.188 | 133 | −182.767 | 369.660 | 0 |
| DD μ = 50% | 0.856 | 0.235 | 141 | −186.414 | 376.954 | 0 |
| Thamnophiini | ||||||
| constant rates | 0.125 | 0 | −102.718 | 209.736 | 0 | |
| DD ML unconstrained | 0.430 | 0.040 | 51 | −95.143 | 196.901 | 0.107 |
| DD μ = 10% | 0.440 | 0.043 | 51 | −95.145 | 194.589 | *0.340 |
| DD μ = 20% | 0.597 | 0.086 | 52 | −95.606 | 195.513 | 0.214 |
| DD μ = 30% | 0.725 | 0.129 | 55 | −96.921 | 198.142 | 0.057 |
| DD μ = 40% | 0.840 | 0.172 | 58 | −99.080 | 202.460 | 0.007 |
| DD μ = 50% | 0.920 | 0.215 | 62 | −101.851 | 208.002 | 0 |
| Lampropeltini | ||||||
| constant rates | 0.126 | 0 | −83.298 | 170.971 | 0.006 | |
| DD ML unconstrained | 0.286 | 0 | 43 | −78.708 | 164.190 | 0.178 |
| DD μ = 10% | 0.338 | 0.029 | 44 | −79.115 | 162.605 | *0.393 |
| DD μ = 20% | 0.396 | 0.057 | 45 | −79.638 | 163.651 | 0.233 |
| DD μ = 30% | 0.461 | 0.086 | 46 | −80.309 | 164.994 | 0.119 |
| DD μ = 40% | 0.530 | 0.115 | 47 | −81.146 | 166.666 | 0.052 |
| DD μ = 50% | 0.587 | 0.143 | 49 | −82.155 | 168.685 | 0.019 |
| Plestiodon | ||||||
| constant rates | 0.090 | 0 | −62.432 | 129.464 | 0 | |
| DD ML unconstrained | 0.379 | 0 | 25 | −51.772 | 110.807 | *0.779 |
| DD μ = 10% | 0.449 | 0.038 | 27 | −54.433 | 113.466 | 0.206 |
| DD μ = 20% | 0.523 | 0.076 | 29 | −57.158 | 118.916 | 0.014 |
| DD μ = 30% | 0.576 | 0.114 | 32 | −60.033 | 124.667 | 0.001 |
| DD μ = 40% | 0.614 | 0.152 | 36 | −62.952 | 130.505 | 0 |
| DD μ = 50% | 0.693 | 0.189 | 38 | −65.851 | 136.301 | 0 |
(b). Morphological evolution
Phylogenetic signal was significantly different from a random distribution for body size for all three snake groups (Blomberg's K = 0.685–0.703, p < 0.003) but not for Plestiodon (Blomberg's K = 0.407, p = 0.152). Models of phenotypic evolution differ among groups with respect to both fit across trees and disparity. Models with the highest AIC weights are indistinguishable between OU and late burst for the three snake taxa and white noise for Plestiodon (figure 3). The predicted early-burst model was not supported in any clade. Additionally, independent contrasts were not significantly correlated with age (p = 0.101–0.284), which also fails to support an early burst in morphology with a slowdown towards present time. Low within-clade disparity, indicated by a negative morphological disparity Δ-MDI distribution, was detected only in lampropeltinines and thamnophiines, whereas crotalines follow null BM disparification, and skinks reveal high within-clade disparification (figure 4).
Figure 3.

Frequency of occurrence for each of the morphological models with highest (a) and second highest (b) AIC weights in the posterior probability (Pp) distribution for the four New World squamate groups examined here. Differences between the highest and second highest AIC weights are displayed. Models not present indicate they were chosen with frequency = 0.
Figure 4.
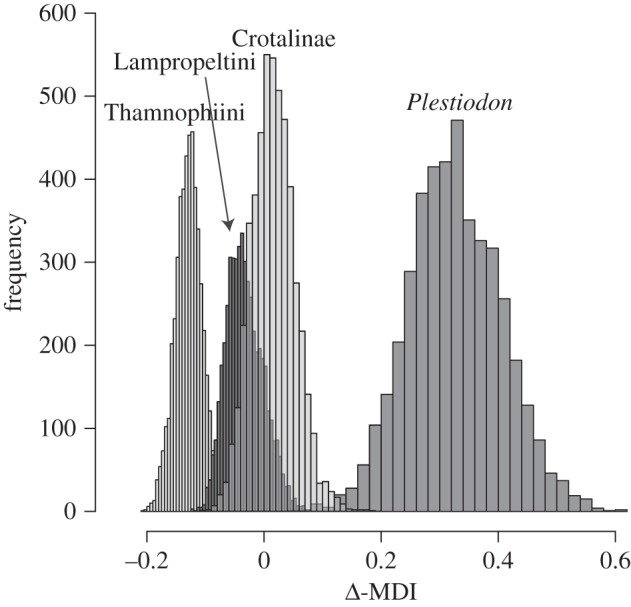
Relative disparity through time estimates represented as Δ-MDI scores (see text) for each of the four NW squamate groups.
4. Discussion
(a). Speciation and extinction rates
Theory predicts that diversification for groups sharing the same physical and temporal source of EO should follow a predictive deterministic process of diversification as niches are filled [7]. Here, we show that species diversification in four co-occurring squamate groups follow the same deterministic process of diversity-dependent speciation and extinction (figure 2). Originating in the NW during the Late Oligocene, these four groups exhibit a common pattern of explosive radiation beginning in the Mid-Miocene (figure 2). This timing of early species diversification for snakes is consistent with the fossil record suggesting modern genera and species formed in the Mid-Miocene, particularly in North America, and is associated with the reworking of forested habitats into grasslands [71]. While this pattern of early burst in speciation is expected and has been documented for other organisms [2,23,32,42,72,73], what is intriguing here is that the decline in speciation rate among the squamates is due to DD, despite differences in diversity among groups ranging from 28 to 123 species.
The standard species diversification models suggest that linear DD dominates three of the four groups, with skinks showing equal support for DD and monotonic decay (a slowing in speciation rate due to external or environmental factors; [17]). However, these standard models do not account for extinction, potentially giving the illusion of early explosive species diversification and a later slowdown owing to DD. Accounting for extinction with DD using a ML approach [42] rejects constant rate models and still indicates DD ultimately determines species richness for all taxa (table 1). Therefore, the signal of a deterministic evolutionary process is present in all groups, where the speed of species diversification is initially high after colonization and slows down as diversity increases. This suggests that the exhaustion of novel ecological space is associated with increased diversity and declining rates, as predicted by the theory of AR [7].
The existence of ecological limits and how they function at higher taxonomic levels have been questioned [24,74,75], yet several studies have demonstrated DD within younger groups, where taxa are well sampled [17,42,73]. For more ancient groups, ecological limits have been detected using phylogenetic methods but here the impact of increasing extinction over speciation may confound interpretation [6,76,77]. The taxa examined here are relatively young and extinction rates are always estimated to be much less than speciation rates (table 1). It is therefore likely that DD occurs within these groups that also share similar niches and morphologies, at least until a key innovation evolves, extinction exceeds speciation, or habitats change, reducing competition among members, opening new niche space and allowing for another pulse of explosive diversification [13]. Our results indicate that ecological limits exist at a continental scale and thus, along with the initial colonization of new groups, shape faunal patterns of these communities in the NW.
(b). Morphological disparification
We find that morphological change is decoupled from species diversification, and that morphological disparification processes are generally unique to each group. With regard to the fit of body length across phylogenetic space, we demonstrate that snakes generally follow a pattern of late burst or stabilizing selection (random walk with a central tendency; OU) model of diversification, whereas Plestiodon skinks are no different from a random draw with no phylogenetic signal (white noise). Importantly, none of these groups show the pattern of initial, rapid morphological change predicted for taxa that have diversified early in their evolutionary history [3,8,29,64,78]. Low within-clade disparity, where species invade and diversify within niches early, is expected for taxa that show early bursts of speciation [23,78,79]. However, this pattern (as measured by the Δ-MDI score) is detected only in two groups (Lampropeltini and Thamnophiini). Low within-clade disparification seen in Lampropeltini is generally associated with clades composed of large taxa that generally feed on endothermic prey (e.g. Pantherophis and Pituophis) contrasted with the smaller sized clades (e.g. Lampropeltis, Cemophora and Arizona) that generally have ectothermic prey diets [48]. Similarly in Thamnophiini, clades composed of taxa with large body sizes tend to remain in aquatic habitats and have mostly piscivorous diets (e.g. Nerodia), whereas clades composed of smaller taxa (e.g. Thamnophis) generally consume smaller terrestrial prey [54]. Within-clade disparity in Crotalinae follows a null BM pattern, and Plestiodon skinks demonstrate high within-clade disparity, a pattern usually indicative of constant rates of species diversification [79].
(c). Contingency and determinism in adaptive radiation
AR predicts that species should diversify rapidly in the face of EO and subside as the availability of new niches decrease. In turn, as the expansion of ecological breadth decreases, so should phenotypic variance [7]. How can groups such as the squamates examined here, sharing similar modes of DD species diversification with the same temporal and geographical EO, not show the predicted pattern of low within-clade disparification and early bursts of morphological diversification? While it is possible that the signature of early morphological divergence may also have been erased by successive diversification resulting in extant morphologies having little power to assess older patterns of change [3], it is also possible that morphological variation, at least regarding body size, is not tightly linked to the early diversification of species within distinct niches. This is in contrast with what might be expected under an AR process where ecomorphological differences are the driver of speciation. Snake diversification in the West Indies has shown that ecological niche and morphological disparity are uncoupled, where niche follows the pattern of high disparity consistent with constant speciation rates and morphology reflects low disparity [13]. Therefore, the possibility remains that morphological divergence, at least in size, is not related to niche divergence. It is also possible that other traits more directly associated with EO evolve rapidly in early bursts, while body size does not. However, the pace and process of morphological diversification may have little to do with the pace of species diversification, and may not be predictable across groups that share the same source of EO. Such de-coupling of species diversification and disparification dynamics among groups has been found by other authors [3,11,13,31]. Therefore, morphological change may be contingent to the group, and tied to their particular niches and specific ecological limits under which the clades evolved. For instance, the only lizard clade (Plestiodon), which by default exists in a very different niche space than the other taxa, shows a morphological pattern without significant phylogenetic signal and positive disparity, usually associated with constant rates of speciation, whereas the other clades demonstrate negative or neutral disparity.
A very likely explanation for these results is that a strict association between species diversification and morphological variation is unlikely in an AR. In the snake taxa examined here, morphological diversity is still rising, whereas rates of speciation decline. This has been observed in the fossil record and other molecular phylogenetic studies showing that while rates of morphological and species diversification may be closely tied early in the history of a group, this association becomes unravelled at the end of an AR [7,30,31]. Here, DD reduces speciation rate, but seems to have no effect on rates of morphological change, indicating that different causes change rates of morphological and species diversification. Foote [33] suggested that if both newly originating lineages and those that go extinct are random with respect to the morphological variation found within the group, then morphological diversity should continue to increase unabated as rates of speciation decrease. Furthermore, if speciation occurs only at the edges of the morphological distribution, then rates of morphological diversity should increase as speciation rates decline, as seen in the late morphological burst pattern among the snakes examined here. Decoupled species and morphological diversification should then be considered as a likely outcome at the end of AR rather than a pattern that refutes the theory.
(d). Conclusions
Our analyses demonstrate that diversification processes during AR are deterministic when sources and timing of EO are similar. Here, reptiles that colonized the NW in the Late Oligocene or Early Miocene all show similar timing of early pulses of speciation as well as diversity-dependent ecological limits at a continental scale. By contrast, processes of morphological divergence are not easily predictable and likely contingent to the group and their particular niches and saturation limits. This indicates that, while ecological differentiation is still likely the primary driver of AR via EO, the processes that drive species diversification and disparification may not be mechanistically linked, particularly at the later stages of an AR. Second, it suggests that processes of phenotypic evolution cannot be predicted solely from the existence of an AR or knowledge of the process of species diversification. Future questions now include (i) is this similarity of species diversification process conserved across even more distantly related groups (e.g. squamates compared with birds, mammals, amphibians, sponges, microbes, etc.) and (ii) what is the diversity of disparification processes among groups, and can it be related to any ecological or temporal factors (e.g. microhabitat utilization, competition, timing of colonization, etc.)?
Acknowledgements
We thank T. Stadler and R. Etienne for help with the R code, and E. Dedits, R. Walsh and P. Muzio for assistance with the CUNY High Performance Computing Cluster and the following for access to specimens: Adrián Nieto Montes de Oca, Museum of Comparative Zoology, University of Texas at Arlington and University of Kansas. We also thank two anonymous reviewers for valuable suggestions that substantially improved the quality of this manuscript. Analyses were facilitated by a grant of computer time from the City University of New York High Performance Computing Center, which is supported by US National Science Foundation (grant nos CNS-0855217 and CNS-0958379). This research was funded in part by US NSF (grant no. DBI-0905765 to R.A.P.). Financial support was also provided by L. Clampitt, S. Harris and D. Rosenberg.
References
- 1.Simpson G. G. 1953. The major features of evolution, 434 pp. New York, NY: Columbia University Press [Google Scholar]
- 2.Purvis A., Orme D. C. D. L., Toomey B. N. H., Pearson P. N. 2009. Temporal patterns in diversification rates. In Speciation and patterns of diversity (eds Butlin R., Bridle J., Schluter D.), pp. 278–300 Cambridge, UK: Cambridge University Press [Google Scholar]
- 3.Harmon L. J., et al. 2010. Early bursts of body size and shape evolution are rare in comparative data. Evolution 64, 2385–2396 10.1111/j.1558-5646.2010.01025.x (doi:10.1111/j.1558-5646.2010.01025.x) [DOI] [PubMed] [Google Scholar]
- 4.Ricklefs R. E., Losos J. B., Townsend T. M. 2007. Evolutionary diversification of clades of squamate reptiles. J. Evol. Biol. 20, 1751–1762 10.1111/j.1420-9101.2007.01388.x (doi:10.1111/j.1420-9101.2007.01388.x) [DOI] [PubMed] [Google Scholar]
- 5.Ricklefs R. E. 2006. Evolutionary diversification and the origin of the diversity–environment relationship. Ecology 87, S3–S13 10.1890/0012-9658(2006)87[3:EDATOO]2.0.CO;2 (doi:10.1890/0012-9658(2006)87[3:EDATOO]2.0.CO;2) [DOI] [PubMed] [Google Scholar]
- 6.Pyron R. A., Burbrink F. T. 2012. Extinction, ecological opportunity, and the origins of global snake diversity. Evolution 66, 163–178 10.1111/j.1558-5646.2011.01437.x (doi:10.1111/j.1558-5646.2011.01437.x) [DOI] [PubMed] [Google Scholar]
- 7.Schluter D. 2000. The ecology of adaptive radiation, 288 pp. Oxford, UK: Oxford University Press [Google Scholar]
- 8.Simpson G. G. 1944. Tempo and mode in evolution, 237 pp. New York, NY: Columbia University Press [Google Scholar]
- 9.Nee S., Mooers A. O., Harvey P. H. 1992. Tempo and mode of evolution revealed from molecular phylogenies. Proc. Natl Acad. Sci. USA 89, 8322–8326 10.1073/pnas.89.17.8322 (doi:10.1073/pnas.89.17.8322) [DOI] [PMC free article] [PubMed] [Google Scholar]
- 10.McPeek M. A. 2008. The ecological dynamics of clade diversification and community assembly. Am. Nat. 172, E270–E284 10.1086/593137 (doi:10.1086/593137) [DOI] [PubMed] [Google Scholar]
- 11.Slater G. J., Price S. A., Santini F., Alfaro M. E. 2010. Diversity versus disparity and the radiation of modern cetaceans. Proc. R. Soc. B 277, 3097–3104 10.1098/rspb.2010.0408 (doi:10.1098/rspb.2010.0408) [DOI] [PMC free article] [PubMed] [Google Scholar]
- 12.Alfaro M. E., Brock C. D., Banbury B. L., Wainwright P. C. 2009. Does evolutionary innovation in pharyngeal jaws lead to rapid lineage diversification in labrid fishes? BMC Evol. Biol. 9, 255. 10.1186/1471-2148-9-255 (doi:10.1186/1471-2148-9-255) [DOI] [PMC free article] [PubMed] [Google Scholar]
- 13.Burbrink F. T., Ruane S., Pyron R. A. 2012. When are adaptive radiations replicated in areas? Ecological opportunity and unexceptional diversification in West Indian dipsadine snakes (Colubridae: Alsophiini). J. Biogeogr. 39, 465–475 10.1111/j.1365-2699.2011.02621.x (doi:10.1111/j.1365-2699.2011.02621.x) [DOI] [Google Scholar]
- 14.Esselstyn J. A., Timm R. M., Brown R. M. 2009. Do geological or climatic processes drive speciation in dynamic archipelagos? The tempo and mode of diversification in southeast Asian shrews. Evolution 63, 2595–2610 10.1111/j.1558-5646.2009.00743.x (doi:10.1111/j.1558-5646.2009.00743.x) [DOI] [PubMed] [Google Scholar]
- 15.Pinto G., Mahler D. L., Harmon L. J., Losos J. B. 2008. Testing the island effect in adaptive radiation: rates and patterns of morphological diversification in Caribbean and mainland Anolis lizards. Proc. R. Soc. B 275, 2749–2757 10.1098/rspb.2008.0686 (doi:10.1098/rspb.2008.0686) [DOI] [PMC free article] [PubMed] [Google Scholar]
- 16.Betancur-R R., Ortí G., Stein A. M., Marceniuk A. P., Alexander Pyron R. 2012. Apparent signal of competition limiting diversification after ecological transitions from marine to freshwater habitats. Ecol. Lett. 15, 822–830 10.1111/j.1461-0248.2012.01802.x (doi:10.1111/j.1461-0248.2012.01802.x) [DOI] [PubMed] [Google Scholar]
- 17.Rabosky D. L., Lovette I. J. 2008. Density-dependent diversification in North American wood warblers. Proc. R. Soc. B 275, 2363–2371 10.1098/rspb.2008.0630 (doi:10.1098/rspb.2008.0630) [DOI] [PMC free article] [PubMed] [Google Scholar]
- 18.Taylor E. B., McPhail J. D. 2000. Historical contingency and ecological determinism interact to prime speciation in sticklebacks, Gasterosteus. Proc. R. Soc. Lond. B 267, 2375–2384 10.1098/rspb.2000.1294 (doi:10.1098/rspb.2000.1294) [DOI] [PMC free article] [PubMed] [Google Scholar]
- 19.Losos J. B., Jackman T. R., Larson A., de Queiroz K., Rodriguez-Schettino L. 1998. Contingency and determinism in replicated adaptive radiations of island lizards. Science 279, 2115–2118 10.1126/science.279.5359.2115 (doi:10.1126/science.279.5359.2115) [DOI] [PubMed] [Google Scholar]
- 20.Losos J. B. 2010. Adaptive radiation, ecological opportunity, and evolutionary determinism. Am. Nat. 175, 623–639 10.1086/652433 (doi:10.1086/652433) [DOI] [PubMed] [Google Scholar]
- 21.Losos J. B. 2009. Lizards in an evolutionary tree: the ecology of adaptive radiation in anoles, pp. 507 Berkeley, CA: University of California Press [Google Scholar]
- 22.Rabosky D. L., Glor R. E. 2010. Equilibrium speciation dynamics in a model adaptive radiation of island lizards. Proc. Natl Acad. Sci. USA 107, 22 178–22 183 10.1073/pnas.1007606107 (doi:10.1073/pnas.1007606107) [DOI] [PMC free article] [PubMed] [Google Scholar]
- 23.Burbrink F. T., Pyron R. A. 2010. How does ecological opportunity influence rates of speciation, extinction, and morphological diversification in new world ratsnakes (tribe Lampropeltini)? Evolution 64, 934–943 10.1111/j.1558-5646.2009.00888.x (doi:10.1111/j.1558-5646.2009.00888.x) [DOI] [PubMed] [Google Scholar]
- 24.Wiens J. J. 2011. The causes of species richness patterns across space, time, and clades and the role of ‘ecological limits’. Q. Rev. Biol. 86, 75–96 10.1086/659883 (doi:10.1086/659883) [DOI] [PubMed] [Google Scholar]
- 25.Rabosky D. L., Adams D. C. 2012. Rates if morphological evolution are correlated with species richness in salamanders. Evolution 66, 1807–1818 10.1111/j.1558-5646.2011.01557.x (doi:10.1111/j.1558-5646.2011.01557.x) [DOI] [PubMed] [Google Scholar]
- 26.Vermeij G. J. 1973. Adaptation, versatility, and evolution. Syst. Zool. 22, 466–477 10.2307/2412953 (doi:10.2307/2412953) [DOI] [Google Scholar]
- 27.Parent C. E., Crespi B. J. 2009. Ecological opportunity in adaptive radiation of Galapagos endemic land snails. Am. Nat. 174, 898–905 10.1086/646604 (doi:10.1086/646604) [DOI] [PubMed] [Google Scholar]
- 28.Martin C. H., Wainwright P. C. 2011. Trophis novelty is linked to exceptional rates of morphological diversification in two adaptive radiations of Cyprinodon pupfish. Evolution 65, 2197–2212 10.1111/j.1558-5646.2011.01294.x (doi:10.1111/j.1558-5646.2011.01294.x) [DOI] [PubMed] [Google Scholar]
- 29.Mahler D. L., Revell L. J., Glor R. E., Losos J. B. 2010. Ecological opportunity and the rate of morphological evolution in the diversification of Greater Antillean anoles. Evolution 64, 2731–2745 10.1111/j.1558-5646.2010.01026.x (doi:10.1111/j.1558-5646.2010.01026.x) [DOI] [PubMed] [Google Scholar]
- 30.Rowe K. C., Aplin K. P., Baverstock P. R., Moritz C. 2011. Recent and rapid speciation with limited morphological disparity in the genus Rattus. Syst. Biol. 60, 188–203 10.1093/sysbio/syq092 (doi:10.1093/sysbio/syq092) [DOI] [PubMed] [Google Scholar]
- 31.Derryberry E. P., Claramunt S., Derryberry G., Chesser R. T., Cracraft J., Aleixo A., Pérez-Emán J., Remsen J. J. V., Brumfield R. T. 2011. Lineage diversificartion and morphological evolution in a large-scale continental radiation: the neotropical ovenbirds and woodcreepers (Aves: Furnariidae). Evolution 65, 2973–2986 10.1111/j.1558-5646.2011.01374.x (doi:10.1111/j.1558-5646.2011.01374.x) [DOI] [PubMed] [Google Scholar]
- 32.Kozak K. H., Weisrock D. W., Larson A. 2006. Rapid lineage accumulation in a non-adaptive radiation: phylogenetic analysis of diversification rates in eastern North American woodland salamanders (Plethodontidae: Plethodon). Proc. R. Soc. B 273, 539–546 10.1098/rspb.2005.3326 (doi:10.1098/rspb.2005.3326) [DOI] [PMC free article] [PubMed] [Google Scholar]
- 33.Foote M. 1993. Discordance and concordance between morphological and taxonomic diversity. Paleobiology 19, 185–204 [Google Scholar]
- 34.Price T., Irby J. L., Bermingham E., Gibbs H. L., Richman A. D. 2000. The imprint of history on communities of North American and Asian warblers. Am. Nat. 156, 354–367 10.1086/303397 (doi:10.1086/303397) [DOI] [PubMed] [Google Scholar]
- 35.Burbrink F. T., Lawson R. 2007. How and when did Old World ratsnakes disperse into the New World? Mol. Phylogenet. Evol. 43, 173–189 10.1016/j.ympev.2006.09.009 (doi:10.1016/j.ympev.2006.09.009) [DOI] [PubMed] [Google Scholar]
- 36.Brandley M. C., Wang Y. Z., Guo X. G., de Oca A. N. M., Feria-Ortiz M., Hikida T., Ota H. 2011. Accommodating heterogenous rates of evolution in molecular divergence dating methods: an example using intercontinental dispersal of Plestiodon (Eumeces) lizards. Syst. Biol. 60, 3–15 10.1093/sysbio/syq045 (doi:10.1093/sysbio/syq045) [DOI] [PubMed] [Google Scholar]
- 37.Wuster W., Peppin L., Pook C. E., Walker D. E. 2008. A nesting of vipers: phylogeny and historical biogeography of the Viperidae (Squamata: Serpentes). Mol. Phylogenet. Evol. 49, 445–459 10.1016/j.ympev.2008.08.019 (doi:10.1016/j.ympev.2008.08.019) [DOI] [PubMed] [Google Scholar]
- 38.Guo P., Liu Q., Xu Y., Jiang K., Hou M., Ding L., Pyron R. A., Burbrink F. T. 2012. Out of Asia: natricine snakes support the Cenozoic Beringian dispersal hypothesis. Mol. Phylogenet. Evol. 63, 825–833 [DOI] [PubMed] [Google Scholar]
- 39.Uetz P. 2009. The reptile database. See http://www.reptile-database.org/ [Google Scholar]
- 40.Morlon H., Potts M. D., Plotkin J. B. 2010. Inferring the dynamics of diversification: a coalescent approach. PLoS Biol. 8, ARTN e1000493. 10.1371/journal.pbio.1000493 (doi:10.1371/journal.pbio.1000493) [DOI] [PMC free article] [PubMed] [Google Scholar]
- 41.Rabosky D. L. 2006. LASER: a maximum likelihood toolkit for detecting temporal shifts in diversification rates from molecular phylogenies. Evol. Bioinform. 2, 247–250 [PMC free article] [PubMed] [Google Scholar]
- 42.Etienne R. S., Haegeman B., Stadler T., Aze T., Pearson P. N., Purvis A., Phillimore A. B. 2011. Diversity-dependence brings molecular phylogenies closer to agreement with the fossil record. Proc. R. Soc. B 279, 1300–1309 10.1098/rspb.2011.1439 (doi:10.1098/rspb.2011.1439) [DOI] [PMC free article] [PubMed] [Google Scholar]
- 43.Peters R. H. 1983. The ecological implications of body size, 329 pp Cambridge, UK: Cambridge University Press [Google Scholar]
- 44.Blackburn T. M., Gaston K. J. 2004. Macroecology. Basic Appl. Ecol. 5, 385–387 10.1016/j.baae.2004.08.005 (doi:10.1016/j.baae.2004.08.005) [DOI] [Google Scholar]
- 45.Gaston K. J., Blackburn T. M. 2000. Pattern and process in macroecology, 377 pp. Malden, MA: Blackwell Science [Google Scholar]
- 46.Burbrink F. T., Ruane S., Pyron R. A. 2011. When are adaptive radiations replicated in areas? Ecological opportunity and unexceptional diversification in West Indian dipsadine snakes (Colubridae: Alsophiini). J. Biogeogr. 39, 465–475 10.1111/j.1365-2699.2011.02621.x (doi:10.1111/j.1365-2699.2011.02621.x) [DOI] [Google Scholar]
- 47.Vitt L. J. 1987. Communities. In Snakes: ecology and evolutionary biology (eds Seigel R. A., Collins J. T., Novak S. S.), pp. 335–365 Caldwell, NJ: The Blackburn Press [Google Scholar]
- 48.Pyron R. A., Burbrink F. T. 2009. Body size as a primary determinant of ecomorphological diversification and the evolution of mimicry in the lampropeltinine snakes (Serpentes: Colubridae). J. Evol. Biol. 22, 2057–2067 10.1111/j.1420-9101.2009.01820.x (doi:10.1111/j.1420-9101.2009.01820.x) [DOI] [PubMed] [Google Scholar]
- 49.Rodriguez-Robles J. A., Bell C. J., Greene H. W. 1999. Gape size and evolution of diet in snakes: feeding ecology of erycine boas. J. Zool. 248, 49–58 [Google Scholar]
- 50.Griffith H. 1990. Miniaturization and elongation in Eumeces (Sauria: Scincidae). Copeia 1990, 751–758 [Google Scholar]
- 51.Hampton P. M. 2010. Ventral and sub-caudal scale counts are associated with macrohabitat use and tail specialization in viperid snakes. Evol. Ecol. 25, 531–546 10.1007/s10682-010-9432-z (doi:10.1007/s10682-010-9432-z) [DOI] [Google Scholar]
- 52.Richmond J. Q., Reeder T. W. 2002. Evidence for parallel ecological speciation in scincid lizards of the Eumeces skiltonianus species group (Squamata: Scincidae). Evolution 56, 1498–1513 [DOI] [PubMed] [Google Scholar]
- 53.Richmond J. Q., Jockusch E. L. 2007. Body size evolution simultaneously creates and collapses species boundaries in a clade of scincid lizards. Proc. R. Soc. B 274, 1701–1708 10.1098/rspb.2007.0364 (doi:10.1098/rspb.2007.0364) [DOI] [PMC free article] [PubMed] [Google Scholar]
- 54.Vincent S. E., Brandley M. C., Herrel A., Alfaro M. E. 2009. Convergence in trophic morphology and feeding performance among piscivorous natricine snakes. J. Evol. Biol. 22, 1203–1211 10.1111/j.1420-9101.2009.01739.x (doi:10.1111/j.1420-9101.2009.01739.x) [DOI] [PubMed] [Google Scholar]
- 55.Hopkins W. A., Winne C. T. 2006. Influence of body size on swimming performance of four species of neonatal natricine snakes acutely exposed to a cholinesterase-inhibiting pesticide. Environ. Toxicol. Chem. 25, 1208–1213 10.1897/05-028r.1 (doi:10.1897/05-028r.1) [DOI] [PubMed] [Google Scholar]
- 56.Harmon L. J., Weir J. T., Brock C. D., Glor R. E., Challenger W. 2008. GEIGER: investigating evolutionary radiations. Bioinformatics 24, 129–131 10.1093/bioinformatics/btm538 (doi:10.1093/bioinformatics/btm538) [DOI] [PubMed] [Google Scholar]
- 57.Hansen T. F. 1997. Stabilizing selection and the comparative analysis of adaptation. Evolution 51, 1341–1351 [DOI] [PubMed] [Google Scholar]
- 58.Drummond A. J., Ho S. Y. W., Phillips M. J., Rambaut A. 2006. Relaxed phylogenetics and dating with confidence. PLoS Biol. 4, ARTN e88. 10.1371/journal.pbio.0040088 (doi:10.1371/journal.pbio.0040088) [DOI] [PMC free article] [PubMed] [Google Scholar]
- 59.Drummond A. J., Rambaut A. 2007. BEAST: Bayesian evolutionary analysis by sampling trees. BMC Evol. Biol. 7, 214. 10.1186/1471-2148-7-214 (doi:10.1186/1471-2148-7-214) [DOI] [PMC free article] [PubMed] [Google Scholar]
- 60.Eastman J. M., Alfaro M. E., Joyce P., Hipp A. L., Harmon L. J. 2011. A novel method for identifying shifts in the rate of character evolution on trees. Evolution 65, 3578–3589 10.1111/j.1558-5646.2011.01401.x (doi:10.1111/j.1558-5646.2011.01401.x) [DOI] [PubMed] [Google Scholar]
- 61.Pybus O. G., Harvey P. H. 2000. Testing macro-evolutionary models using incomplete molecular phylogenies. Proc. R. Soc. Lond. B 267, 2267–2272 10.1098/rspb.2000.1278 (doi:10.1098/rspb.2000.1278) [DOI] [PMC free article] [PubMed] [Google Scholar]
- 62.Cusimano N., Renner S. S. 2010. Slowdowns in diversification rates from real phylogenies may not be real. Syst. Biol. 59, 458–464 10.1093/sysbio/syq032 (doi:10.1093/sysbio/syq032) [DOI] [PubMed] [Google Scholar]
- 63.R Development Core Team 2011. R: a language and environment for statistical computing. Vienna, Austria: R Foundation for Statistical Computing (see http://www.R-project.org).
- 64.Blomberg S. P., Garland T., Ives A. R. 2003. Testing for phylogenetic signal in comparative data: behavioral traits are more labile. Evolution 57, 717–745 [DOI] [PubMed] [Google Scholar]
- 65.Revell L. J. 2012. Phytools: an R package for phylogenetic comparative biology (and other things). Methods Ecol. Evol. 3, 217–223 10.1111/j.2041-210X.2011.00169.x (doi:10.1111/j.2041-210X.2011.00169.x) [DOI] [Google Scholar]
- 66.Harmon L. J., Glor R. E. 2010. Poor statistical performance of the mantel test in phylogenetic comparative analyses. Evolution 64, 2173–2178 10.1111/j.1558-5646.2010.00973.x (doi:10.1111/j.1558-5646.2010.00973.x) [DOI] [PubMed] [Google Scholar]
- 67.Venditti C., Meade A., Pagel M. 2011. Multiple routes to mammalian diversity. Nature 479, 393–396 10.1038/nature10516 (doi:10.1038/nature10516) [DOI] [PubMed] [Google Scholar]
- 68.Kozak K. H., Wiens J. J. 2010. Niche conservatism drives elevational diversity patterns in Appalachian salamanders. Am. Nat. 176, 40–54 10.1086/653031 (doi:10.1086/653031) [DOI] [PubMed] [Google Scholar]
- 69.Freckleton R. P., Harvey P. H. 2006. Detecting non-Brownian trait evolution in adaptive radiations. PLoS Biol. 4, e373. 10.1371/journal.pbio.0040373 (doi:10.1371/journal.pbio.0040373) [DOI] [PMC free article] [PubMed] [Google Scholar]
- 70.Felsenstein J. 1985. Phylogenies and the comparative method. Am. Nat. 125, 1–15 10.1086/284325 (doi:10.1086/284325) [DOI] [Google Scholar]
- 71.Holman J. A. 2000. Fossil snakes of North America: origin, evolution, distribution, paleoecology, xi, 357 pp Bloomington, IN: Indiana University Press [Google Scholar]
- 72.Kozak K. H., Larson A. A., Bonett R. M., Harmon L. J. 2005. Phylogenetic analysis of ecomorphological divergence, community structure, and diversification rates in dusky salamanders (Plethodontidae: Desmognathus). Evolution 59, 2000–2016 [PubMed] [Google Scholar]
- 73.Phillimore A. B., Price T. D. 2008. Density-dependent cladogenesis in birds. PLoS Biol. 6, e71. 10.1371/journal.pbio.0060071 (doi:10.1371/journal.pbio.0060071) [DOI] [PMC free article] [PubMed] [Google Scholar]
- 74.Losos J. B., Schluter D. 2000. Analysis of an evolutionary species–area relationship. Nature 408, 847–850 10.1038/35048558 (doi:10.1038/35048558) [DOI] [PubMed] [Google Scholar]
- 75.Hurlbert A. H., Jetz W. 2010. More than ‘more individuals’: the nonequivalence of area and energy in the scaling of species richness. Am. Nat. 176, E50–E65 10.1086/650723 (doi:10.1086/650723) [DOI] [PubMed] [Google Scholar]
- 76.Rabosky D. L. 2009. Ecological limits and diversification rate: alternative paradigms to explain the variation in species richness among clades and regions. Ecol. Lett. 12, 735–743 10.1111/j.1461-0248.2009.01333.x (doi:10.1111/j.1461-0248.2009.01333.x) [DOI] [PubMed] [Google Scholar]
- 77.Rabosky D. L. 2009. Ecological limits on clade diversification in higher taxa. Am. Nat. 173, 662–674 10.1086/597378 (doi:10.1086/597378) [DOI] [PubMed] [Google Scholar]
- 78.Foote M. 1994. Morphological disparity in Ordovician-Devonian crinoids and the early saturation of morphological space. Paleobiology 20, 320–344 [Google Scholar]
- 79.Harmon L. J., Schulte J. A., Larson A., Losos J. B. 2003. Tempo and mode of evolutionary radiation in iguanian lizards. Science 301, 961–964 10.1126/science.1084786 (doi:10.1126/science.1084786) [DOI] [PubMed] [Google Scholar]