

Abstract
The protein RpoS is responsible for mediating cell survival during the stationary phase by conferring cell resistance to various stressors and has been linked to biofilm formation. In this study, the role of the rpoS gene in Escherichia coli O157:H7 biofilm formation and survival in water was investigated. Confocal scanning laser microscopy of biofilms established on coverslips revealed a nutrient-dependent role of rpoS in biofilm formation, where the biofilm biomass volume of the rpoS mutant was 2.4- to 7.5-fold the size of its rpoS+ wild-type counterpart in minimal growth medium. The enhanced biofilm formation of the rpoS mutant did not, however, translate to increased survival in sterile double-distilled water (ddH2O), filter-sterilized lake water, or unfiltered lake water. The rpoS mutant had an overall reduction of 3.10 and 5.30 log10 in sterile ddH2O and filter-sterilized lake water, respectively, while only minor reductions of 0.53 and 0.61 log10 in viable counts were observed for the wild-type form in the two media over a 13-day period, respectively. However, the survival rates of the detached biofilm-derived rpoS+ and rpoS mutant cells were comparable. Under the competitive stress conditions of unfiltered lake water, the advantage conferred by the presence of rpoS was lost, and both the wild-type and knockout forms displayed similar declines in viable counts. These results suggest that rpoS does have an influence on both biofilm formation and survival of E. coli O157:H7 and that the advantage conferred by rpoS is contingent on the environmental conditions.
INTRODUCTION
In aquatic environments, bacteria are often protected from their inconstant surroundings through the establishment of biofilms. Biofilms are complex communities of bacteria attached to the substratum and enclosed in an extracellular matrix (ECM) of exopolysaccharides and, to a lesser degree, proteins, nucleic acids, and other enmeshed substances (14, 16). This protective aggregation allows the bacteria to withstand challenges, such as antibiotics, biocides, phagocytosis, and desiccation, better than their planktonic counterparts (13, 17, 31, 37, 39, 40, 42). Given the enhanced survival of biofilm cells, the biofilm state is often recognized as the preferred state of existence for bacteria under many environmental conditions (26, 29, 61).
The increased resistance of biofilm cells to various assaults has been attributed to five potential interacting factors: the inhibited penetration of the biofilm, decreased metabolism due to nutrient deprivation in the biofilm interior, a heterogeneous display of phenotypes induced by variable conditions throughout the biofilm, the production of persister cells, and cross-protection through the activity of a general stress response mechanism (36, 49, 50). One gene that is often implicated in biofilm formation and is responsible for mediating gene expression during periods of stress, starvation, and stationary-phase growth is rpoS, the stationary-phase sigma factor gene (32, 34, 35, 38). RpoS (σs), the gene product of rpoS, mediates the binding of RNA polymerase to the promoter of rpoS-dependent genes, thereby facilitating their transcription (33, 34, 35). RpoS is reportedly responsible for the regulation of approximately 10% of the Escherichia coli genome, with over 140 genes upregulated by RpoS during periods of stress or stationary-phase growth (56).
Given the high cell density of biofilms and the corresponding potential for stress due to low oxygen and nutrient deprivation (44), it is not surprising that rpoS and numerous rpoS-dependent genes have been reported as differentially expressed between the planktonic and biofilm states (4, 20, 46, 48). Additionally, a number of studies have found rpoS to impact biofilm formation by E. coli K-12 under various conditions (1, 12, 30, 48). While these studies have highlighted the importance of rpoS in biofilm formation, their findings have lacked uniformity.
Little is known about the role of RpoS in the formation of biofilms by E. coli O157:H7. Even studies that broadly investigated differential gene expression between planktonic and biofilm states in pathogenic E. coli have been limited. A proteomic study by Trémoulet et al. (51) of a nonpathogenic E. coli O157:H7 derivative revealed differential protein expression between planktonic and biofilm cells. Of the 17 proteins with increased expression in biofilm cells, those with known functions could be roughly categorized as proteins responsible for general metabolism (including an enzyme from the tricarboxylic acid [TCA] cycle), transportation, or DNA binding (51). Interestingly, one of the periplasmic binding proteins was speculated to be responsible for the transport of amino acids, and one of the DNA binding proteins is known to protect nonspecific DNA from oxidative damage. These findings are indicative of a change in the global gene regulation of E. coli O157:H7 from the planktonic to the biofilm state and are not incongruent with the potential for σs involvement—a notion requiring further pursuit.
A persistent paradox of rpoS studies has been that under certain starvation conditions, mutations in the rpoS gene can actually confer an advantage. Numerous rpoS mutants have demonstrated increased fitness and survival over wild-type strains in planktonic cultures incubated for a prolonged period after stationary-phase growth has been achieved (23, 25, 58, 59, 60). The fitness advantage of these rpoS mutants may be provided by an increased capacity to scavenge for amino acids, which are utilized by the TCA cycle as sources of energy (25). In fact, E. coli strains with reversible rpoS mutations can employ succinate, a TCA cycle intermediate, as the sole source of carbon, whereas wild-type E. coli strains do not have the same capability (9, 10). Therefore, mutations in rpoS may be selected for studies under low-nutrient conditions, thus allowing the surviving cells to more efficiently capture and utilize the amino acids and other nutrients released by dead cells.
The survival advantage conferred to rpoS mutants in long-term stationary-phase growth and the resistance of biofilm cells to a variety of stressors implicate both rpoS and biofilm formation in the survival of pathogenic E. coli under conditions of nutrient starvation. Of concern is the survival of pathogenic E. coli for extended periods of time under the comparatively nutrient-deprived conditions of untreated well water, bottled water, municipal drinking water, natural water bodies, and water distribution systems (24, 52, 53, 54). As such, further investigation into the role of rpoS in the survival of E. coli O157:H7 biofilm cells in both natural and treated water samples is required.
This study evaluated the biofilm-forming capabilities of wild-type and rpoS knockout strains of E. coli O157:H7 under different culture conditions in an effort to elucidate the role of rpoS in E. coli O157:H7 biofilm formation and to help reconcile the differences in the current literature. Additionally, the role of rpoS in the survival of established E. coli O157:H7 biofilm cells in both filter-sterilized and unfiltered lake water samples was investigated.
MATERIALS AND METHODS
Bacterial strains and culture conditions.
The bacterial strains used in this study are summarized in Table 1. The E. coli O157:H7 H32 strain we employed was obtained from C. Gyles at the University of Guelph (Guelph, ON, Canada) and corresponds to the strain identification number EC920004 from this culture collection. H32 is a bovine isolate and possesses genes for Shiga-like toxins I and II (55). It also contains the eae gene for intimin, the virulence factor responsible for mediating the attachment of E. coli to colonic epithelial cells (22, 28). The stock cultures for all strains were prepared in tryptic soy broth (TSB) (BD Difco, Mississauga, ON, Canada) supplemented with 25% (vol/vol) glycerol and maintained at −80°C (55). All strains were recovered overnight at 37°C on tryptic soy agar (TSA) with the exception of the strains bearing plasmid pKD46, which were recovered at 30°C. Following recovery, the strains were subcultured in antibiotic selective medium overnight prior to the preparation of cells for experimentation. Antibiotics were added as required for the maintenance of plasmids or selection of chromosomally labeled strains at concentrations of 100 μg ampicillin, 20 μg gentamicin, and/or 50 μg kanamycin per ml of medium. For all molecular manipulations, E. coli strains were routinely cultured in Luria-Bertani Miller broth (LB) (BD Difco) at 37°C.
Table 1.
Characteristics of bacterial strains and plasmids used in this study
| Strain or plasmid | Characteristics | Source or reference |
|---|---|---|
| Strains | ||
| Escherichia coli O157:H7 | ||
| H32 | Wild-type bovine isolate | 28, 54 |
| H32-gfp | Labeled with aph(3′)I and gfp through random Tn5 insertion; KANra | This study |
| H32-gfpΔrpoS::gm | Labeled with aph(3′)I and gfp, rpoS disrupted with accC1; KANr Gmrb | This study |
| E. coli JM109 | Cloning host | Promega |
| Plasmids | ||
| pJBA29 | gfp and aph(3′) (〈gfp-kan〉 cassette) template vector; KANr Amprc | 2 |
| pMOD-2〈MCS〉 | Construction vector; Ampr (bla) | Epicentre Biotechnologies |
| pMOD〈gfp-kan〉 | Source of EZTn5〈gfp-kan〉 transposon, template for 〈gfp-kan〉 cassette; KANr Ampr | This study |
| pKD46 | λ Red recombinase system (ParaB-gam-bet-exo), temp-sensitive [oriR101 repA101(Ts)]; Ampr (bla) | E. coli Genetic Stock Center, New Haven, CT; 15 |
| pGEM T-Easy | Cloning host, lacZ insertion site; Ampr (bla) | Promega |
| pGEM-rpoS | Construction vector rpoS-flanked linear DNA fragments; Ampr | This study |
| p34S-Gm | Template for accC1; Gmr | 18 |
| pGEMΔrpoS::gm | Source of ΔrpoS::gm cassette for disruption of rpoS; Ampr Gmr | This study |
KANr, kanamycin resistance.
Gmr, gentamicin resistance.
Ampr, ampicillin resistance.
gfp labeling of strain H32.
The H32 strain was labeled with a gfp-aph(3′)I (gfp-kan) cassette, excised from the pJBA29 plasmid, using the EZ-Tn5 pMOD〈MCS〉 construction vector (Epicentre Biotechnologies, Madison, WI). The gfp-kan cassette was excised from the pJBA29 plasmid using KpnI digestion (Promega, Madison, WI) and ligated to the EZ-Tn5 pMOD vector to produce the pMOD-EZTn5〈gfp-kan〉 plasmid containing the EZTn5〈gfp-kan〉 transposon. The pMOD-EZTn5〈gfp-kan〉 plasmid was then electroporated into E. coli strain JM109 using an optimized standard protocol (47) and extracted using a Promega Wizard Plus SV minipreps DNA purification system.
The EZTn5〈gfp-kan〉 transposon cassette was liberated from the pMOD-EZTn5〈gfp-kan〉 plasmid through PshA1 digestion (NEB, Ipswich, MA) and gel purified. The transposase reaction mixture was prepared with slight modifications to the recommended protocol (Epicentre Biotechnologies), namely, reducing the amount of enzyme solution in an effort to prevent arching. Electroporation was used to introduce the transposon cassette to strain H32, thus facilitating transposition. Screening on an LB plate with ampicillin (LBA plate) supplemented with both ampicillin and kanamycin was used in conjunction with the isolation of colonies displaying green fluorescence. Successful transposition was confirmed and identification of the insertion site was performed through genomic sequencing (MOBIX Lab, Hamilton, ON, Canada) using the primers SqFP (5′-GCCAACGACTACGCACTAGCCAAC) and SqRP (5′-GAGCCAATATGCGAGAACACCCGAGAA) oriented outward from the multiple cloning site (Epicentre Biotechnologies, Madison, WI).
Construction of an rpoS-deficient strain by lambda Red recombination.
Lambda Red recombination was employed to generate an rpoS-deficient strain of gfp-labeled H32, using a method modified from the original protocol described by Datsenko and Wanner (15). The linear fragment rpoS::gm served as the substrate for homologous recombination and the simultaneous gene disruption in H32-gfp. The cassette was constructed to bear approximately 500 bp of rpoS sequences flanking a gentamicin resistance determinant (accC1) using the pGEM T-Easy cloning vector (Promega). The target rpoS region was amplified from the H32 chromosome using a 50-μl PCR mixture containing 20 to 100 ng of extracted H32 genomic DNA, 0.2 μM each rpoS-F (5′-TTATGAGTCAGAATACGCTGAAAG) and rpoS-R primer (5′-TTACTCGCGGAACAGCGCCTTCG), 1 unit of Taq DNA polymerase, and other PCR components as described by the manufacturer (Fermentas, Burlington, ON, Canada). The PCR consisted of 35 cycles of denaturation for 1 min at 94°C, annealing for 1 min at 55°C, and extension for 1 min at 72°C and a final extension for 10 min at 72°C (PCR Sprint thermal cycler; Thermo Fisher Scientific). The amplified 993-bp rpoS gene was ligated with the pGEM T-easy vector and inserted with accC1, a gentamicin resistance gene at a site 549 bp downstream of the start codon. The insertion of accC1 into rpoS was facilitated through digestion with Eco721, generating the plasmid pGEMrpoS::gm. The plasmid was subsequently chemically transformed into strain JM109 using a TransformAid bacterial transformation kit (Fermentas). Successful insertion of rpoS was confirmed through digestion of the construct with EcoRI, as well as through sequencing from the pGEM T-Easy multiple-cloning site using the universal primers SP6 and T7.
H32-gfp was transformed with the pKD46 plasmid using electroporation, producing the recombination-proficient strain H32-gfp/pKD46. Overnight cultures of H32-gfp/pKD46 were used to inoculate 30 ml of LB Amp50 to an optical density at 600 nm (OD600) of 0.1 and incubated at 30°C until an OD600 of 0.4 to 0.6 was achieved with 10 mM l-arabinose for induction of the recombinase system. Ten-milliliter portions of the cell culture were harvested and washed once in ice-cold sterile double-distilled water (ddH2O) and thrice in 10% glycerol. Following the last wash, cells were resuspended in 50 μl 10% glycerol and mixed with 100 ng to 1 μg of the linear rpoS::gm fragment. After 1 min of incubation on ice, electroporation was performed using an Eppendorf electroporator 2510 and 100-μl cuvettes with a 1-mm gap per the manufacturer's instructions (Eppendorf, Mississauga, ON, Canada). The cells were recovered in 1 ml of 2× LB at 37°C for 1.5 h. The transformants were selected for on LBA plates supplemented with gentamicin (10 μg/ml) and kanamycin (25 μg/ml) and screened through colony PCR using the primers MidrpoS-F (5′-CCGTTATGGCAATCGTGGTCT) and MidrpoS-R (5′-TGACGTCATCAACTGGCTTATCC). Successful transformation was confirmed by using the primers FullrpoS-F (5′-GTTATTTGCCGCAGCGAT) and FullrpoS-R (5′-GCTTGAGACTGGCCTTTCTG) to amplify the rpoS target region.
Comparative growth curves.
Growth curves were performed for H32, H32-gfp, and H32-gfpΔrpoS::gm in LB and minimal salts medium supplemented with 0.04% (wt/vol) glucose (MSMG) [7 g KH2PO4, 3 g K2HPO4, 1 g (NH4)2SO4, 0.1 g MgSO4, 1 mg yeast extract, and 0.04% (wt/vol) filter-sterilized glucose per liter of ddH2O] (8). The overnight cultures were prepared in 50 ml of LB for each strain, supplemented with the appropriate antibiotic. The aforementioned cultures were used to inoculate 200 ml of LB and MSMG for each strain, without antibiotics, to an OD600 of 0.05. At various time points, 1 ml of each culture was removed and used to prepare a dilution series in sterile phosphate-buffered saline (PBS) (8 g NaCl, 0.2 g KCl, 1.44 g Na2HPO4, 0.24 g KH2PO4, all per liter of ddH2O). Drop plates were prepared from the dilution series, and the CFU per ml were calculated for each time point after 10 to 12 h of growth at 37°C.
Preparation of glass coverslips.
Biofilms were developed on 22- by 22-mm glass coverslips (Fisher Scientific Canada). The coverslips were prepared through a 15-min immersion in 70% nitric acid, three subsequent washes in sterile ddH2O, and a final rinse in absolute methanol. A thin line of silicone sealer (Elmer's, Columbus, OH) was applied to one side of each coverslip (i.e., underside of the coverslip), marking the orientation and promoting easy manipulation. The coverslips were cured for 24 h at room temperature before being autoclaved at 121°C for 15 min.
Selection of conditions enhancing biofilm formation.
Two different media, TSB and MSMG, were tested for optimal biofilm growth for H32, H32-gfp, and H32-gfpΔrpoS::gm. The prepared coverslips were placed, silicone side down, in extra-deep petri dishes (100 mm by 20 mm; Fisher Scientific Canada) filled with 30 ml of the appropriate medium without antibiotics. Three petri dish apparatuses were prepared per strain, per medium, per time point. The apparatuses were each inoculated with 200 μl of an overnight culture previously diluted to an OD600 of 0.5 and placed in a large bin lined with moist sterile paper towels to prevent evaporation. The samples were incubated with 25-rpm shaking at 37°C to mirror physiological conditions. Every 24 h, the spent medium was removed gently by aspiration and replaced with fresh medium. Sampling and phobia laser scanning image processor (PHLIP) (57) analysis of biofilm formation were conducted as described below at 24, 48, and 72 h. The experiment was repeated in MSMG at 22°C to mimic environmental conditions.
Analysis of biofilm formation.
For sampling, coverslips were removed from the petri dish systems and flooded with 200 μl of SYTO 9 green fluorescent nucleic acid stain (17.6 μM) (Molecular Probes, Eugene, OR) for 5 min. All three strains were stained to ensure comparable levels of fluorescence. Unadhered cells and excess dye were removed by submerging the coverslips once in sterile ddH2O. The coverslips were placed, silicone side up, over a depression slide filled with sterile ddH2O and sealed with nail polish. The slide was prepared for microscopy by swabbing the silicone side of the coverslip with 10% sodium hypochlorite, ddH2O, 85% ethanol, and ddH2O, in succession.
The biofilm cells were visualized on an Olympus Fluoview FV300 confocal scanning laser microscope using an ×60 Plan Apo 1.4 numerical-aperture oil immersion objective lens and a 10-mW 488-nm argon laser (Olympus, Tokyo, Japan). The detection of SYTO 9 fluorescence was performed using a band pass emission from 510 to 530 nm (DM570 dichroic mirror, FVX-BA 510–530 filter set; Olympus). Each image stack (Z-stack) was analyzed for biofilm biovolume using a phobia laser imaging processor run through the MatLab 7.0.4 platform (MatLab, Natick, MA). Biovolume is defined as volume of biomass per unit substratum area (μm3/mm2). Representative Z-stacks were compiled into single images using ImagePro (Media Cybernetics, Silver Spring, MD).
Survival of biofilm cells in lake water samples.
The survival of biofilm cells was assessed in sterile ddH2O, filter-sterilized lake water, and unfiltered lake water. Lake water samples were obtained in early spring from Boulevard Lake (48°27′30″N, 89°11′41″W), a man-made lake formed by the damming of the lower Current River (Thunder Bay, ON, Canada). However, the water temperature of Boulevard Lake is normally between 15 and 25°C during the summer months. Water was collected in sterile 500-ml Nalgene bottles at a depth of 15 to 30 cm, 1.5 m from shore. The Nalgene bottles were held beneath the surface, uncapped and inverted to fill, and recapped underwater. The samples were transported on ice and stored at 4°C until required for use. Filter-sterilized lake water was obtained by performing vacuum filtration on the collected lake water samples using a sterile 0.45-μm-pore-size mixed cellulose ester filter, followed by syringe filtration through a sterile nylon 0.22-μm-pore-size filter (Fisher Scientific Canada, Ottawa, ON). Filter-sterilized lake water was used immediately following filtration. The chemical and biochemical properties of the unfiltered lake water were analyzed by the Lakehead University Centre for Analytical Service (LUCAS) and are reported as follows (in mg/liter): 4.0 dissolved organic carbon, 0.6 K, 3.41 Mg, 4.04 Na, 13.71 Ca, 6.12 Cl−, 0.284 NO3−, 0.299 Al, 0.013 Ba, 0.005 Cu, 0.562 Fe, 0.0109 Mn, 1.77 S, 0.027 SO42−, 0.005 Sr, and 6.60 Zn. The levels of As, Be, Cd, Cr, Ni, NO2−, Pb, and PO43−-P were below the detection limits (<0.005 mg/liter, with the exception of PO43−-P, which had a detection limit of 0.025 mg/liter). The water pH and temperature were 7.5 and 7.8°C, respectively, at the time of collection.
The survival of H32-gfp and H32-gfpΔrpoS::gm biofilm cells was observed in sterile ddH2O, filter-sterilized lake water, and unfiltered lake water. The biofilms were cultivated as described above in MSMG at 22°C for 48 h, in 6-well flat-bottom cell culture plates (Corning, Lowell, MA) containing 5 ml of medium. The spent media were exchanged with fresh media after 24 h. Following 48 h of growth, three coverslips for each strain were retained for the initial biofilm cell counts (day 0). The coverslips were removed from the remaining wells, rinsed once by gentle submersion in sterile ddH2O, and placed in new wells containing 5 ml of sterile ddH2O or filter-sterilized or unfiltered lake water. The liquid media were not removed from the wells following the initial transfers from the MSMG. Enumeration was performed as described below on days 3, 6, and 13. Representative images were obtained as described previously, with the addition of images obtained without staining, with SYTO 9 staining (as described), and with Live/Dead BacLight staining (Live/Dead BacLight bacterial viability kit; Invitrogen, Burlington, ON, Canada). When Live/Dead staining was applied, a solution containing 6.68 μM SYTO 9 and 80 μM propidium iodide was prepared in sterile ddH2O. The slides were flooded with 200 μl of the combined Live/Dead stain for 5 min and prepared for visualization as described for the SYTO 9 staining.
Plate counting of attached and detached biofilm cells.
Attached biofilm cell counts were performed by rinsing each coverslip once by gentle immersion in sterile ddH2O and propping the silicone side down on the wall of a sterile petri dish. Removal of the biofilm cells was facilitated by forcefully pipetting 1 ml of sterile PBS against the coverslip 20 times, each time collecting PBS from the base of the coverslip. A sterile cotton applicator (Fisher Scientific Canada) was used to scrub the sampling area 15 times in a horizontal direction, followed by 15 times in a vertical direction, into the PBS at the base of the coverslip. The cotton tip was then excised from the shaft and deposited in 4 ml PBS. The swabbing procedure was repeated two additional times, collecting the 1 ml of PBS between the 1st and 2nd swab and adding it to the 4 ml of PBS. The tube containing 5 ml PBS and three cotton tips was then vortexed vigorously for 1 min, and 1 ml PBS was removed to prepare a dilution series. Enumeration of the detached biofilm cells was performed by removing 1 ml of medium from the wells for a dilution series from the culture plate well prior to removal of the coverslip. Viable cell counts were conducted on both the attached and the detached samples by drop plating six 5-μl drops of each dilution onto a quadrant of TSA supplemented with the appropriate antibiotic.
Statistical analysis.
All experiments were performed in triplicate. Where PHLIP assessment of biofilm formation was conducted, four independent image stacks per strain per experiment were used in the analyses. The normalized data were analyzed in SigmaStat (SPSS Inc., Chicago, IL) using two-way analyses of variance (ANOVAs) and post hoc Tukey tests and were subsequently graphed in SigmaPlot (SPSS Inc., Chicago, IL).
RESULTS
Production of H32-gfp and H32-gfpΔrpoS::gm.
Successful transposition of H32 with 〈gfp-kan〉 producing the fluorescently labeled strain H32-gfp was tentatively established through the isolation of kanamycin-resistant colonies exhibiting green fluorescence under UV transillumination. The insertion of 〈gfp-kan〉 in the H32 genome was confirmed through DNA sequencing using the primers SqFP and SqRP, oriented outward from 〈gfp-kan〉. BLAST results of the sequences (about 640 bases) generated by both primers revealed sequences similar to a putative E. coli regulatory protein, with 97% and 93% DNA sequence identities for the SqFP and SqRP sequence results, respectively. The lack of complete sequence similarity can be attributed to miscalled bases in the genomic sequencing reaction and the genomic differences between H32 and the E. coli strains in the GenBank database. The function of the regulatory protein is unknown or inferred in all BLAST sequence results except in E. coli O157:H7 strain EC4115 (accession no. CP001164), where it is tentatively identified through protein homology as UhpC, a nonessential regulatory protein involved in sugar phosphate transport (accession no. NC_011353.1[445971 to 447275, complement]). The API 20E test results revealed that H32 and H32-gfp have identical profiles and that E. coli is a very good identification (identification ≥ 99%) for these strains (profile no. 5144132). The API 20E results confirm that H32-gfp represents an E. coli strain that is indistinguishable from H32 in terms of fundamental biochemical activities. The stability of the 〈gfp-kan〉 label was confirmed through the observation of uninhibited growth by H32-gfp on TSA supplemented with 50 μg/ml kanamycin, relative to TSA, following 6 transfers on nonselective media. Additionally, H32-gfp fluoresced equally under UV illumination over the 6-day transfer period.
H32-gfp was used as the target for rpoS disruption, resulting in the production of a gfp-labeled rpoS strain of E. coli, H32-gfpΔrpoS::gm. The use of fluorescently labeled wild-type and rpoS mutant strains allowed for the differentiation of E. coli from background bacteria in subsequent survival experiments in lake water samples. The H32-gfpΔrpoS::gm strain was generated through lambda Red recombination and confirmed through PCR. The amplification of a 1,953-bp product using the primers FullrpoS-F and FullrpoS-R on the H32-gfpΔrpoS::gm insertion mutant showed the disruption of rpoS by the 848-bp gentamicin resistance determinant, whereas PCR on wild-type rpoS yielded the expected 1,106-bp amplicon. DNA sequencing of the 1,953-bp fragment revealed an insertion of the gentamicin resistance gene (accC1) in rpoS.
Comparative growth curves.
The planktonic growth curves for E. coli O157:H7 strains H32, H32-gfp, and H32-gfpΔrpoS::gm are shown in Fig. 1. Growth curves were generated at 37°C in both LB and MSMG. As expected, there was a statistically significant increase in cell density (CFU/ml) over time for all strains in both media (P < 0.001), as both curves exhibit the typical stages of exponential- and stationary-phase growth. All three strains exhibited slower growth in minimal media than in rich media, as stationary phase was reached after 6 h for all strains in LB but not until 10 h in MSMG. The viable cell counts for all strains were approximately 1 log CFU/ml higher in rich media than in minimal media.
Fig 1.
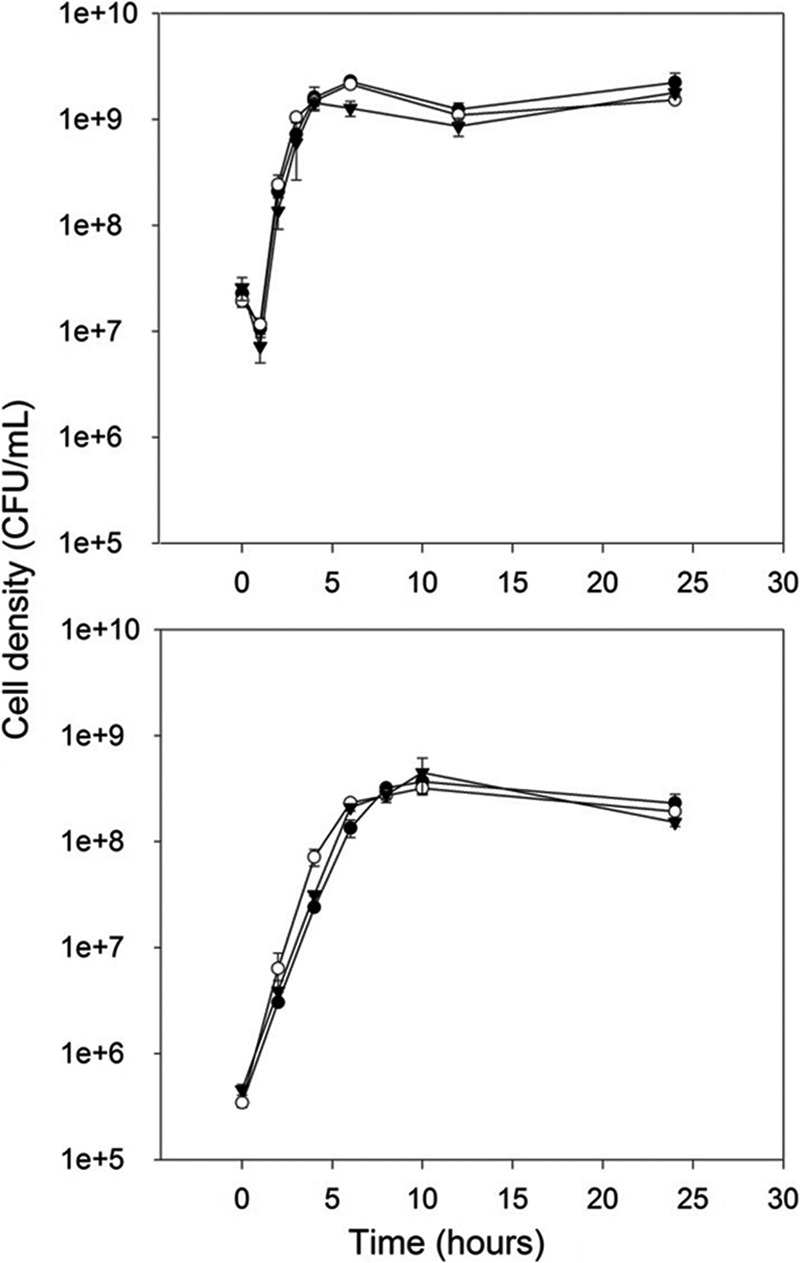
Planktonic growth of E. coli O157:H7 strains H32 (●), H32-gfp (○), and H32-gfpΔrpoS::gm (▼) in a rich medium (LB) (top graph) and a minimal medium (MSMG) (bottom graph) at 37°C over 24 h. Bars indicate standard deviations at a 95% confidence level.
In the LB medium, the growth curves of the two rpoS+ strains were not significantly different from each other (P = 0.928). When the growth curve of the rpoS mutant was compared to those of the rpoS+ strains, the density of the rpoS mutant was significantly lower than that of the H32 (P = 0.002) and H32-gfp (P = 0.004) strains at only 6 h, the entry point to stationary phase. The cell densities of the rpoS mutant, H32, and H32-gfp at 6 h were 1.27 × 10⁹ ± 0.21 × 10⁹, 2.27 × 10⁹ ± 0.21 × 10⁹, and 2.14 × 10⁹ ± 0.08 × 10⁹ CFU/ml, respectively. No significant differences in growth were revealed between any of the strains in MSMG (P = 0.898). The gfp labeling did not have an apparent influence on the planktonic growth of H32-gfp relative to H32 in either media.
Biofilm formation of the E. coli strains.
The qualitative visualization of H32, H32-gfp, and H32-gfpΔrpoS::gm biofilms using confocal scanning light microscopy (CSLM) after 24 h revealed that the development of biofilms for the three H32 strains was growth medium dependent (Fig. 2). In observing H32, H32-gfp, and H32-gfpΔrpoS::gm in TSB, most fields of view under CSLM contained sparse single cells or pairs of adhered cells. In MSMG (at both 22°C and 37°C), H32 and H32-gfp demonstrated small clusters of cells and larger aggregations of cells (microcolonies) interspersed with single cells and noncolonized areas. In contrast, H32-gfpΔrpoS::gm exhibited an extremely dense uniform mat of cells that appeared to be 2 to 3 layers of cells deep. Given the enhanced biofilm growth of all three strains in MSMG, this medium was selected to promote optimal biofilm formation. In addition, 22°C was chosen for all subsequent experiments to mimic environmental conditions.
Fig 2.
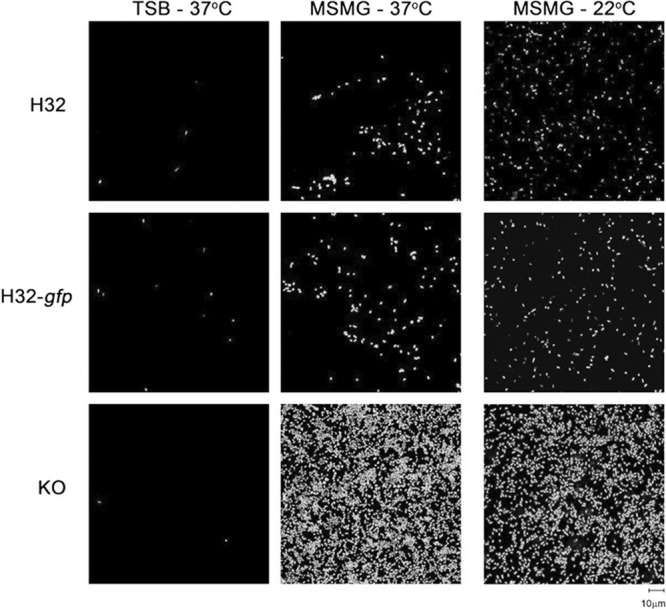
Representative CSLM images of biofilm cells of E. coli O157:H7 strains H32, H32-gfp, and H32-gfpΔrpoS::gm (KO) after 24 h of growth in TSB or MSMG. The biofilms were cultivated in TSB at 37°C (left column), MSMG at 37°C (middle column), and MSMG at 22°C (right column). All three E. coli strains were stained with SYTO 9 and visualized with a 60× objective lens.
Biofilm growth in MSMG, sampled at 24, 48, and 72 h and analyzed using PHLIP, confirmed that the rpoS knockout produces biofilms of greater biovolume than both of the rpoS+ strains at 24 and 48 h (P < 0.001) (Fig. 3). At 72 h, the biovolume of the rpoS mutant was 2.4-fold and 2.7-fold the size of the H32-gfp (P = 0.07) and H32 (P = 0.01) strains, respectively. The maximal biofilm biovolume occurred after 48 h for H32-gfpΔrpoS::gm and was enhanced approximately 7.5-fold relative to either of rpoS+ H32 or H32-gfp strain (P < 0.001). H32-gfp displayed a slight increase in biofilm formation at 72 h compared to 48 h, and H32 exhibited comparable biofilm formation (from 5.3 × 10³ to 7.4 × 103 μm3/mm2) on all 3 days. Overall, H32 and H32-gfp formed biofilms with similar biovolumes, suggesting that the labeling procedure did not impact the biofilm-forming capabilities of H32-gfp.
Fig 3.
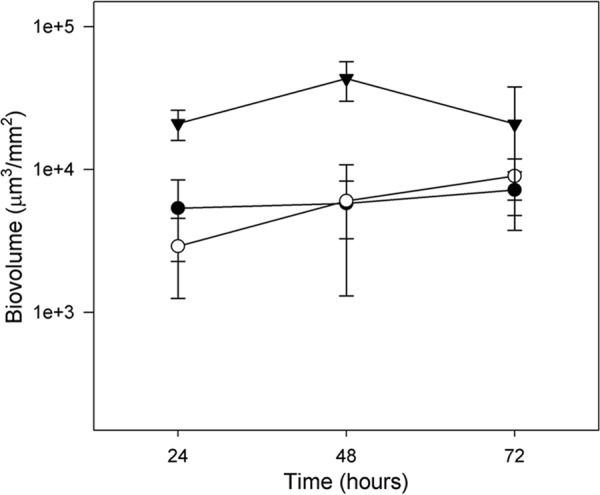
Biofilm development of E. coli O157:H7 strain H32 (●), H32-gfp (○), and H32-gfpΔrpoS::gm (▼) in MSMG at 22°C. All three E. coli strains were stained with SYTO 9. Bars indicate standard deviations at a 95% confidence level.
Survival of attached and detached biofilm cells in water samples.
The total numbers of culturable H32-gfp biofilm cells, including both attached and detached biofilm cells, were significantly higher than that of the H32-gfpΔrpoS::gm strain at the end of the 13-day period, with P values of 0.021, <0.001, and 0.019 in sterile distilled water, filter-sterilized lake water, and unfiltered lake water, respectively (Fig. 4).
Fig 4.

Survival of 48-h-old E. coli O157:H7 strain H32-gfp (○) and H32-gfpΔrpoS::gm (▼) biofilm cells exposed to sterile distilled water, filter-sterilized lake water, and unfiltered lake water at 22°C. Day 0 represents the time when the biofilms were first exposed to various water samples. The column on the left represents the total numbers of biofilm cells, including both attached and detached biofilm cells. The middle and right columns represent the cell densities of attached and detached biofilm cells, respectively. Bars indicate standard deviations at a 95% confidence level.
Quantification of the attached cells alone (using the plate counting method) showed greater overall survival of H32-gfp than of H32-gfpΔrpoS::gm in sterile ddH2O (P < 0.001), filter-sterilized lake water (P < 0.001), and unfiltered lake water (P = 0.019). The rpoS mutant displayed markedly reduced culturable cell numbers relative to H32-gfp at all time points other than at day 0 (P < 0.001). The rpoS mutant had an overall reduction of 3.10 and 5.30 log10 in sterile ddH2O and filter-sterilized lake water, respectively, whereas H32-gfp maintained its survival over time. In unfiltered lake water, the numbers of attached cells recovered from biofilms of both the rpoS mutant and rpoS+ strains decreased significantly between days 0 and 13 (P < 0.001), but the rpoS+ strain still held a survival advantage over the rpoS mutant at 13 days, with a P value of 0.007 (Fig. 4).
Plate counting of the detached biofilm cells in the sterile ddH2O and filter-sterilized lake water showed minor decreases (about 1 log10 reduction) for both the rpoS mutant and rpoS+ strains between days 3 and 13. In addition, the declining rates of H32-gfp and H32-gfpΔrpoS::gm were also similar (Fig. 4). In the untreated lake water samples, the culturable cell density of H32-gfp was about 2 log10 higher than that of H32-gfpΔrpoS::gm on day 3. However, the H32-gfp cell density dropped sharply from 7.29 to 4.43 log10 CFU/ml between days 3 and 6 and further decreased to 3.67 log10 CFU/ml on day 13. For the rpoS mutant, it decreased steadily from 5.26 to 2.93 log10 CFU/ml between days 3 and 13.
Visualization of E. coli biofilm cells in water samples.
Qualitative visualizations of the H32-gfp (Fig. 5A) and H32-gfpΔrpoS::gm (Fig. 5B) biofilms over a 13-day period were performed in sterile distilled water, filter-sterilized lake water, and unfiltered lake water. Multiple techniques were employed to visualize the O157:H7 cells and/or the background cells, including just the green-fluorescing E. coli cells (no stain [NS]), the total number of cells including background (SYTO 9 stain [S9]), and the total cell viability (Live/Dead stain [LD]).
Fig 5.
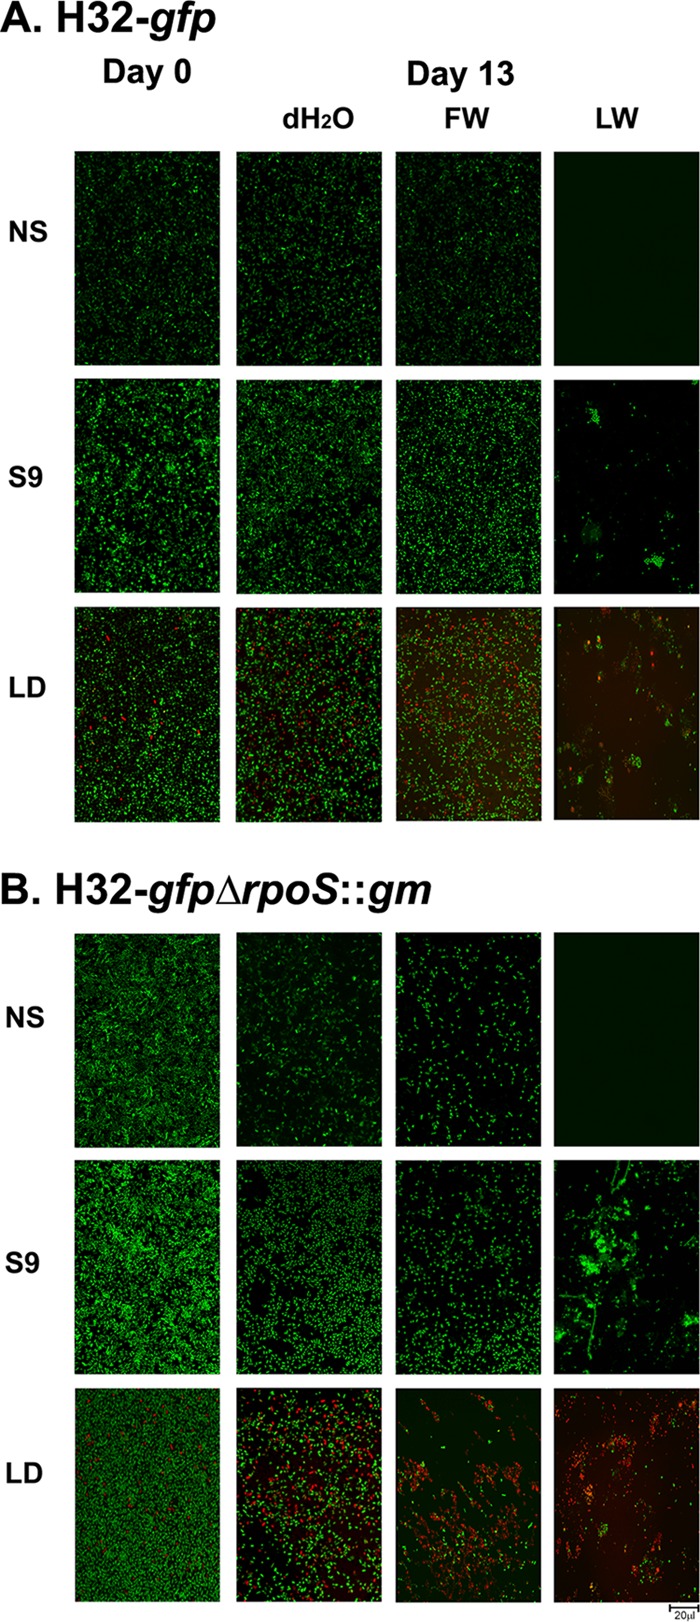
CSLM images of H32-gfp (A) and H32-gfpΔrpoS::gm (B) biofilms in sterile distilled water (ddH2O), filter-sterilized lake water (FW), and unfiltered lake water (LW). Day 0 represents the time when E. coli O157:H7 biofilms that were established over 48 h were first exposed to various water samples, whereas day 13 represents the exposure of the biofilm cells to the water samples for 13 days. No stain (NS) represents E. coli cells expressing green fluorescence from green fluorescent protein (GFP) only. SYTO 9 (S9) shows all adhered cells, including background organisms. Live/Dead staining (LD) illustrates the viability of all adhered cells, with green and red representing viable and nonviable cells, respectively.
For H32-gfpΔrpoS::gm, substantial reductions in green-fluorescing biofilm cells (NS, native fluorescence only) were observed in both the distilled water and the filter-sterilized lake water after 13 days of incubation (Fig. 5B), whereas the biofilm cell densities of H32-gfp in the sterile ddH2O and the filter-sterilized lake water samples remained similar over the 13-day period (Fig. 5A). This indicated that more H32-gfpΔrpoS::gm biofilm cells had lost their viability (i.e., lost viability and hence the green fluorescence protein) in the water samples compared with the H32-gfp biofilm cells.
When compared to results from day 0, notable reductions of the SYTO 9-stained H32-gfpΔrpoS::gm biofilms were observed in both the distilled water and the filter-sterilized lake water samples on day 13. Because SYTO 9 is a DNA dye, it stains all the cells (including live, unculturable, and dead cells with partly degraded DNA) in a biofilm structure. Therefore, the reduction of the SYTO 9-stained H32-gfpΔrpoS::gm biofilm cells indicates that some rpoS mutant biofilm cells were released into the aqueous phase of the water samples. Furthermore, a comparison between the SYTO 9 staining and native fluorescence of the rpoS mutant H32 biofilm cells shows that there were more SYTO 9-stained cells than native fluorescent cells in both the sterile ddH2O and the filter-sterilized lake water samples, implying that some rpoS mutant H32-gfp cells lost their fluorescence (i.e., death or loss of metabolic functions) in the biofilm matrix. However, this reduction of biofilm cells was not observed for the rpoS+ H32-gfp strain when treated under the same conditions as its rpoS+ counterpart. With the Live/Dead stain, a higher number of H32-gfpΔrpoS::gm biofilm cells appeared dead, stressed, or damaged (i.e., stained red) than the H32-gfp cells in both the sterile ddH2O and the filter-sterilized lake water samples.
In unfiltered lake water, most fields of view were devoid of cells exhibiting native green fluorescence (NS) for both the rpoS mutant and rpoS+ strains and displayed considerable cell damage or mortality (red) under LD staining. A heterogeneous microbial community was evident in the unfiltered lake water, as biofilms with complex architecture with various different cell morphologies were visible using SYTO 9 staining. Live/Dead staining revealed that by 13 days, this community was largely composed of dead, stressed, or damaged cells interspersed with small clusters of active intact cells.
DISCUSSION
The vast majority of E. coli biofilm studies have been conducted on the laboratory strain E. coli K-12 in rich media. The concerns with extrapolating the findings of K-12 biofilm studies to E. coli O157:H7 strains are well documented (7, 11, 19, 41, 43, 45). The biofilm-forming capabilities of E. coli O157:H7 strains H32, H32-gfp, and H32-gfpΔrpoS::gm were investigated in this study. In corroboration with previous findings, E. coli O157:H7 biofilm formation was found to be influenced strongly by the media employed in cultivation (19). All three E. coli O157:H7 strains exhibited enhanced biofilm formation under low-nutrient conditions (MSMG) and an inability to establish appreciable biofilms in a rich medium (TSB).
The reports of the relative biofilm-forming capabilities of the wild-type and rpoS-deficient E. coli K-12 strains have been conflicting. When E. coli K-12 biofilms were established in flow cell systems fed by a rich medium, a mutation in rpoS inhibited biofilm formation (1, 30, 48). In contrast, when biofilms were established in a rich batch culture medium in microtiter plates, a mutation in rpoS enhanced biofilm formation (12). With the use of an O157:H7 strain, this study suggests that these inconsistent results may be partly attributable to differences in experimental design, the growth media used, and whether the biofilm samples were analyzed at the growth or survival phase.
Here we report a 2.4- to 7.5-fold increase in biofilm biovolume by an rpoS-deficient strain of E. coli O157:H7, relative to the wild-type strains, when grown under batch culture conditions in minimal medium (MSMG) (Fig. 3). However, no increase in the attachment of the rpoS mutant on the glass coverslip, relative to the rpoS+ strains, was observed in the nutrient-rich TSB medium. These results suggest that while RpoS may not affect biofilm formation when nutrients are readily available (e.g., rich medium or flow cell systems), it reduces biofilm formation under nutrient-limited conditions (e.g., minimal medium). Our findings are consistent with those of Corona-Izquierdo et al. (12), where an rpoS mutation enhances biofilm formation under nutrient-limited batch culture conditions and that the rpoS regulon is differentially expressed in minimal and rich media (21). Together, these results suggest that the expression of the rpoS-controlled genes, and consequently of biofilm formation, is specific to nutrient availability. The exact role of rpoS in biofilm formation of E. coli O157:H7 under nutrient-limited conditions represents an area for further investigation.
Despite the fact that rpoS expression confers starvation-induced cross-protection against various stresses (38), numerous planktonic-state studies have reported a paradoxical advantage of rpoS mutations when under certain nutrient-limited conditions. When incubated for a prolonged period after the establishment of stationary-phase growth, rpoS-deficient E. coli strains have demonstrated increased fitness over wild-type strains (23, 25, 58, 59, 60). Conversely, under conditions of carbon starvation, the rpoS mutants have been shown to die off more rapidly than the wild-type strains during the late stationary phase (34). However, the role of rpoS in the survival of E. coli O157:H7 in biofilm has rarely been studied. This notion was further pursued in our investigation of the survival of biofilm cells for the rpoS+ and rpoS mutant E. coli O157:H7 strains in sterile distilled water, filter-sterilized lake water, and unfiltered lake water over a period of 13 days.
For both the attached and the total biofilm cells, the survival of the labeled wild-type (H32-gfp) strain was better in sterile distilled water and filter-sterilized lake water than in unfiltered lake water (Fig. 4). These findings are consistent with studies revealing that planktonic E. coli O157:H7 has better survival in autoclaved water and sterile filtered water than in untreated lake and well water (3, 52, 54). Predictably, decreased overall survival results from additive stress, where competition and predation from indigenous flora resulted in more significant reductions in E. coli O157:H7 than did the comparative nutrient deprivation in filter-sterilized lake water and both nutrient deprivation and osmotic stress in distilled water.
In contrast to the growth advantage conferred to rpoS mutants in the formation of biofilms in MSMG, rpoS deficiency was shown to reduce the survival of biofilm cells. Despite the substantial 3- to 5-log10 reduction in the culturability of the attached rpoS− strain in sterile distilled water and filter-sterilized lake water, the decrease of the detached biofilm cells was relatively mild (0.90 to 1.23 log10) compared to that of the attached cells, implying that the RpoS protein is more important for the survival of attached cells than their planktonic counterparts. Presumably, the rpoS mutant was less equipped to respond to the stresses of the environment, coupled with the inherent stresses inside a biofilm, such as a high cell density and low oxygen level (44). When differential Live/Dead staining was applied, the vast majority of the rpoS mutant cells exhibited uptake of the propidium iodide (red fluorescence), implying that these cells were either dead, stressed, or damaged. Notably, while the rpoS mutant exhibited decreased culturability of attached biofilm cells relative to the wild-type counterpart in all three water samples, the difference in survival between two strains was most pronounced in distilled water and filter-sterilized lake water but was not as notable in the unfiltered lake water samples (Fig. 4). These results suggest that while RpoS mitigates some of the stress imposed under various aquatic conditions, the advantage proffered by the general stress response is eventually overwhelmed when competition and predation pressures are introduced.
The decrease in the number of culturable cells, determined by plate counting, in the attached portion of the biofilm cells may be partly attributable to the loss of the biofilm cells into the aqueous phase. The substantial reduction of the attached rpoS mutant cells in the sterile ddH2O and filter-sterilized lake water relative to the rpoS+ cells (Fig. 5) indicates that a less stable biofilm was formed by the rpoS mutant H32 strain, despite a larger biofilm biomass being formed during the initial development phase. Therefore, this may explain why reports of the relative biofilm-forming capabilities of wild-type and rpoS-deficient E. coli K-12 strains have been conflicting in the literature. Depending on whether the final measurement is in the developmental or survival stage of the E. coli biofilm, the rpoS mutant may form larger or smaller biofilms than the rpoS+ strain.
The role of biofilms serving as a planktonic “cell factory” for both survival and proliferation, as proposed by Bester et al. (5, 6), coupled with the observation of a starvation-induced dispersal of Pseudomonas putida biofilms (27), has great implications for the dissemination of pathogenic E. coli in natural bodies of water and water distribution systems. The results of this study suggest a strong influence of nutrient availability on the role of rpoS in E. coli O157:H7 biofilm formation and survival, a finding that helps to reconcile inconsistencies found in the literature. Overall, E. coli O157:H7 exhibited a concerning propensity to form biofilms under low-nutrient conditions, similar to those found in natural environments, where rpoS disruption exaggerated this effect. Despite the establishment of smaller biofilms, the rpoS+ strain displayed enhanced survival in sterile distilled and treated lake water, likely through cross-protective mechanisms, before the effect was overwhelmed in untreated lake water. Altogether, this study suggests that the role of rpoS in E. coli O157:H7 biofilm formation and survival is governed not only by nutrient availability but also by other environmental stressors in water, such as competition and predation.
ACKNOWLEDGMENTS
This work was supported by funding from the National Science and Engineering Research Council of Canada. We acknowledge funding support from the Hong Kong Polytechnic University for W.-H. Chung's attachment with Lakehead University.
We also thank C. Gyles and S. Molin for providing us the O157:H7 strain and the pJBA29 plasmid, respectively.
Footnotes
Published ahead of print 21 September 2012
REFERENCES
- 1. Adams JL, McLean RJC. 1999. Impact of rpoS deletion on Escherichia coli biofilms. Appl. Environ. Microbiol. 65:4285–4287 [DOI] [PMC free article] [PubMed] [Google Scholar]
- 2. Andersen JB, et al. 1998. New unstable variants of green fluorescent protein for studies of transient gene expression in bacteria. Appl. Environ. Microbiol. 64:2240–2246 [DOI] [PMC free article] [PubMed] [Google Scholar]
- 3. Artz RR, Killham K. 2002. Survival of Escherichia coli O157:H7 in private drinking water wells: influences of protozoan grazing and elevated copper concentrations. FEMS Microbiol. Lett. 216:117–122 [DOI] [PubMed] [Google Scholar]
- 4. Beloin C, et al. 2004. Global impact of mature biofilm lifestyle on Escherichia coli K-12 gene expression. Mol. Microbiol. 51:659–674 [DOI] [PubMed] [Google Scholar]
- 5. Bester E, Edwards EA, Wolfaardt GM. 2009. Planktonic cell yield is linked to biofilm development. Can. J. Microbiol. 55:1195–1206 [DOI] [PubMed] [Google Scholar]
- 6. Bester E, Wolfaardt G, Joubert L, Garny K, Saftic S. 2005. Planktonic-cell yield of a pseudomonad biofilm. Appl. Environ. Microbiol. 71:7792–7798 [DOI] [PMC free article] [PubMed] [Google Scholar]
- 7. Bjergbæk LA, Haagensen JAJ, Reisner A, Molin S, Roslev P. 2006. Effect of oxygen and growth medium on in vitro biofilm formation by Escherichia coli. Biofilms 3:1–10 [Google Scholar]
- 8. Camper AK, McFeters GA, Characklis WG, Jones WL. 1991. Growth kinetics of coliform bacteria under conditions relevant to drinking water distribution systems. Appl. Environ. Microbiol. 57:2233–2239 [DOI] [PMC free article] [PubMed] [Google Scholar]
- 9. Chen G, Schellhorn HE. 2003. Controlled induction of the Rpos regulon in Escherichia coli, using an RpoS-expressing plasmid. Can. J. Microbiol. 49:733–740 [DOI] [PubMed] [Google Scholar]
- 10. Chen G, Patten CL, Schellhorn HE. 2004. Positive selection for loss of RpoS function in Escherichia coli. Mutat. Res. 554:193–203 [DOI] [PubMed] [Google Scholar]
- 11. Colón-González M, Méndez-Ortiz MM, Membrillo-Hernández J. 2004. Anaerobic growth does not support biofilm formation in Escherichia coli K-12. Res. Microbiol. 155:514–521 [DOI] [PubMed] [Google Scholar]
- 12. Corona-Izquierdo FP, Membrillo-Hernández J. 2002. A mutation in rpoS enhances biofilm formation in Escherichia coli during exponential phase of growth. FEMS Microbiol. Lett. 211:105–110 [DOI] [PubMed] [Google Scholar]
- 13. Costerton JW, et al. 1987. Bacterial biofilms in nature and disease. Annu. Rev. Microbiol. 41:435–464 [DOI] [PubMed] [Google Scholar]
- 14. Costerton JW, Lewandowski Z, Caldwell DE, Korber DR, Lappin-Scott HM. 1995. Microbial biofilms. Annu. Rev. Microbiol. 49:711–745 [DOI] [PubMed] [Google Scholar]
- 15. Datsenko KA, Wanner BL. 2000. One-step inactivation of chromosomal genes in Escherichia coli K-12 using PCR products. Proc. Natl. Acad. Sci. U. S. A. 97:6640–6645 [DOI] [PMC free article] [PubMed] [Google Scholar]
- 16. Davey ME, O'Toole GA. 2000. Microbial biofilms: from ecology to molecular genetics. Microbiol. Mol. Biol. Rev. 64:847–867 [DOI] [PMC free article] [PubMed] [Google Scholar]
- 17. De Beer D, Srinivasan R, Stewart PS. 1994. Direct measurement of chlorine penetration into biofilms during disinfection. Appl. Environ. Microbiol. 60:4339–4344 [DOI] [PMC free article] [PubMed] [Google Scholar]
- 18. Dennis JJ, Zylstra GJ. 1998. Plasposons: modular self-cloning minitransposon derivatives for rapid genetic analysis of gram-negative bacterial genomes. Appl. Environ. Microbiol. 64:2710–2715 [DOI] [PMC free article] [PubMed] [Google Scholar]
- 19. Dewanti R, Wong AC. 1995. Influence of culture conditions on biofilm formation by Escherichia coli O157:H7. Int. J. Food Microbiol. 26:147–164 [DOI] [PubMed] [Google Scholar]
- 20. Domka J, Lee J, Bansal T, Wood TK. 2007. Temporal gene-expression in Escherichia coli K-12 biofilms. Environ. Microbiol. 9:332–346 [DOI] [PubMed] [Google Scholar]
- 21. Dong T, Schellhorn HE. 2009. Control of RpoS in global gene expression of Escherichia coli in minimal media. Mol. Genet. Genomics 281:19–33 [DOI] [PubMed] [Google Scholar]
- 22. Donnenberg MS, et al. 1993. The role of the eae gene of enterohemorrhagic Escherichia coli in intimate attachment in vitro and in a porcine model. J. Clin. Invest. 92:1418–1424 [DOI] [PMC free article] [PubMed] [Google Scholar]
- 23. Farrell MJ, Finkel SE. 2003. The growth advantage in stationary-phase phenotype conferred by rpoS mutations is dependent on the pH and nutrient environment. J. Bacteriol. 185:7044–7052 [DOI] [PMC free article] [PubMed] [Google Scholar]
- 24. Fass S, Dincher ML, Reasoner DJ, Gatel D, Block J-C. 1996. Fate of Escherichia coli experimentally injected in a drinking water distribution pilot system. Water Res. 30:2215–2221 [Google Scholar]
- 25. Finkel SE, Kolter R. 1999. Evolution of microbial diversity during prolonged starvation. Proc. Natl. Acad. Sci. U. S. A. 96:4023–4027 [DOI] [PMC free article] [PubMed] [Google Scholar]
- 26. Geesey GG, Richardson WT, Yeomans HG, Irvin RT, Costerton JW. 1977. Microscopic examination of natural sessile bacterial populations from an alpine stream. Can. J. Microbiol. 23:1733–1736 [DOI] [PubMed] [Google Scholar]
- 27. Gjermansen M, Nilsson M, Yang L, Tolker-Nielsen T. 2010. Characterization of starvation-induced dispersion in Pseudomonas putida biofilms: genetic elements and molecular mechanisms. Mol. Microbiol. 75:815–826 [DOI] [PubMed] [Google Scholar]
- 28. Gyles C, et al. 1998. Association of enterohemorrhagic Escherichia coli hemolysin with serotypes of Shiga-like-toxin-producing Escherichia coli of human and bovine origins. Appl. Environ. Microbiol. 64:4134–4141 [DOI] [PMC free article] [PubMed] [Google Scholar]
- 29. Henrici AT. 1933. Studies of freshwater bacteria I. A direct microscopic technique. J. Bacteriol. 25:277–287 [DOI] [PMC free article] [PubMed] [Google Scholar]
- 30. Ito A, May T, Kawata K, Okabe S. 2008. Significance of rpoS during maturation of Escherichia coli biofilms. Biotechnol. Bioeng. 99:1462–1471 [DOI] [PubMed] [Google Scholar]
- 31. Jensen ET, Kharazmi A, Lam K, Costerton JW, Hoiby N. 1990. Human polymorphonuclear leukocyte response to Pseudomonas aeruginosa grown in biofilms. Infect. Immun. 58:2383–2385 [DOI] [PMC free article] [PubMed] [Google Scholar]
- 32. Kolter R, Siegele DA, Tormo A. 1993. The stationary phase of the bacterial life cycle. Annu. Rev. Microbiol. 47:855–874 [DOI] [PubMed] [Google Scholar]
- 33. Lange R, Hengge-Aronis R. 1991. Growth phase-regulated expression of bolA and morphology of stationary-phase Escherichia coli cells are controlled by the novel sigma factor sigma S. J. Bacteriol. 173:4474–4481 [DOI] [PMC free article] [PubMed] [Google Scholar]
- 34. Lange R, Hengge-Aronis R. 1991. Identification of a central regulator of stationary-phase gene expression in Escherichia coli. Mol. Microbiol. 5:49–59 [DOI] [PubMed] [Google Scholar]
- 35. Loewen PC, Hengge-Aronis R. 1994. The role of the sigma factor sigma S (KatF) in bacterial global regulation. Annu. Rev. Microbiol. 48:53–80 [DOI] [PubMed] [Google Scholar]
- 36. Mah TFC, O'Toole GA. 2001. Mechanisms of biofilm resistance to antimicrobial agents. Trends Microbiol. 9:34–39 [DOI] [PubMed] [Google Scholar]
- 37. Marrie TJ, Nelligan J, Costerton JW. 1982. A scanning and transmission electron microscopic study of an infected endocardial pacemaker lead. Circulation 66:1339–1341 [DOI] [PubMed] [Google Scholar]
- 38. McCann MP, Kidwell JP, Matin A. 1991. The putative sigma factor KatF has a central role in development of starvation-mediated general resistance in Escherichia coli. J. Bacteriol. 173:4188–4194 [DOI] [PMC free article] [PubMed] [Google Scholar]
- 39. Nickel JC, Ruseska I, Wright JB, Costerton JW. 1985. Tobramycin resistance of Pseudomonas aeruginosa cells growing as a biofilm on urinary catheter material. Antimicrob. Agents Chemother. 27:619–624 [DOI] [PMC free article] [PubMed] [Google Scholar]
- 40. Nickel JC, et al. 1985. Antibiotic resistance of Pseudomonas aeruginosa colonizing a urinary catheter in vitro. Eur. J. Clin. Microbiol. 4:213–218 [DOI] [PubMed] [Google Scholar]
- 41. Oh YJ, Jo W, Yang Y, Park S. 2007. Influence of culture conditions on Escherichia coli O157:H7 biofilm formation by atomic force microscopy. Ultramicroscopy 107:869–874 [DOI] [PubMed] [Google Scholar]
- 42. O'Toole G, Kaplan HB, Kolter R. 2000. Biofilm formation as microbial development. Annu. Rev. Microbiol. 54:49–79 [DOI] [PubMed] [Google Scholar]
- 43. Pratt LA, Kolter R. 1998. Genetic analysis of Escherichia coli biofilm formation: roles of flagella, motility, chemotaxis and type I pili. Mol. Microbiol. 30:285–293 [DOI] [PubMed] [Google Scholar]
- 44. Prigent-Combaret C, Vidal O, Dorel C, Lejeune P. 1999. Abiotic surface sensing and biofilm-dependent regulation of gene expression in Escherichia coli. J. Bacteriol. 181:5993–6002 [DOI] [PMC free article] [PubMed] [Google Scholar]
- 45. Reisner A, Krogfelt KA, Klein BM, Zechner EL, Molin S. 2006. In vitro biofilm formation of commensal and pathogenic Escherichia coli strains: impact of environmental and genetic factors. J. Bacteriol. 188:3572–3581 [DOI] [PMC free article] [PubMed] [Google Scholar]
- 46. Ren D, Bedzyk LA, Thomas SM, Ye RW, Wood TK. 2004. Gene expression in Escherichia coli biofilms. Appl. Microbiol. Biotechnol. 64:515–524 [DOI] [PubMed] [Google Scholar]
- 47. Sambrook J, Russell DW. 2001. Molecular cloning: a laboratory manual. Cold Spring Harbor Laboratory, Cold Spring Harbor, NY [Google Scholar]
- 48. Schembri MA, Kjaergaard K, Klemm P. 2003. Global gene expression in Escherichia coli biofilms. Mol. Microbiol. 48:253–267 [DOI] [PubMed] [Google Scholar]
- 49. Stewart PS. 2002. Mechanisms of antibiotic resistance in bacterial biofilms. Int. J. Med. Microbiol. 292:107–113 [DOI] [PubMed] [Google Scholar]
- 50. Stewart PS, Costerton JW. 2001. Antibiotic resistance of bacteria in biofilms. Lancet 358:135–138 [DOI] [PubMed] [Google Scholar]
- 51. Trémoulet F, Duché O, Namane A, Martinie B, Labadie JC. 2002. A proteomic study of Escherichia coli O157:H7 NCTC 12900 cultivated in biofilm or in planktonic growth mode. FEMS Microbiol. Lett. 215:7–14 [DOI] [PubMed] [Google Scholar]
- 52. Wang G, Doyle MP. 1998. Survival of enterohemorrhagic Escherichia coli O157:H7 in water. J. Food Prot. 61:662–667 [DOI] [PubMed] [Google Scholar]
- 53. Warburton DW, Austin JW, Harrison BH, Sanders G. 1998. Survival and recovery of Escherichia coli O157:H7 in inoculated bottled water. J. Food Prot. 61:948–952 [DOI] [PubMed] [Google Scholar]
- 54. Watterworth L, Rosa B, Schraft H, Topp E, Leung KT. 2006. Survival of various ERIC-genotypes of Shiga toxin-producing Escherichia coli in well water. Water Air Soil Pollut. 177:367–382 [Google Scholar]
- 55. Watterworth L, Topp E, Schraft H, Leung KT. 2005. Multiplex PCR-DNA probe assay for the detection of pathogenic Escherichia coli. J. Microbiol. Methods 60:93–105 [DOI] [PubMed] [Google Scholar]
- 56. Weber H, Polen T, Heuveling J, Wendisch VF, Hengge R. 2005. Genome-wide analysis of the general stress response network in Escherichia coli: sigmaS-dependent genes, promoters, and sigma factor selectivity. J. Bacteriol. 187:1591–1603 [DOI] [PMC free article] [PubMed] [Google Scholar]
- 57. Xavier JB, White DC, Almeida JS. 2003. Automated biofilm morphology quantification from confocal laser scanning microscopy imaging. Water Sci. Technol. 47:31–37 [PubMed] [Google Scholar]
- 58. Zambrano MM, Kolter R. 1996. GASPing for life in stationary phase. Cell 86:181–184 [DOI] [PubMed] [Google Scholar]
- 59. Zambrano MM, Siegele DA, Almiron M, Tormo A, Kolter R. 1993. Microbial competition: Escherichia coli mutants that take over stationary phase cultures. Science 259:1757–1760 [DOI] [PubMed] [Google Scholar]
- 60. Zinser ER, Kolter R. 1999. Mutations enhancing amino acid catabolism confer a growth advantage in stationary phase. J. Bacteriol. 181:5800–5807 [DOI] [PMC free article] [PubMed] [Google Scholar]
- 61. Zobell CE. 1943. The effect of solid surfaces upon bacterial activity. J. Bacteriol. 46:39–56 [DOI] [PMC free article] [PubMed] [Google Scholar]