

Abstract
The parasitic protozoan Entamoeba histolytica is aptly named for its capacity to destroy host tissue. When E. histolytica trophozoites invade the lamina propria of a host colon, extracellular matrices are degraded while host cells are killed and phagocytosed. The ability of E. histolytica to phagocytose host cells correlates with virulence in vivo. In order to better understand the mechanism of phagocytosis, we used an E. histolytica Affymetrix microarray chip to measure the total gene expression of phagocytic and nonphagocytic subpopulations. Using paramagnetic beads coated with a known host ligand that stimulates phagocytosis, phagocytic and nonphagocytic amoebae from a single culture were purified. Microarray analysis of the subpopulations identified 121 genes with >2-fold higher expression in phagocytic than in nonphagocytic amoebae. Functional annotation identified genes encoding proteins involved in actin binding and cytoskeletal organization as highly enriched gene clusters. Post hoc analyses of selected genes showed that the gene expression profile identified in the microarray experiment did not exist prior to cell sorting but rather was stimulated through phagocytosis. Further, these expression profiles correlated with an increase in phagocytic ability, as E. histolytica cultures exposed to an initial stimulus of phagocytosis showed increased phagocytic ability upon a second stimulus. To our knowledge, this is the first description of such feed-forward regulation of gene expression and phagocytic ability in a phagocyte.
INTRODUCTION
Entamoeba histolytica is an enteric protozoan that causes intestinal and extraintestinal amoebiasis. Diarrhea and liver abscess due to E. histolytica remain important causes of morbidity and mortality in the developing world (2). E. histolytica has a two-stage life cycle consisting of infectious cysts and motile trophozoites. Transmission is through a fecal-oral route, and each cyst gives rise to eight trophozoites. Trophozoites eventually colonize the large intestine, leading to disease when amoebae invade the epithelium. In cases where the infection is not self-limiting, amoebic dysentery and liver abscess formation can occur. Invasive cases, however, occur in only 10% of infections, the basis of which lies in the complex interactions between the immune system and microbiome of the host and the virulence of the parasite (16).
E. histolytica is a member of the Amoebidae family and was only recently differentiated from the commensal parasite Entamoeba dispar (7). The two share a high genomic sequence identity and are so similar in morphology that they can only be accurately differentiated clinically on the basis of the observed level of erythrophagocytosis or by molecular methods (6, 21, 35, 37). Although both respond to many of the same signals of phagocytosis, such as phosphatidyl serine exposure on the host cell, E. histolytica trophozoites phagocytose at a much higher rate than those of virulence-impaired E. dispar do (4). The concept of phagocytosis as a virulence factor in E. histolytica dates back to 1978, when work by Orozco et al. showed that phagocytosis-deficient clones of E. histolytica exhibit decreased virulence in vivo (24, 25, 29, 35). In light of this supporting research, the ability to phagocytose host cells is, at the very least, strongly correlated with amoebic virulence (30).
Previously, we showed that E. histolytica trophozoites induce host cell apoptosis and preferentially phagocytose apoptotic cells (18, 19). Furthermore, trophozoites recognize human C1q protein, which binds to apoptotic cells, and they more readily phagocytose apoptotic Jurkat T lymphocytes opsonized with C1q (34). E. histolytica calreticulin binds C1q, and cell surface calreticulin functions as a phagocytosis receptor (36). Fluorescently labeled beads coated with C1q are also phagocytosed at a much higher rate than control beads coated with an equal amount of bovine serum albumin (34). However, even in the presence of saturating amounts of C1q-coated beads, only approximately half of the trophozoite population is phagocytic in a typical experiment. The presence of phagocytic and nonphagocytic subpopulations of amoebae was also seen in experiments using Jurkat T lymphocytes (18).
In order to begin characterizing the phagocytic and nonphagocytic amoebic subpopulations and better understand the gene regulation that controls phagocytic ability, we used C1q as a model ligand and microarray analysis on sorted subpopulations of phagocytic and nonphagocytic amoebae. One hundred twenty-one genes were found to have consistently higher expression levels in the phagocytic population. Genes encoding proteins involved in actin binding and cytoskeleton organization had very high enrichment scores based on clustering analysis. Surprisingly, there were no genes identified with a lower expression level in the phagocytic population of amoebae. Follow-up experiments for a subset of the genes showed that the expression differences between the phagocytic and nonphagocytic cells were not pre-existing; rather, phagocytosis induces changes in gene expression that correlate with an increase in phagocytic ability.
MATERIALS AND METHODS
Cell culture.
Trophozoites of E. histolytica strain HM-1:IMSS were used for all experiments. Unless otherwise noted, all amoebae were grown in glass culture tubes using TYI-S-33 growth medium and harvested for assays during mid-log phase (8). Jurkat T lymphocytes (clone E6-1) were grown in T-25 flasks in RPMI 1640 medium supplemented with 10% fetal bovine serum (FBS) and penicillin (200 units/ml)-streptomycin (200 μg/ml).
Labeling of paramagnetic beads.
Human C1q (Quidel) was biotinylated using Sulfo-NHS-LC-biotin (Thermo Scientific) according to the manufacturer's protocol and then dialyzed against phosphate-buffered saline (PBS). M280 Streptavidin Dynabeads (Invitrogen) with a 2-μm diameter were labeled using biotinylated C1q at 20 μg/ml according to the manufacturer's protocol.
Purification of phagocytic and nonphagocytic trophozoites by magnetic cell sorting.
Amoebae were incubated on ice for 15 min in order to dislodge them from the culture tubes. Culture tubes were then centrifuged at 200 × g for 5 min at 4°C, and amoebae were resuspended in 50-ml conical tubes. Amoebae were washed first with cold PBS at pH 7.4 and then with cold PBS–d-gal (PBS with 20 mg/ml d-galactose). Amoebae were then resuspended in PBS–d-gal with C1q-coated paramagnetic beads in polypropylene tubes (12 by 75 mm). For each sample, 1 × 10⁶ amoebae and 1 × 10⁷ beads were used per tube in 500 μl of PBS–d-gal. These tubes were then centrifuged for 5 min at 400 × g, and incubated at 37°C for 45 min. Following incubation, amoebae were washed twice with 1 ml of cold PBS–d-gal and agitated to remove adherent beads. Next, amoebae were resuspended in 500 μl of MACS buffer (PBS at pH 7.2 with 0.5% bovine serum albumin and 2 mM EDTA). Cells were loaded into a magnetic column (Miltenyi Biotec) that was washed twice with 3 ml MACS buffer (the eluant collected contained the nonphagocytic trophozoites). The column was then removed from the magnet and washed with 5 ml MACS buffer (the eluant collected contained the phagocytosis-positive population).
Microarray analysis.
Total RNA was isolated from phagocytic and nonphagocytic trophozoites using 1 ml TRIzol reagent (Qiagen) according to the manufacturer's protocol, and RNA quality was tested using an Agilent 2100 Bioanalyzer prior to cDNA synthesis and biotinylation. Labeled probes were then hybridized to Affymetrix custom GeneChips, E_his-1a520285 (a gift from William A. Petri, University of Virginia; described by Gilchrist et al. [13]). Microarray data sets were analyzed using the Bioconductor software package written in the R statistical programming language (12). The RMA (robust multichip average) method of normalization was used on raw Affymetrix CEL files to obtain expression values for each probe. The software package LIMMA (linear models for microarray data analysis) was then used to identify differentially expressed genes based on moderate t statistics (32).
Semiquantitative reverse transcription (RT)-PCR and quantitative RT (qRT)-PCR.
E. histolytica trophozoites were harvested in mid-log-phase growth following 48 h of incubation, washed twice with PBS, and resuspended in PBS–d-gal. Magnetic cell sorting proceeded in the same manner as described above, with 1 × 10⁶ amoebae and 1 × 10⁷ paramagnetic C1q-coated M-280 Dynabeads per sample. Directly after sorting, the phagocytic and nonphagocytic trophozoites were pelleted at 400 × g for 5 min and total RNA was isolated (Promega RNAgents). RNA was quantitated and cDNA was generated by following the manufacturer's protocols (Promega ImProm-II). For semiquantitative RT-PCR, cDNA was serially diluted and gene segments were amplified using Taq polymerase (Invitrogen). L10 rRNA (EHI_044810) was also amplified to serve as a control; the primers for all amplifications can be found in the supplemental material. Following amplification, 10 μl of the PCRs for the phagocytic and nonphagocytic cells was run for 30 min at 100 V on a 2% ethidium bromide-stained agarose gel. Results represent four individual experiments performed over 3 separate days. For qRT-PCR, magnetic cell sorting proceeded as described above, only with the addition of a control group of amoebae that was not incubated with magnetic beads. L10 rRNA (EHI_044810) also served as a control, and data were analyzed using the ΔΔCT method (20). The primers for all qRT-PCR can be found in the supplemental material. Results represent 12 biological replicates performed over 5 separate days.
Feed-forward phagocytosis.
E. histolytica trophozoites were harvested in mid-log-phase growth following 48 h of incubation. Trophozoites were counted and washed with M199S (M199 medium supplemented with 25 mM HEPES [pH 6.8], 5 mM l-cysteine, and 0.57 mM ascorbic acid) and then aliquoted into new glass culture tubes (1 × 10⁵ amoebae per tube) (27). UV light-treated Jurkat T lymphocytes (2 × 10⁵ per tube) were added to each sample. Lymphocytes were washed twice with PBS, exposed to UV radiation using a Fotodyne UV box for 15 min to induce apoptosis, and then resuspended at 2 × 10⁵/20 μl PBS. Control tubes without Jurkat cells received conditioned PBS from a 6-h incubation with the same number of apoptotic Jurkat T lymphocytes but no actual lymphocytes. E. histolytica trophozoites where then incubated for various times before a phagocytosis assay, which was performed by using flow cytometry as previously described (18). For this, new Jurkat T lymphocytes were exposed to UV light for 15 min and cells were fluorescently labeled by resuspension in 2 ml of 28 μM carboxyfluorescein succinimidyl ester (Sigma) in PBS immediately following UV exposure. Labeling proceeded for 15 min at 37°C, at which time 2 ml of FBS was added to quench the labeling reaction. Jurkat cells were resuspended in 35 ml of RPMI medium and incubated at 37°C for 4 h to allow for apoptotic maturation. Postincubation, Jurkat T lymphocytes were resuspended in cold M199S at a cell density of 2 × 10⁶/ml. Amoebae were resuspended in cold M199S at a cell density of 1 × 10⁶ml. Next, 2 × 10⁵ Jurkat lymphocytes were moved into a polypropylene tube (12 by 75 mm) with 1 × 10⁵ amoebae. Samples were centrifuged for 5 min at 400 × g and then incubated at 37°C for 10 min. Samples were washed twice with 1 ml of PBS–d-gal, agitated to remove adherent cells, fixed in 4% paraformaldehyde, and then resuspended in PBS for analysis via flow cytometry. All flow cytometry was done using a Beckman Coulter EPICS XL-MCL flow cytometer. Amoebae and Jurkat T lymphocytes were differentiated using side and forward scatter measurements. Phagocytic amoebae were defined as those with fluorescence over the background, determined using a negative control. The phagocytic index was calculated by multiplying the percentage of phagocytic amoebae by the mean fluorescence of those determined to be phagocytic (10, 18). Results represent nine biological replicates performed on 3 separate days.
Statistical analyses and figure preparation.
All nonmicroarray analyses were done using GraphPad Prism 5 (specific statistical tests are indicated in the figure legends). All figures were prepared using Adobe Illustrator 10.0.3.
RESULTS
Differential gene expression of phagocytic versus nonphagocytic E. histolytica.
Gene expression microarrays were used to begin characterizing the differences between phagocytic and nonphagocytic amoeba populations. Paramagnetic beads coated with C1q protein were incubated with E. histolytica trophozoites, which allowed for magnetic sorting of the phagocytic and nonphagocytic trophozoite populations (Fig. 1). Approximately 50% of trophozoites phagocytosed at least one C1q-coated bead, and cell sorting using this method produced populations with high purity, based on manual cell counts. Microarray analysis identified 121 genes with a significantly higher expression level in the phagocytic population than in the nonphagocytic population (selected genes are shown in Table 1, and full results are in Table S1 in the supplemental material). Results represent three biological replicates from experiments performed on 2 separate days. Principal-component analysis scored the phagocytic versus the nonphagocytic group as the main determinant of variation as opposed to deviation based on replicates from separate days (data not shown).
Fig 1.

Sorting of phagocytic and nonphagocytic E. histolytica trophozoites. (a) Diagram depicting the steps of the magnet-assisted sorting of amoebic subpopulations where E. histolytica were allowed to phagocytose C1q-coated paramagnetic beads (step 1), applied and washed through a magnetized column whereby the negative population is eluted (step 2), and then the magnet is removed and the positive population is eluted (step 3). (b) Table showing percent phagocytosis and the purity of eluted populations based on manual cell counts (mean and standard error, n = 5). Photomicrographs show ×40 representative images of both the positive (c) and negative (d) amoebic populations.
Table 1.
Selected genes found to have higher expression in phagocytic than in nonphagocytic E. histolytica
| GenBank accession no. | AmoebaDB Gene ID | Product | Fold changea |
|---|---|---|---|
| Actin/cytoskeleton | |||
| XM_649577 | EHI_009570 | Gelsolin repeat protein, putative | 2.3015 |
| XM_650273 | EHI_021260 | Villidin, putative | 2.1225 |
| XM_649716 | EHI_007480 | Villin, putative | 2.0519 |
| XM_645914 | EHI_189500 | Calponin homology domain protein, putative | 2.0483 |
| XM_652483 | EHI_148910 | Interaptin, putative | 1.9667 |
| XM_643273 | EHI_155290 | Actinin-like protein, putative | 1.7574 |
| XM_649132 | EHI_122800 | EhABPH | 1.6777 |
| XM_643820 | EHI_003930 | I/LWEQ domain protein | 1.6484 |
| XM_649685 | EHI_167130 | Filopodin, putative | 1.6454 |
| XM_650274 | EHI_021270 | Villidin, putative | 1.6314 |
| XM_650730 | EHI_150430 | Villidin, putative | 1.5969 |
| XM_652194 | EHI_093850 | EhNCABP166 | 1.1732 |
| Cell signaling | |||
| XM_648060 | EHI_197120 | Protein phosphatase, putative | 1.9415 |
| XM_651257 | EHI_153770 | Phosphatidylinositol-4-phosphate 5-kinase, putative | 1.8486 |
| XM_648323 | EHI_005910 | Rho guanine nucleotide exchange factor, putative | 1.4674 |
| XM_646614 | EHI_100290 | Rap/Ran GTPase-activating protein, putative | 1.1563 |
| XM_648842 | EHI_105240 | BAR/SH3 domain-containing protein | 1.1462 |
| XM_646619 | EHI_100140 | Rho guanine nucleotide exchange factor, putative | 1.1406 |
| XM_648945 | EHI_137680 | Protein with RhoGEF and ArfGAP domains | 1.1239 |
| Hypothetical proteins | |||
| XM_644990 | EHI_029600 | Hypothetical protein, conserved | 3.7593 |
| XM_649772 | EHI_124620 | Hypothetical protein | 2.7051 |
| XM_650928 | EHI_098440 | Hypothetical protein, conserved | 2.4834 |
| XM_648500 | EHI_045540 | Hypothetical protein | 2.1104 |
| XM_652487 | EHI_148870 | Hypothetical protein | 1.7072 |
| XM_649710 | EHI_007640 | Hypothetical protein, conserved | 1.5399 |
| XM_645182 | EHI_007320 | Hypothetical protein, conserved | 1.3216 |
| XM_650935 | EHI_098510 | Hypothetical protein | 1.2059 |
| XM_648052 | EHI_197040 | Hypothetical protein | 1.1361 |
| XM_643045 | EHI_167940 | Hypothetical protein | 1.127 |
| Chromosome (related) | |||
| XM_651489 | EHI_050790 | Structural maintenance of chromosomes protein | 2.1999 |
| XM_649547 | EHI_141900 | Chromodomain-helicase-DNA-binding protein, putative | 1.6517 |
| XM_649656 | EHI_199700 | SMC4 protein, putative | 1.1206 |
| Other | |||
| XM_646732 | EHI_082590 | Glutamic acid-rich protein precursor, putative | 2.5646 |
| XM_651936 | EHI_110180 | Myosin heavy chain | 2.4264 |
| XM_652193 | EHI_093860 | MIT domain protein | 1.7198 |
Fold increases are shown in log2 format, and all results have an adjusted P value of <0.05.
Validation of microarray.
The gene expression profile identified using the Affymetrix GeneChip was first confirmed via semiquantitative RT-PCR. Paramagnetic beads were relabeled with C1q and incubated with trophozoites, and populations of phagocytic and nonphagocytic Entamoeba cells were sorted via magnet-assisted cell sorting as before. Five representative genes, selected on the basis of potential interest for in-depth characterization, were amplified from serially diluted cDNA samples of the newly sorted phagocytic and nonphagocytic trophozoites (Fig. 2). This semiquantitative method showed that amoebae in the phagocytic subpopulation exhibited higher expression of four of the five genes tested than the nonphagocytic subpopulation of amoebae. The fifth gene (EHI_148910) appeared to remain the same in both populations.
Fig 2.
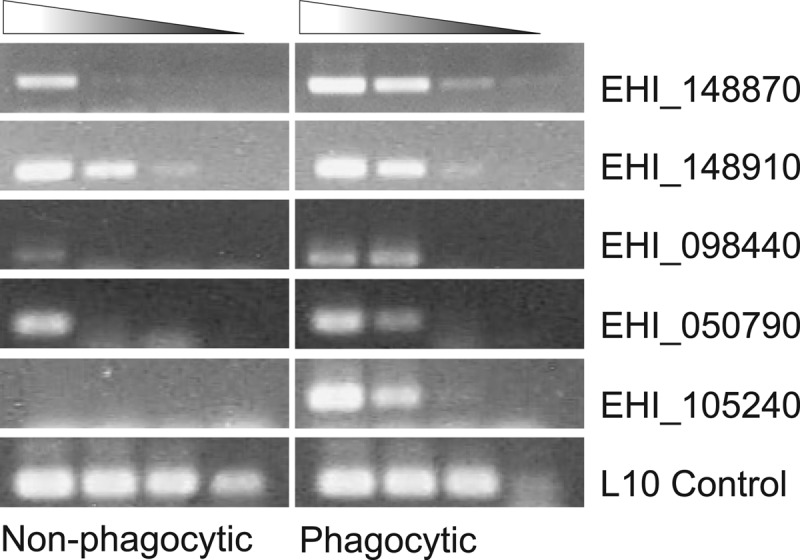
Semiquantitative RT-PCR showing the mRNA expression levels of five genes in nonphagocytic and phagocytic trophozoites and L10 rRNA control. cDNA from both nonphagocytic and phagocytic trophozoite populations was diluted 1:10, 1:100, 1:1,000, and 1:10,000 and used as the template for PCR. Ten-microliter volumes of each PCR product, loaded in order of increasing dilution from left to right, were assessed by agarose gel electrophoresis.
Induction of gene expression in phagocytic trophozoites.
Although our analysis found 121 genes with higher expression in the phagocytic population than in the nonphagocytic population, there were no genes with significantly lower expression in the phagocytic population. To us, this result suggested that the observed gene regulation may be induced by phagocytosis, a posteriori, as opposed to existing a priori in subpopulations of phagocytic and nonphagocytic amoebae. To test this hypothesis, we repeated the cell sorting procedure by following the same protocol as in the microarray experiments, employing a control group of amoebae that were applied to the magnetic sorting column but not incubated with paramagnetic beads. We reasoned that if a priori subpopulations of phagocytic and nonphagocytic populations existed before trophozoites were magnetically sorted, then the gene expression profile of the control group would fall between those of the phagocytic and nonphagocytic groups. If, however, gene regulation was induced by the act of phagocytosis, then the gene expression of the control group would be at the same level as that of the nonphagocytic amoebae. Following cell sorting, qRT-PCR was performed with primers specific for four of the genes shown to be highly expressed in the phagocytic population (Fig. 3). Each of the four genes analyzed was expressed more highly in the phagocytic population than in both the nonphagocytic population and the control population with no beads. Three out of the four genes tested showed a statistically significant difference in gene expression between the phagocytic population and the no-bead control. There were no significant differences in gene expression found between the nonphagocytic population and the no-bead control, suggesting that the expression profile of these genes was induced by phagocytosis.
Fig 3.
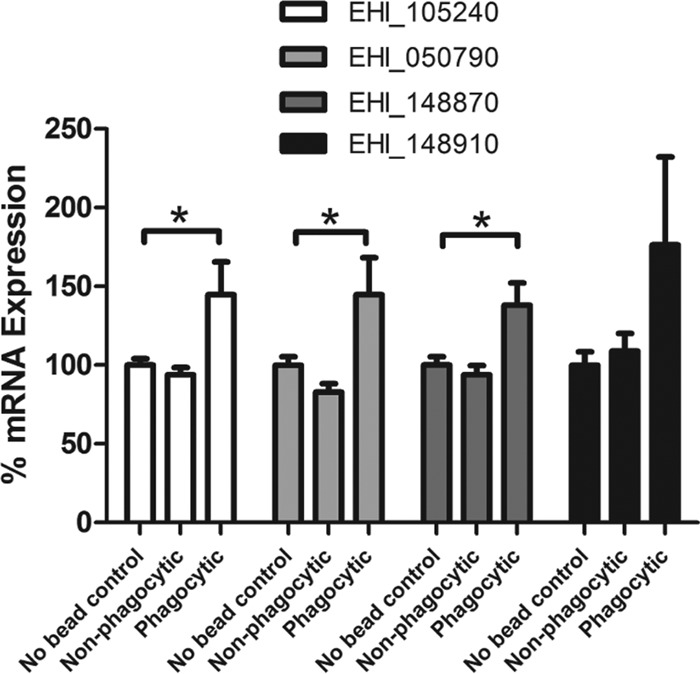
mRNA expression of selected genes from the sorted phagocytic and nonphagocytic subpopulations of E. histolytica compared to that in a no-bead control. Data are measurements from four different genes (EHI_105240, EHI_148910, EHI_148870, and EHI_050790) over 12 replicate experiments. qRT-PCR results were calculated by the ΔΔCT method and normalized to L10 rRNA (EHI_044810) (mean and standard error). Significance was tested by one-way analysis of variance with Dunnett's multiple-comparison test (*, P < 0.05).
Cluster analysis of gene expression differences in phagocytic versus nonphagocytic trophozoites.
Functional annotation of our microarray results was used to better understand the nature of the phagocytic gene expression profile. NIH DAVID identified two strong clusters (based on percentages, P values, and Bonferroni calculations) of genes encoding proteins involved in actin binding and in cytoskeletal organization that were significantly enriched among the 121 genes with higher expression in the phagocytic amoeba population (Table 2; see gene cluster lists in Table S2 in the supplemental material) (17). Representative genes from these clusters included putative villidin and interaptin family members. Genes with Src homology 3 (SH3) domains were also found to be highly enriched in the phagocytic trophozoite expression profile. SH3 domains are commonly found in proteins of signaling pathways regulating the cytoskeleton (23).
Table 2.
NIH DAVID functional annotations of genes with higher expression in phagocytic E. histolytica
| Category | Term | % | P value | Fold enrichment | Bonferroni score | Benjamini score |
|---|---|---|---|---|---|---|
| GOTERM_MF_FAT | Actin binding | 9.17 | 3.60E-09 | 13.04 | 2.05E-07 | 2.05E-07 |
| GOTERM_MF_FAT | Cytoskeletal protein binding | 9.17 | 6.76E-09 | 12.28 | 3.85E-07 | 1.93E-07 |
| GOTERM_MF_FAT | Helicase activity | 6.67 | 6.98E-05 | 7.34 | 3.97E-03 | 1.33E-03 |
| GOTERM_CC_FAT | Chromosome | 5.00 | 2.35E-04 | 8.18 | 2.82E-03 | 2.82E-03 |
| SP_PIR_KEYWORDS | SH3 domain | 3.33 | 8.17E-04 | 19.79 | 2.26E-02 | 1.14E-02 |
Feed-forward upregulation of phagocytosis in E. histolytica.
Since the act of phagocytosis in E. histolytica induces the expression of a set of cytoskeletal and actin-binding genes, we hypothesized that the act of phagocytosis induces gene expression patterns that increase phagocytic ability. To test this hypothesis, E. histolytica cultures were incubated with apoptotic Jurkat T lymphocytes (referred to as primary incubation) for various times and then incubated with fluorescently labeled apoptotic Jurkat T lymphocytes (secondary incubation) to measure phagocytic ability. As a control, amoebae were incubated with conditioned medium from apoptotic Jurkat T lymphocytes to ensure that any measured effect on phagocytic ability was not attributable to a factor released by the host cells. Phagocytosis of labeled Jurkat T lymphocytes increased >20% following 2 h of incubation with unlabeled lymphocytes (Fig. 4). This effect decreased at 4 h following the primary incubation (to >15%) and returned to the baseline at all of the subsequent time points assayed. These data suggest a feed-forward mechanism of regulation that stimulates E. histolytica phagocytosis.
Fig 4.
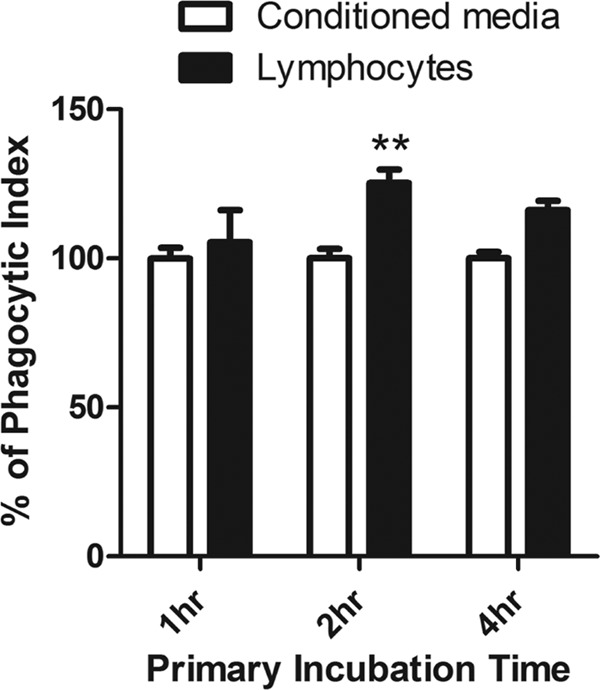
Incubation with lymphocytes increases phagocytic ability. Amoebae were first incubated with apoptotic Jurkat T lymphocytes or medium conditioned by apoptotic Jurkat T lymphocytes for various times, as shown on the x axis. Apoptotic Jurkat T lymphocytes labeled with carboxyfluorescein succinimidyl ester were then applied to and incubated with the amoebae; phagocytosis was subsequently quantified by flow cytometry. The y axis shows the calculated phagocytic index (mean and standard error, nine replicates on 3 days). Significance was based on two-way analysis of variance with the Bonferroni multiple-comparison test (**, P < 0.01 versus conditioned medium).
DISCUSSION
The most important finding of this study is that E. histolytica utilizes a novel feed-forward mechanism in the regulation of phagocytic ability. Microarray analysis of phagocytic versus nonphagocytic amoebae identified 121 genes with higher expression in phagocytic trophozoites. Surprisingly, not one gene was found to have significantly lower expression in the phagocytic population. qRT-PCR validation using a subset of upregulated genes showed that the nonphagocytic population did not have a significant change in gene expression across the genes analyzed from that of amoebae that were passed through the magnetic sorting column following incubation in the assay buffer in the absence of C1q-coated beads. Given that ∼50% of the amoebae were found to be nonphagocytic prior to magnetic cell sorting and that there was no difference in gene expression between nonphagocytic trophozoites and the no-bead control population, we concluded that the expression differences of these genes were not preexisting (otherwise the gene expression level in the no-bead control would have been intermediate between that of the phagocytic and nonphagocytic populations). Rather, phagocytosis must stimulate increased expression of genes, including genes involved in actin binding and cytoskeletal organization. Furthermore, incubation with lymphocytes increased the phagocytic ability of E. histolytica, suggesting that the induced changes in gene expression enhance phagocytic ability.
Our study has several limitations. First, we were unable to confirm the expression of all 121 genes found to be upregulated. Therefore, it is conceivable or even likely that some of the genes identified in the microarray analysis were differentially expressed prior to cell sorting, and contributed to differences in initial phagocytic ability. However, the genes that were selected for qRT-PCR clearly showed gene regulation induced by phagocytosis, as opposed to gene expression differences that existed a priori. Second, the methods used in our analysis do not fully differentiate phagocytosis from adherence, which are parts of a sequential process (18, 27, 30). We did not define the stage of phagocytosis at which changes in gene expression are stimulated, and it is possible that adherence alone may induce them. Finally, we only examined the effect of C1q-coated beads on gene expression. Therefore, although the increase in phagocytosis observed following incubation with Jurkat cells in the absence of added C1q suggests a general response, the effect of additional ligands remains to be tested directly.
Cluster analysis identified significant enrichment in genes encoding actin-binding and cytoskeletal organization proteins, leading us to hypothesize that phagocytosis may result in increased phagocytic ability by a feed-forward mechanism. Of note, four out of five predicted villidin homologs in E. histolytica were found to have greater expression in the phagocytic population. The villin/villidin family of genes functions in cytoskeletal organization, and all possess a signature villin headpiece domain that is known to bind F-actin (14). Several other proteins with actin-binding capabilities were also discovered, including some with previously characterized functions. The actin-binding protein EhABPH (EHI_122800), originally described by Ebert et al., was found to have higher expression in phagocytic amoebae (9). EhNCABP166 (EHI_093850), a nucleocytoplasmic actin-binding protein recently described by Campos-Parra et al. was discovered to be comparatively overexpressed (5). Two myosin heavy chains (EHI_110180 and EHI_140720) and a phosphatidylinositol phosphate kinase (EHI_153770) were also found to have higher expression in phagocytic amoebae. Both protein families have a previously documented role in virulence (3, 15, 28).
In addition to the aforementioned NIH DAVID annotated clusters, there were three other gene clusters identified. The first two include genes encoding proteins with predicted helicase activity, including two helicase-like SNF2 domain proteins known to be involved in chromatin remodeling (EHI_141900, EHI_000780) and chromosome (related) proteins, including proteins with putative involvement in the structural maintenance of chromosomes (EHI_050790, EHI_199700) (31, 33). These clusters may prove to be just as significant as the actin-binding and cytoskeletal organization gene clusters. For example, changes in helicase activity and chromosome organization may represent a signal to begin cell division following phagocytosis. It is also possible that gene expression differences in these clusters reflect differences in phagocytic ability at different stages of the E. histolytica cell cycle. However, preliminary experiments using E. histolytica cultures synchronized by serum starvation or using the DNA polymerase inhibitor aphidicolin suggest that this is not likely (data not shown) (22).
The SH3 domain was found to be greatly enriched in upregulated genes of phagocytic E. histolytica. The SH3 domain is known to bind proline residues and is commonly found in proteins involved in tyrosine kinase signaling (23). E. histolytica has an abundance of kinases, transmembrane kinases in particular, and approximately 55 putative tyrosine kinases (1, 21). One such SH3 domain protein also contains a putative Bin/amphiphysin/Rvs (BAR) sequence. BAR domain proteins are an evolutionarily conserved superfamily known to induce, stabilize, and sense membrane curvature (11, 26). Further analysis is warranted to determine the role this protein may play in E. histolytica intracellular signaling and phagocytosis. Our lab is currently working to characterize the function of this BAR/SH3 domain protein, as well as those of other proteins encoded by selected genes from this microarray analysis.
To a parasite such as E. histolytica, phagocytosis represents a mechanism for the acquisition of sustenance, allowing survival, growth, and cell division. So it should not come as a surprise that this organism has adapted to enable gene expression changes to increase phagocytic ability when host cells are present. What is perhaps surprising is the way in which E. histolytica is responding, which is not to some factor secreted by the host cell but rather an upregulation of phagocytic ability stimulated through phagocytosis. To our knowledge, this feed-forward gene regulation of phagocytosis is novel for both pathogenic phagocytes and resident human phagocytes, macrophages. Our lab is currently working to unravel the molecular mechanism of this regulation by identifying common gene regulatory motifs and their corresponding DNA-binding proteins.
Supplementary Material
ACKNOWLEDGMENTS
We thank members of our laboratory, in particular Jose Teixeira and Kovi Bessoff, for their helpful discussions; William A. Petri, Jr. (University of Virginia) for his kind gift of Affymetrix microarray chips; and the University of Vermont DNA and Microarray Facilities for technical assistance.
This work was supported by NIAID R01 AI072021 to C.D.H.
Footnotes
Published ahead of print 8 October 2012
Supplemental material for this article may be found at http://iai.asm.org/.
REFERENCES
- 1. Anamika K, Bhattacharya A, Srinivasan N. 2008. Analysis of the protein kinome of Entamoeba histolytica. Proteins 71:995–1006 [DOI] [PubMed] [Google Scholar]
- 2. Anonymous 1997. WHO/PAHO/UNESCO report. A consultation with experts on amoebiasis. Mexico City, Mexico 28-29 January, 1997. Epidemiol. Bull. 18:13–14 [PubMed] [Google Scholar]
- 3. Arhets P, Olivo JC, Gounon P, Sansonetti P, Guillen N. 1998. Virulence and functions of myosin II are inhibited by overexpression of light meromyosin in Entamoeba histolytica. Mol. Biol. Cell 9:1537–1547 [DOI] [PMC free article] [PubMed] [Google Scholar]
- 4. Boettner DR, Huston CD, Sullivan JA, Petri WA. 2005. Entamoeba histolytica and Entamoeba dispar utilize externalized phosphatidylserine for recognition and phagocytosis of erythrocytes. Infect. Immun. 73:3422–3430 [DOI] [PMC free article] [PubMed] [Google Scholar]
- 5. Campos-Parra AD, Hernandez-Cuevas NA, Hernandez-Rivas R, Vargas M. 2010. EhNCABP166: a nucleocytoplasmic actin-binding protein from Entamoeba histolytica. Mol. Biochem. Parasitol. 172:19–30 [DOI] [PubMed] [Google Scholar]
- 6. Clark CG, et al. 2006. New insights into the phylogeny of Entamoeba species provided by analysis of four new small-subunit rRNA genes. Int. J. Syst. Evol. Microbiol. 56:2235–2239 [DOI] [PubMed] [Google Scholar]
- 7. Diamond LS, Clark CG. 1993. A redescription of Entamoeba histolytica Schaudinn, 1903 (Emended Walker, 1911) separating it from Entamoeba dispar Brumpt, 1925. J. Eukaryot. Microbiol. 40:340–344 [DOI] [PubMed] [Google Scholar]
- 8. Diamond LS, Harlow DR, Cunnick C. 1978. A new medium for axenic cultivation of Entamoeba histolytica and other Entamoeba. Trans. R. Soc. Trop. Med. Hyg. 72:431–432 [DOI] [PubMed] [Google Scholar]
- 9. Ebert F, Buss H. 1997. Molecular cloning of an Entamoeba histolytica gene encoding a polypeptide with similarities to actin-binding proteins. Arch. Med. Res. 28(Spec No):136. [PubMed] [Google Scholar]
- 10. Fadok VA, et al. 1992. Exposure of phosphatidylserine on the surface of apoptotic lymphocytes triggers specific recognition and removal by macrophages. J. Immunol. 148:2207–2216 [PubMed] [Google Scholar]
- 11. Frost A, Unger VM, De Camilli P. 2009. The BAR domain superfamily: membrane-molding macromolecules. Cell 137:191–196 [DOI] [PMC free article] [PubMed] [Google Scholar]
- 12. Gentleman RC, et al. 2004. Bioconductor: open software development for computational biology and bioinformatics. Genome Biol. 5:R80 doi:10.1186/gb-2004-5-10-r80 [DOI] [PMC free article] [PubMed] [Google Scholar]
- 13. Gilchrist CA, et al. 2006. Impact of intestinal colonization and invasion on the Entamoeba histolytica transcriptome. Mol. Biochem. Parasitol. 147:163–176 [DOI] [PubMed] [Google Scholar]
- 14. Gloss A, et al. 2003. Villidin, a novel WD-repeat and villin-related protein from Dictyostelium, is associated with membranes and the cytoskeleton. Mol. Biol. Cell 14:2716–2727 [DOI] [PMC free article] [PubMed] [Google Scholar]
- 15. Goldston AM, Powell RR, Koushik AB, Temesvari LA. 2012. Exposure to host ligands correlates with colocalization of Gal/GalNAc lectin subunits in lipid rafts and phosphatidylinositol (4,5)-bisphosphate signaling in Entamoeba histolytica. Eukaryot. Cell 11:743–751 [DOI] [PMC free article] [PubMed] [Google Scholar]
- 16. Haque R, Huston CD, Hughes M, Houpt E, Petri WA. 2003. Amebiasis. N. Engl. J. Med. 348:1565–1573 [DOI] [PubMed] [Google Scholar]
- 17. Huang da W, Sherman BT, Lempicki RA. 2009. Systematic and integrative analysis of large gene lists using DAVID bioinformatics resources. Nat. Protoc. 4:44–57 [DOI] [PubMed] [Google Scholar]
- 18. Huston CD, Boettner DR, Miller-Sims V, Petri WA. 2003. Apoptotic killing and phagocytosis of host cells by the parasite Entamoeba histolytica. Infect. Immun. 71:964–972 [DOI] [PMC free article] [PubMed] [Google Scholar]
- 19. Huston CD, Houpt ER, Mann BJ, Hahn CS, Petri WA. 2000. Caspase 3-dependent killing of host cells by the parasite Entamoeba histolytica. Cell. Microbiol. 2:617–625 [DOI] [PubMed] [Google Scholar]
- 20. Livak KJ, Schmittgen TD. 2001. Analysis of relative gene expression data using real-time quantitative PCR and the 2(−Delta Delta C(T)) method. Methods 25:402–408 [DOI] [PubMed] [Google Scholar]
- 21. Loftus B, et al. 2005. The genome of the protist parasite Entamoeba histolytica. Nature 433:865–868 [DOI] [PubMed] [Google Scholar]
- 22. Makioka A, Ohtomo H, Kobayashi S, Takeuchi T. 1998. Effects of aphidicolin on Entamoeba histolytica growth and DNA synthesis. Tokai J. Exp. Clin. Med. 23:417–422 [PubMed] [Google Scholar]
- 23. Mayer BJ. 2001. SH3 domains: complexity in moderation. J. Cell Sci. 114:1253–1263 [DOI] [PubMed] [Google Scholar]
- 24. Orozco E, Guarneros G, Martinez-Palomo A. 1983. Entamoeba histolytica: phagocytosis as a virulence factor. J. Exp. Med. 158:1511. [DOI] [PMC free article] [PubMed] [Google Scholar]
- 25. Orozco E, Suarez ME, Sanchez T. 1985. Differences in adhesion, phagocytosis and virulence of clones from Entamoeba histolytica, strain HM1:IMSS. Int. J. Parasitol. 15:655–660 [DOI] [PubMed] [Google Scholar]
- 26. Peter BJ, et al. 2004. BAR domains as sensors of membrane curvature: the amphiphysin BAR structure. Science 303:495–499 [DOI] [PubMed] [Google Scholar]
- 27. Ravdin JI, Guerrant RL. 1980. Cytophathogenic mechanisms of Entamoeba histolytica. J. Exp. Med. 152:377–390 [DOI] [PMC free article] [PubMed] [Google Scholar]
- 28. Raymond-Denise A, Sansonetti P, Guillen N. 1993. Identification and characterization of a myosin heavy chain gene (mhcA) from the human parasitic pathogen Entamoeba histolytica. Mol. Biochem. Parasitol. 59:123–131 [DOI] [PubMed] [Google Scholar]
- 29. Rodríguez MA, Orozco E. 1986. Isolation and characterization of phagocytosis- and virulence-deficient mutants of Entamoeba histolytica. J. Infect. Dis. 154:27–32 [DOI] [PubMed] [Google Scholar]
- 30. Sateriale A, Huston CD. 2011. A sequential model of host cell killing and phagocytosis by Entamoeba histolytica. J. Parasitol. Res. 2011:926706 doi:10.1155/2011/926706 [DOI] [PMC free article] [PubMed] [Google Scholar]
- 31. Sen P, Ghosh S, Pugh BF, Bartholomew B. 2011. A new, highly conserved domain in Swi2/Snf2 is required for SWI/SNF remodeling. Nucleic Acids Res. 39:9155–9166 [DOI] [PMC free article] [PubMed] [Google Scholar]
- 32. Smyth GK. 2004. Linear models and empirical Bayes methods for assessing differential expression in microarray experiments. Stat. Appl. Genet. Mol. Biol. 3:Article3 [DOI] [PubMed] [Google Scholar]
- 33. Strunnikov AV, Jessberger R. 1999. Structural maintenance of chromosomes (SMC) proteins: conserved molecular properties for multiple biological functions. Eur. J. Biochem. 263:6–13 [DOI] [PubMed] [Google Scholar]
- 34. Teixeira JE, Heron BT, Huston CD. 2008. C1q- and collectin-dependent phagocytosis of apoptotic host cells by the intestinal protozoan Entamoeba histolytica. J. Infect. Dis. 198:1062–1070 [DOI] [PMC free article] [PubMed] [Google Scholar]
- 35. Trissl D, Martinez-Palomo A, de la Torre M, de la Hoz R, de Suarez EP. 1978. Surface properties of Entamoeba: increased rates of human erythrocyte phagocytosis in pathogenic strains. J. Exp. Med. 148:1137–1145 [DOI] [PMC free article] [PubMed] [Google Scholar]
- 36. Vaithilingam A, Teixeira JE, Miller PJ, Heron BT, Huston CD. 2012. Entamoeba histolytica cell surface calreticulin binds human C1q and functions in amebic phagocytosis of host cells. Infect. Immun. 80:2008–2018 [DOI] [PMC free article] [PubMed] [Google Scholar]
- 37. Wilson IW, Weedall GD, Hall N. 2011. Host-parasite interactions in Entamoeba histolytica and Entamoeba dispar: what have we learned from their genomes? Parasite Immunol. 34:90–99 [DOI] [PMC free article] [PubMed] [Google Scholar]
Associated Data
This section collects any data citations, data availability statements, or supplementary materials included in this article.