

Abstract
Extraintestinal Escherichia coli (ExPEC), a heterogeneous group of pathogens, encompasses avian, neonatal meningitis, and uropathogenic E. coli strains. While several virulence factors are associated with ExPEC, there is no core set of virulence factors that can be used to definitively differentiate these pathotypes. Here we describe a multiplex of four virulence factor-encoding genes, yfcV, vat, fyuA, and chuA, highly associated with uropathogenic E. coli strains that can distinguish three groups of E. coli: diarrheagenic and animal-associated E. coli strains, human commensal and avian pathogenic E. coli strains, and uropathogenic and neonatal meningitis E. coli strains. Furthermore, human intestinal isolates that encode all four predictor genes express them during exponential growth in human urine and colonize the bladder in the mouse model of ascending urinary tract infection in higher numbers than human commensal strains that do not encode the four predictor genes (P = 0.02), suggesting that the presence of the predictors correlates with uropathogenic potential.
INTRODUCTION
Extraintestinal pathogenic Escherichia coli (ExPEC), a heterogeneous group of E. coli pathotypes defined by isolation from infections outside the intestinal tract, includes uropathogenic E. coli (UPEC), avian-pathogenic E. coli (APEC), and neonatal meningitis E. coli (NMEC) (20, 32). ExPEC strains are a diverse group of pathogenic E. coli strains that cause disease in poultry and companion animals as well as humans (32). While many virulence factors are associated with ExPEC, no core set of virulence factors can unambiguously distinguish the ExPEC subgroups from one another. Therefore, strains can be designated UPEC, APEC, or NMEC only on the basis of the isolation source (20). Unlike diarrheagenic E. coli (DEC) strains, which are obligate intestinal pathogens, ExPEC strains can commensally colonize the human intestine; thus, the intestinal tract can serve as a reservoir for extraintestinal E. coli (20).
This ExPEC reservoir is of particular importance for women with recurrent urinary tract infections (UTIs), as UPEC is the predominant cause of uncomplicated UTIs. It is estimated that over 50% of women will have a UTI in their lifetime; 25% will then experience a second UTI and 3% will have a third UTI within 6 months of the initial infection (5). One explanation for recurrence is that such a reservoir of UPEC in the gastrointestinal tract of this population of women is reintroduced to the urinary tract, allowing subsequent infections to occur. Indeed, UPEC clones persist long term as commensals within the intestinal tract and can even be shared among family members and household pets (13, 24). A diagnostic test that could identify potential carriers of UPEC, therefore, would be beneficial for medical practitioners to determine a course for prevention of recurrent UTI. Identification of reservoirs of uropathogens could be used to identify at-risk populations and reduce disease transmission. Once carriers of UPEC are identified, the patients can be treated to eradicate the pathogen. Furthermore, identifying carriers of these strains will allow research into why certain individuals are more susceptible to colonization with UPEC strains to be conducted, furthering our understanding of the contribution of the host to infection.
We have previously reported the prevalence of 29 virulence and fitness genes in an E. coli strain collection comprised of UPEC, human commensal, and animal commensal E. coli isolates (n = 227) (33, 37). On the basis of further analysis of these data, four genes were chosen for the development of a diagnostic multiplex PCR of UPEC. These genes are vat, which encodes an autotransporter serine protease toxin; fyuA, which encodes the yersiniabactin receptor; chuA, which encodes a heme binding protein; and yfcV, which encodes the major subunit of a putative chaperone-usher fimbria. E. coli isolates that encode these four genes are correlated with carriage of a high number of other virulence factors, are able to colonize the bladder in higher numbers than strains lacking these genes, and are nearly 10 times more likely to represent UPEC or NMEC strains than fecal commensal strains.
MATERIALS AND METHODS
Strain collection.
A strain collection that contained 485 E. coli isolates was assembled. These included human commensal isolates (n = 67) (23, 25), animal commensal isolates from the Escherichia coli collection of reference (ECOR) (n = 32) (25), APEC isolates (n = 30; 10 virulence cluster 1 [low virulence], 10 virulence cluster 2 [intermediate virulence], and 10 virulence cluster 3 [highly virulent] isolates) (18), DEC isolates (n = 29; 10 enteropathogenic, 10 enterohemorrhagic, and 9 enterotoxigenic E. coli isolates) (2, 28, 40), NMEC isolates (n = 30) (41), and UPEC isolates (n = 293), including isolates from patients with asymptomatic bacteriuria (ABU; n = 65) (11, 25), complicated UTI (n = 82) (22, 39), uncomplicated cystitis (n = 69) (7, 25, 34; this study), and pyelonephritis (n = 77) (23, 25, 38). Urine was collected at the University of Michigan Urology Center and University Health Services from women over 18 years of age presenting with symptoms of a urinary tract infection and streaked for isolation onto MacConkey agar. Isolates confirmed to be E. coli were included in this study. All participants gave informed consent for the urine to be collected and used in this study.
Diagnostic multiplex PCR.
Isolates were tested in duplicate by multiplex PCR using single colonies as the template. Purified genomic DNA from E. coli UTI89, a cystitis isolate positive for vat, fyuA, chuA, and yfcV, was included as a positive-control template. A no-template control was included as a negative control. Multiplex PCR was carried out using a Qiagen multiplex PCR kit. Thermocycler conditions were 95°C for 15 min, followed by 30 cycles of 30 s at 94°C, 1.5 min at 63°C, and 1.5 min at 72°C and then a final extension incubation for 10 min at 72°C. The primer mix (10 μM) included primers for vat, fyuA, chuA, and yfcV. The primer sequences are listed in Table 1. The predictor gene (PG) score is defined as the total number of predictor genes present per isolate.
Table 1.
Primer sequences used in the diagnostic multiplex PCR
| Target gene | Primer sequence (5′–3′) |
Product size (bp) | Reference | |
|---|---|---|---|---|
| Forward primer | Reverse primer | |||
| vat | TCAGGACACGTTCAGGCATTCAGT | GGCCAGAACATTTGCTCCCTTGTT | 1100 | 37 |
| fyuA | GTAAACAATCTTCCCGCTCGGCAT | TGACGATTAACGAACCGGAAGGGA | 850 | 37 |
| chuA | CTGAAACCATGACCGTTACG | TTGTAGTAACGCACTAAACC | 652 | This study |
| yfcV | ACATGGAGACCACGTTCACC | GTAATCTGGAATGTGGTCAGG | 292 | 33 |
RNA isolation and cDNA synthesis.
E. coli isolates were cultured overnight in LB broth with aeration at 37°C. The bacterial concentration was estimated by spectrophotometry at a wavelength of 600 nm, and 1-ml samples were diluted to 109 CFU/ml. Bacteria were collected by centrifugation, washed once with phosphate-buffered saline (PBS), and resuspended in 20 ml of sterile human urine (filter sterilized, 0.22-μm pore size; Millipore). Bacteria were cultured statically at 37°C, and culture samples (2 ml) were removed during mid-exponential phase and stationary phase. RNA was stabilized with 4 ml RNAprotect (Qiagen), and total RNA was isolated using an RNeasy minisystem (Qiagen) according to the manufacturer's instructions. Total RNA and cDNA sample concentrations were estimated using a NanoDrop ND-1000 spectrophotometer (Thermo Scientific). cDNA was synthesized from total RNA using a Superscript double-stranded cDNA synthesis system (Invitrogen) according to the manufacturer's instructions.
In vivo murine model of ascending UTI.
Six- to 8-week-old CBA/J mice were infected transurethrally as previously described (12) with 108 CFU E. coli suspended in 50 μl of PBS. Dilutions of the suspension were cultured to quantify the inocula on LB agar. At 48 h postinoculation (hpi), mice were euthanized and target organs were removed. To quantify the bacterial load, the target organs were weighed and homogenized in 3 ml sterile PBS with a GLH homogenizer (Omni International), and using an Autoplate 4000 spiral plater (Spiral Biotech), dilutions were cultured on LB agar. The number of CFU/g tissue was calculated for each target organ for each mouse, and the data were compiled and analyzed with a Mann-Whitney test, where a P value of <0.05 was considered significant.
Statistical analysis.
Comparison of the PG score of E. coli isolates of different pathotypes was conducted with Kruskal-Wallis one-way analysis of variance, and when this test yielded a P value of <0.05, pairwise comparisons were conducted using Dunn's multiple-comparison test.
Cluster analysis was used to visualize the relationship between E. coli pathotypes on the basis of the presence/absence of each predictor gene, as follows. A four-digit genotype was assigned to each isolate, where 1 is the presence and 0 is the absence of individual predictor genes. Since the presence and absence of four genes were considered, a total of 16 genotypes were possible. Next, a data matrix was generated where pathotypes were rows, genotypes were columns, and each cell was the observed number of isolates of each pathotype/genotype combination. A distance matrix was generated from the data matrix using the Bray-Curtis distance in EstimateS (4). This distance metric was used because it considers both the presence/absence and the relative abundance of genotypes among the pathotypes. Finally, a neighbor-joining dendrogram was constructed in MEGA, version 5 (35), to visualize the Bray-Curtis similarity. Genotypic diversity within each pathotype was measured by the Shannon-Wiener diversity index, which considers rare and abundant genotypes with equal weight, and 1/Simpson index, which is sensitive to changes in the most dominant genotypes of the population. Univariate logistic regression was used to predict whether an isolate was UPEC on the basis of the presence/absence of certain genes (i.e., predictor genes). Logistic regression was used to calculate odds ratios and 95% confidence intervals (CIs) for models of the odds that a strain was UPEC relative to a reference strain based on the diagnostic predictors. All univariate and multinomial logistic regressions were performed using SAS, version 9.2 (SAS Statistical Institute, Cary, NC).
RESULTS
The genes yfcV, vat, fyuA, and chuA are associated with higher numbers of other UPEC virulence factors.
By combining the observations from Vigil et al. (37) and Spurbeck et al. (33), in which the prevalence of 29 potential virulence factors was determined in an E. coli strain collection of 227 uropathogenic (n = 170) and commensal (n = 57) isolates, the ability of 23 UPEC-associated genes to predict urovirulence was assessed (Fig. 1A). We hypothesized that the difference in the number of virulence factor (VF) genes between isolates that either carried or did not carry a gene would indicate its predictive potential. For example, an ideal predictor gene (gene X) would be one in which the population of E. coli carrying gene X also carries the highest mean number of VF genes and the population of E. coli that does not carry gene X carries the lowest mean number of VF genes; therefore, the best predictor genes have the largest differences in mean number of other VF genes carried. Of the 23 UPEC-associated genes examined, yfcV (131 positive and 96 negative isolates, differing for a mean of 10.1 other VF genes), vat (101 positive and 126 negative isolates, differing for a mean of 10.1 other VF genes), chuA (153 positive and 74 negative isolates, differing for a mean of 9.8 other VF genes), and fyuA (164 positive and 63 negative isolates, differing for a mean of 7.2 other VF genes) showed the largest differences and were chosen for inclusion in this study.
Fig 1.

Power of each virulence gene to predict the presence of other virulence genes in E. coli isolates. (A) Box-and-whisker plot of the number of other virulence or colonization factor genes present (total screened = 29) in strains positive for each predictor gene compared to strains negative for the predictor gene. The line in each box indicates the median, whiskers indicate the 5th to 95th percentiles, and dots are outliers. +, positive for the gene; −, negative for the gene. (B) Comparison of the PG score with the number of other VF genes present in each isolate. Data points indicate the mean number of other VF genes for PG score. Error bars represent the standard deviation.
The differences displayed in Fig. 1A were calculated on an individual gene basis. To determine whether combinations of these four predictor genes (PGs) correlated with the number of VF genes, we plotted the number of other VF genes present in isolates against the number of PGs present (Fig. 1B). The number of other VF genes increased with the number of PGs, from the 50 strains without yfcV, vat, fyuA, and chuA (which had an average of 4.0 ± 1.3 VF genes) to the 100 strains positive for all four genes (which had an average of 17.5 ± 2.9 VF genes) (Fig. 1B). The number of PGs present correlated with the mean number of VF genes (r2 = 0.975, P = 0.0017), with the number of other VF genes increasing on average by 3.21 ± 0.30 for each incremental increase in the number of PGs.
The presence of yfcV, vat, fyuA, and chuA is significantly associated with UPEC and NMEC but not DEC.
To investigate the ability of yfcV, vat, fyuA, and chuA to predict whether E. coli isolates are uropathogenic, we developed a multiplex PCR to determine their prevalence in the diverse collection of 485 E. coli isolates described above. The prevalence of yfcV, vat, fyuA, and chuA in each E. coli pathotype and the commensal isolates is shown in Table S1 in the supplemental material. The presence of each PG was able to differentiate UPEC from animal commensal, human commensal, and DEC isolates. UPEC can also be distinguished from APEC by yfcV, fyuA, and chuA but not by vat. UPEC could not be distinguished from NMEC by any of the predictor genes (Table 2). Although all isolates representing EPEC, ETEC, and EHEC are included in the strain collection, there was no significant difference in the prevalence of yfcV, vat, fyuA, and chuA among the diarrheagenic pathotypes by Fisher's exact test, so these are discussed together as DEC. Likewise, the prevalences of yfcV, vat, fyuA, and chuA among the low, intermediate, and highly virulent APEC clusters were not significantly different from each other and are therefore not differentiated into these groups for the purpose of this study. Furthermore, there was no significant difference in the prevalence of the predictor genes among ABU, cystitis, complicated UTI, and pyelonephritis isolates; therefore, for the rest of this work these subtypes of UPEC will not be distinguished (see Table S2 in the supplemental material).
Table 2.
Multinomial logistic regression models for individual predictor genes
| Outcome variablea | Predictor variableb | P value | Odds ratio | 95% CI |
|---|---|---|---|---|
| UPEC (animal commensal) | vat | <0.0001 | 13.1 | 3.99–44.0 |
| UPEC (animal commensal) | fyuA | <0.0001 | 14.6 | 6.4–33.0 |
| UPEC (animal commensal) | chuA | <0.0001 | 8.9 | 3.9–20.3 |
| UPEC (animal commensal) | yfcV | <0.0001 | 9.7 | 3.8–24.3 |
| UPEC (human commensal) | vat | 0.0003 | 2.8 | 1.6–4.9 |
| UPEC (human commensal) | fyuA | <0.0001 | 4.5 | 2.5–8.1 |
| UPEC (human commensal) | chuA | <0.0001 | 3.2 | 1.8–5.6 |
| UPEC (human commensal) | yfcV | 0.001 | 2.4 | 1.4–4.2 |
| UPEC (DEC) | fyuA | <0.0001 | 20.8 | 8.3–51.9 |
| UPEC (DEC) | chuA | <0.0001 | 9.2 | 3. 9–21.7 |
| UPEC (APEC) | fyuA | <0.0001 | 5.1 | 2.3–11.2 |
| UPEC (APEC) | chuA | 0.01 | 2.7 | 1.2–5.8 |
| UPEC (APEC) | yfcV | <0.0001 | 7.3 | 3.0–17.7 |
| UPEC (NMEC) | yfcV | 0.11 | 0.5 | 0.2–1.2 |
The reference group is given in parentheses.
Only models with significant or nearly significant predictors are shown.
Pathotype similarity based on PG score.
Three groups of E. coli isolates could be differentiated according to the Bray-Curtis similarity metric: (i) animal commensal and DEC isolates, (ii) APEC and human commensal isolates, and (iii) UPEC and NMEC isolates (Fig. 2A). The same pathotypes could be grouped by median PG score. UPEC and NMEC isolates had the highest median PG scores (for UPEC, score = 4; for NMEC, score = 4). NMEC and UPEC differed significantly from all other source groups (P < 0.05), including APEC. Animal commensal and DEC isolates had the lowest median PG score (for animal commensals, score = 0; for DEC, score = 1) but differed significantly from the rest of the isolates tested. Human commensal and APEC isolates made up an intermediate group (for human commensals, median PG score = 1 and APEC median PG score = 2). The proportion of isolates positively correlated with the PG score for UPEC and NMEC, as 68% of UPEC isolates and 83% of NMEC isolates had a PG score of 3 or 4.There is an inverse relationship between the proportion of isolates and the PG score for DEC and animal commensal isolates, as 100% of DEC and 78% of animal commensal isolates had a PG score of 0 or 1 (Fig. 2B).
Fig 2.
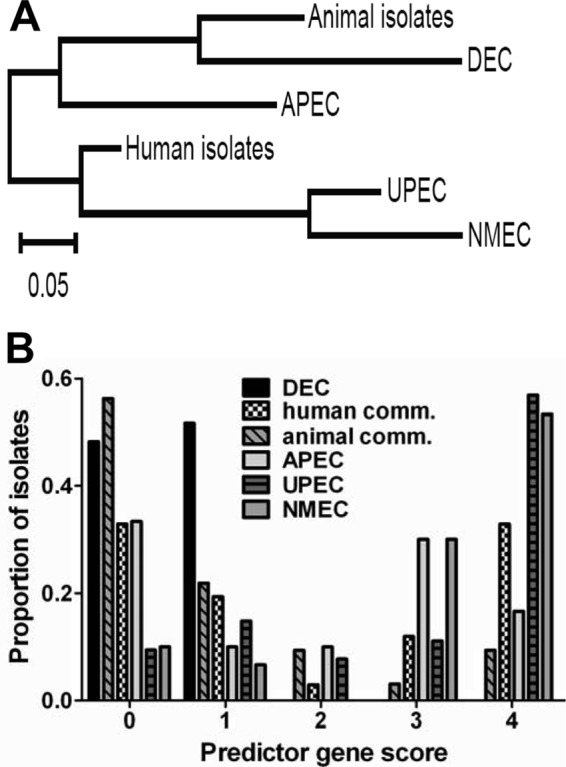
Multiplex PCR results for yfcV, vat, fyuA, and chuA separate E. coli pathotypes into three groups, (i) animal isolates and DEC, (ii) APEC and human isolates, and (iii) UPEC and NMEC isolates, with high PG scores correlating with UPEC and NMEC isolates. (A) Dendrogram depicting the distribution of the E. coli pathotypes on the basis of the Bray-Curtis similarity metric; (B) proportion of isolates with the indicated PG score for each E. coli pathotype (comm., commensal).
APEC and human commensal isolates are the most genotypically diverse groups.
Of the 16 potential genotypes, 13 were represented in the strain collection (Table 3). The genotypes vat, vat fyuA, and vat chuA yfcV were never observed. Shannon diversity and 1/Simpson indices were calculated for each pathotype on the basis of the genotypes observed. APEC and human commensal isolates had the greatest genotypic diversity of all pathotypes, whereas DEC and NMEC isolates were the least diverse.
Table 3.
Distribution of the 16 possible genotypes among the pathotypes
| Genotypea | No. of isolates |
|||||
|---|---|---|---|---|---|---|
| Animal commensal (n = 32) | Human commensal (n = 67) | UPEC (n = 297) | DEC (n = 29) | APEC (n = 30) | NMEC (n = 30) | |
| All genotypes | 18 | 22 | 28 | 14 | 10 | 3 |
| yfcV | 1 | 1 | 1 | |||
| chuA | 3 | 4 | 9 | 8 | 1 | |
| fyuA | 3 | 8 | 34 | 7 | 2 | 2 |
| vat | ||||||
| vat yfcV | 1 | |||||
| fyuA chuA | 2 | 1 | 20 | 1 | ||
| fyuA yfcV | 1 | 1 | 2 | |||
| vat chuA | 1 | |||||
| vat fyuA | ||||||
| chuA yfcV | 1 | |||||
| vat fyuA chuA | 1 | 8 | ||||
| vat fyuA yfcV | 1 | 1 | ||||
| vat chuA yfcV | ||||||
| fyuA chuA yfcV | 1 | 8 | 31 | 1 | 8 | |
| vat fyuA chuA yfcV | 3 | 22 | 169 | 5 | 16 | |
| Shannon diversity index | 0.65 | 0.69 | 0.62 | 0.46 | 0.77 | 0.53 |
| 1/Simpson index | 2.86 | 4.03 | 2.76 | 2.72 | 4.55 | 2.69 |
The genotype indicates positivity for the indicated genes.
fyuA is the best predictor of UPEC.
When all predictors were adjusted for in the multinomial logistic regression models, only three predictors retained their significance from the individual diagnostic predictor regression models: specifically, fyuA in models where animal commensals, human commensals, DEC, and APEC were the reference groups and vat and yfcV in the model where APEC was the reference group (Table 4). Notably, vat was a negative predictor of UPEC (or, conversely, a positive predictor of APEC), with an odds ratio of 0.008 (95% CI, < 0.001 to 0.08). The finding that the various predictors' significance was attenuated in many of the adjusted models compared with the primary models suggests that the other three predictors could explain part of the effect of a given predictor on the odds of a strain being UPEC versus the reference group. Therefore, any two of yfcV, vat, or chuA along with fyuA could be used to differentiate UPEC from DEC, human commensal, or animal commensal isolates. However, to differentiate UPEC from APEC, vat, fyuA, and yfcV together are necessary.
Table 4.
Multinomial logistic regression models for all diagnostic predictors
| Outcome variablea | Predictor variable | P value | Odds ratio | 95% CI |
|---|---|---|---|---|
| UPEC (animal commensal) | vat | 0.13 | 3.6 | 0.7–19.2 |
| fyuAb | 0.0006 | 5.9 | 2.2–16.4 | |
| chuA | 0.14 | 2.3 | 0.8–6.7 | |
| yfcV | 0.78 | 0.8 | 0.2–3.6 | |
| UPEC (human commensal) | vat | 0.16 | 1.8 | 0.8–4.3 |
| fyuA | 0.002 | 3.5 | 1.6–7.7 | |
| chuA | 0.09 | 2.1 | 0.9–5.2 | |
| yfcV | 0.14 | 0.5 | 0.2–1.3 | |
| UPEC (DEC) | vat | 0.96 | 6308.5 | <0.001–>999.1 |
| fyuA | 0.002 | 4.4 | 1.7–11.3 | |
| chuA | 0.87 | 1.1 | 0.4–2.8 | |
| yfcV | 0.94 | 116366.5 | <0.001–>999.1 | |
| UPEC (APEC) | vat | <0.0001 | 0.008 | <0.001–0.08 |
| fyuA | 0.01 | 5.2 | 1.4–18.6 | |
| chuA | 0.25 | 2.3 | 0.6–9.5 | |
| yfcV | <0.0001 | 99.5 | 17.6–561.0 | |
| UPEC (NMEC) | vat | 0.14 | 2.0 | 0.8–5.1 |
| fyuA | 0.81 | 1.2 | 0.3–5.8 | |
| chuA | 0.23 | 2.5 | 0.6–11.2 | |
| yfcV | 0.01 | 0.1 | 0.03–0.6 |
The reference group is given in parentheses.
Significant predictors are in boldface.
PG score can differentiate UPEC from other types of E. coli except NMEC.
Multinomial logistic regression modeling for PG score as the predictive variable differentiated UPEC from APEC, DEC, and animal and human commensal E. coli isolates (Table 5). For the model with human commensal E. coli isolates held as the reference group, each unit increase in PG score increased the odds of a strain being a UPEC strain versus a human commensal E. coli strain by a factor of 2.4. Therefore, the odds of an isolate being UPEC would be 9.7-fold higher for an isolate with a PG score of 4 than for an isolate with a score of 0. The model with the most significant predictor held DEC as the reference group; each unit increase in PG score increased the odds of an isolate being UPEC versus DEC by a factor of 3.3 (95% CI, 2.2 to 5.1). The sensitivity of the multiplex PCR assay to predict UPEC isolates by PG score was 62.4% for strains with a PG score of 3 or 4, the specificity was 69.6%, and the positive predictive value was 82.5%.
Table 5.
Multinomial logistic regression models for PG score
| Outcome variablea | P value | Odds ratio | 95% CI |
|---|---|---|---|
| UPEC (human commensal) | <0.0001 | 2.435 | 1.804–3.288 |
| UPEC (animal commensal) | <0.0001 | 1.491 | 1.259–1.767 |
| UPEC (DEC) | <0.0001 | 3.349 | 2.19–5.122 |
| UPEC (APEC) | 0.0005 | 1.525 | 1.204–1.933 |
| UPEC (NMEC) | 0.50 | 0.908 | 0.687–1.200 |
The predictor variable for each model is the PG score. The reference group is given in parentheses.
Fecal isolates positive for yfcV, vat, fyuA, and chuA colonize the murine bladder more efficiently than negative isolates.
Five human fecal E. coli isolates positive (EFC18, EFC24, EFC26, ECOR55, and ECOR61) and five isolates negative (EFC7, EFC9, EFC14, EFC22, and ECOR5) for the presence of yfcV, vat, fyuA, and chuA by multiplex PCR randomly selected from all such isolates were tested in individual challenges (5 mice/strain) in the mouse model of ascending UTI. At 48 h postinfection, target organs from each mouse were harvested, weighed, and homogenized, and dilutions were cultured to determine the number of CFU/g tissue. The compiled data from all 5 isolates positive for yfcV, vat, fyuA, and chuA were compared to those from the 5 negative isolates. Positive isolates had a significant colonization advantage in the bladder, with a greater than 1,000-fold increase in median colonization compared to negative isolates (Fig. 3A; P = 0.0213). This demonstrates that the presence of these four genes can predict the in vivo urovirulence of human fecal E. coli isolates.
Fig 3.
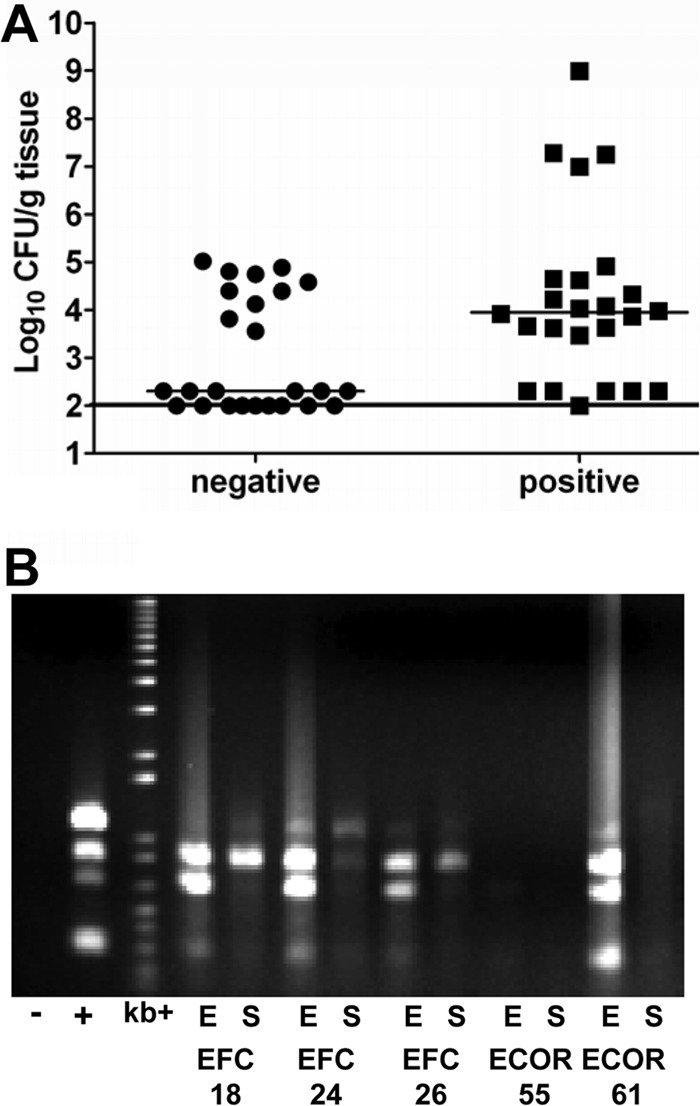
Human fecal isolates that encode and express the four predictor genes more efficiently colonize the mouse bladder in the murine model of ascending UTI than isolates that do not encode the predictor genes. (A) Individual in vivo challenge of the murine model of ascending UTI (five mice/strain) with five human fecal E. coli isolates (EFC18, EFC24, EFC26, ECOR55, and ECOR61) that encode yfcV, vat, fyuA, and chuA (positive) and five that encode none of the predictor genes (negative, EFC7, EFC9, EFC14, EFC22, and ECOR5). (B) Multiplex PCR of the predictor genes using cDNA from the human fecal E. coli isolates used in the in vivo study (EFC18, EFC24, EFC26, ECOR55, and ECOR61) cultured in human urine as the template. Lanes: −, no-template control; +, positive genomic DNA control from UTI89; kb+, 1-kb-plus ladder; E, exponential phase; S, stationary phase.
Fecal isolates that contain all four predictor genes express them in human urine.
The five human fecal isolates containing yfcV, vat, fyuA, and chuA used in the murine in vivo study were cultured in human urine, and RNA was extracted from bacteria in midexponential and stationary phases. Reverse transcription-PCR followed by diagnostic multiplex PCR was performed to determine if these genes are expressed when the bacteria are cultured in human urine. Four of the five isolates expressed yfcV, vat, fyuA, and chuA during mid-exponential phase (Fig. 3B). In stationary phase, expression was reduced, demonstrating that these genes are differentially regulated during growth.
DISCUSSION
A diagnostic test to predict potential for urovirulence would greatly benefit the population of women plagued by recurrent infections. Testing could determine whether patients are commensally colonized in their gastrointestinal tract with UPEC isolates that could be the source of recurrent UTI. The presence of virulence factor genes better predicts experimental virulence than isolation source or phylogenetic group (14, 17, 31); therefore, we developed an assay for genes that are highly prevalent in UPEC and correlate with strains that colonize the urinary tract. Here we demonstrate that the presence of four genes, yfcV, vat, fyuA, and chuA, predicts whether isolates can colonize the bladder more efficiently than E. coli isolates without these genes. While isolates with a PG score of 4 make up only 65% of all UPEC strains tested, these strains encode, on average, 17.5 additional virulence factors. Therefore, isolates with a PG score of 4 may be highly virulent. The sensitivity and specificity are probably underestimated for the multiplex PCR assay used to predict whether isolates are UPEC, as UPEC isolates can commensally colonize the gastrointestinal tract, and therefore, some of the human fecal isolates in this study are likely uropathogens.
Previously, the presence of two or more of papA (and/or papC), afa-dra, sfa-foc, kpsM II, and iutA was used to molecularly define isolates as ExPEC (15, 16, 27). Comparison of our multiplex PCR assay, where a PG score of 3 or 4 is indicative of UPEC, with the ExPEC multiplex assay on 202 E. coli strains (57 human fecal, 32 animal fecal, 37 cystitis, and 76 pyelonephritis strains) demonstrated that our assay predicted that 113 isolates were UPEC, whereas the ExPEC assay predicted that 95 isolates were ExPEC, with 80 isolates predicted to be ExPEC by both assays. Furthermore, the virulence gene profile for predicted UPEC and ExPEC isolates was similar (means = 16.2 and 15.7, respectively), and isolates predicted by both assays encode the most virulence genes (mean = 17.2). The additional UPEC isolates predicted by our assay had more virulence genes (mean = 14.6) than the predicted ExPEC isolates missed by our assay (mean = 9.6), again suggesting that our assay tests for highly virulent strains.
One caveat that should be mentioned is that ABU strains, which do not cause disease, test positive by this and any multiplex assay that screens for genomic carriage of urovirulence factors. However, ABU strains are still able to colonize the human urinary tract. Therefore, our assay still differentiates strains that may colonize the urinary tract from those that cannot. While 33% of the fecal isolates in our collection were positive by our test, we believe that the results show that isolates bearing these genes have potential to colonize the urinary tract and thus are important for consideration when treating patients with recurrent UTIs. Here we have shown that fecal isolates that tested positive for all four predictor genes were better able to colonize the bladder than fecal isolates that tested negative for the predictor genes, thereby experimentally determining that strains bearing the four predictors are urovirulent in the murine model of ascending UTI.
The ability to differentiate UPEC from APEC was not surprising, as previous work has determined that APEC strains are different from human ExPEC strains (19). However, the ability of yfcV to differentiate UPEC from APEC is novel. The presence of the putative fimbrial subunit gene yfcV was highly predictive of UPEC, increasing the odds of a strain being UPEC by 99.5-fold, and the presence of the yersiniabactin receptor gene fyuA increased the odds of a strain being UPEC by 5.2 times. On the other hand, the presence of the toxin-encoding gene vat was predictive of an isolate being APEC, decreasing the odds of a strain being UPEC by 0.008.
The PG score was predictive of UPEC, as the PG score increased the odds that the isolate is UPEC. The PG score separated our strain collection into three groups: UPEC and NMEC had the highest PG scores, human commensal and APEC isolates had intermediate PG scores, and DEC and animal commensal isolates had the lowest PG scores. Furthermore, APEC and human commensal E. coli isolates were the most genotypically diverse groups of E. coli tested, consistent with previous work (3), demonstrating a high degree of variation in the presence or absence of yfcV, vat, fyuA, and chuA.
The broad prevalence of the predictor genes in highly virulent UPEC isolates could indicate that the protein products of these genes would be good vaccine targets for prevention of UTI. Here we have shown that all four genes are expressed in human urine, suggesting that the products of these genes are present during human UTI and may therefore be exposed antigens. Both iron receptors are expressed during UTI and induce an antibody response (1, 8). Currently, we are studying the efficacy of using the two iron receptors FyuA and ChuA, among other antigens, as vaccine targets (1). FyuA mediates yersiniabactin uptake (9), while ChuA mediates direct heme uptake (36). While functional redundancy exists in the iron acquisition systems of UPEC, ChuA and FyuA are two receptors that contribute the most during infection. As in the cochallenge model of ascending UTI, the fyuA and chuA deletion mutants are outcompeted by deletion mutants of the other iron receptors (6).
Vat is a chromosomally encoded autotransporter vacuolating toxin that is found in both UPEC and APEC isolates (26). Another autotransporter, called Tsh, is encoded on a plasmid that is prevalent in APEC isolates and is a hemagglutinin and protease. Because the two proteins share 78% amino acid identity, Vat has in the past been called Tsh (10, 29). However, previous work has shown that vat (tsh) is highly associated with UPEC isolates compared to fecal E. coli strains and vat (tsh) is expressed during infection (10). Furthermore, it has been suggested that vat (tsh) delays neutrophil infiltration of the urinary tract in response to UPEC by cleaving surface glycoproteins from leukocytes that are involved in neutrophil attraction and migration (30).
Likewise, there is some confusion about the fimbrial protein YfcV. The gene is chromosomally encoded and naturally expressed in the laboratory by UPEC isolates, but a gene also called yfcV is found in E. coli K-12. However, yfcV in E. coli K-12 is cryptic, and so no condition under which it is expressed is known (21). Also, there is only 70% amino acid identity between the YfcV in E. coli CFT073 and the YfcV in E. coli K-12, whereas between UPEC isolates such as E. coli CFT073 and E. coli UTI89, there is 100% identity. Thus, the primers used in this study were specific to the yfcV gene found in UPEC isolates.
When examining the ECOR collection for association of the four genes in the multiplex with E. coli phylogroups, all four genes were highly associated in the B2 and D phylogroups and rarely found in either the A or B1 phylogroup. Although only four strains representing phylogroup E are present in the ECOR collection, chuA was found in all four isolates and fyuA was found in one of the isolates. Therefore, these genes are highly associated with the B2 and D phylogroups into which the majority of ExPEC isolates are categorized. Here we have developed a diagnostic multiplex PCR to predict carriers of uropathogenic E. coli. This test could help physicians plan how to treat women suffering with recurrent UTI, as they may carry a reservoir of UPEC in their gastrointestinal tracts that can recolonize the urinary tract causing new UTIs. Further study characterizing the role of the Yfc fimbriae in uropathogenesis is ongoing.
Supplementary Material
ACKNOWLEDGMENTS
This work is supported by Public Health Service grants AI43363, AI59722, and DK94777 from the National Institutes of Health (to H.L.T.M.) and by the Office of Research and Development, Medical Research Service, U.S. Department of Veterans Affairs (to J.R.J.). J.R.J. has research support from Merck, Rochester Medical, and Syntiron.
Footnotes
Published ahead of print 10 September 2012
Supplemental material for this article may be found at http://iai.asm.org/.
REFERENCES
- 1. Alteri CJ, Hagan EC, Sivick KE, Smith SN, Mobley HL. 2009. Mucosal immunization with iron receptor antigens protects against urinary tract infection. PLoS Pathog. 5:e1000586 doi:10.1371/journal.ppat.1000586 [DOI] [PMC free article] [PubMed] [Google Scholar]
- 2. Bokete TN, et al. 1997. Genetic and phenotypic analysis of Escherichia coli with enteropathogenic characteristics isolated from Seattle children. J. Infect. Dis. 175:1382–1389 [DOI] [PubMed] [Google Scholar]
- 3. Caugant DA, et al. 1983. Genetic diversity and relationships among strains of Escherichia coli in the intestine and those causing urinary tract infections. Prog. Allergy 33:203–227 [DOI] [PubMed] [Google Scholar]
- 4. Colwell RK. 2009. User's guide to EstimateS version 8.2. viceroy.eeb.uconn.edu/EstimateS/ University of Connecticut, Storrs, CT [Google Scholar]
- 5. Foxman B. 2003. Epidemiology of urinary tract infections: incidence, morbidity, and economic costs. Dis. Mon. 49:53–70 [DOI] [PubMed] [Google Scholar]
- 6. Garcia EC, Brumbaugh AR, Mobley HL. 2011. Redundancy and specificity of Escherichia coli iron acquisition systems during urinary tract infection. Infect. Immun. 79:1225–1235 [DOI] [PMC free article] [PubMed] [Google Scholar]
- 7. Hagan EC, Lloyd AL, Rasko DA, Faerber GJ, Mobley HL. 2010. Escherichia coli global gene expression in urine from women with urinary tract infection. PLoS Pathog. 6:e1001187 doi:10.1371/journal.ppat.1001187 [DOI] [PMC free article] [PubMed] [Google Scholar]
- 8. Hagan EC, Mobley HL. 2007. Uropathogenic Escherichia coli outer membrane antigens expressed during urinary tract infection. Infect. Immun. 75:3941–3949 [DOI] [PMC free article] [PubMed] [Google Scholar]
- 9. Heesemann J, et al. 1993. Virulence of Yersinia enterocolitica is closely associated with siderophore production, expression of an iron-repressible outer membrane polypeptide of 65,000 Da and pesticin sensitivity. Mol. Microbiol. 8:397–408 [DOI] [PubMed] [Google Scholar]
- 10. Heimer SR, Rasko DA, Lockatell CV, Johnson DE, Mobley HL. 2004. Autotransporter genes pic and tsh are associated with Escherichia coli strains that cause acute pyelonephritis and are expressed during urinary tract infection. Infect. Immun. 72:593–597 [DOI] [PMC free article] [PubMed] [Google Scholar]
- 11. Hooton TM, et al. 2000. A prospective study of asymptomatic bacteriuria in sexually active young women. N. Engl. J. Med. 343:992–997 [DOI] [PubMed] [Google Scholar]
- 12. Johnson DE, Lockatell CV, Hall-Craigs M, Mobley HL, Warren JW. 1987. Uropathogenicity in rats and mice of Providencia stuartii from long-term catheterized patients. J. Urol. 138:632–635 [DOI] [PubMed] [Google Scholar]
- 13. Johnson JR, Clabots C, Kuskowski MA. 2008. Multiple-host sharing, long-term persistence, and virulence of Escherichia coli clones from human and animal household members. J. Clin. Microbiol. 46:4078–4082 [DOI] [PMC free article] [PubMed] [Google Scholar]
- 14. Johnson JR, et al. 2006. Experimental mouse lethality of Escherichia coli isolates, in relation to accessory traits, phylogenetic group, and ecological source. J. Infect. Dis. 194:1141–1150 [DOI] [PubMed] [Google Scholar]
- 15. Johnson JR, Delavari P, Kuskowski M, Stell AL. 2001. Phylogenetic distribution of extraintestinal virulence-associated traits in Escherichia coli. J. Infect. Dis. 183:78–88 [DOI] [PubMed] [Google Scholar]
- 16. Johnson JR, et al. 2003. Isolation and molecular characterization of nalidixic acid-resistant extraintestinal pathogenic Escherichia coli from retail chicken products. Antimicrob. Agents Chemother. 47:2161–2168 [DOI] [PMC free article] [PubMed] [Google Scholar]
- 17. Johnson JR, Stell AL. 2000. Extended virulence genotypes of Escherichia coli strains from patients with urosepsis in relation to phylogeny and host compromise. J. Infect. Dis. 181:261–272 [DOI] [PubMed] [Google Scholar]
- 18. Johnson TJ, et al. 2008. Identification of minimal predictors of avian pathogenic Escherichia coli virulence for use as a rapid diagnostic tool. J. Clin. Microbiol. 46:3987–3996 [DOI] [PMC free article] [PubMed] [Google Scholar]
- 19. Johnson TJ, et al. 2008. Comparison of extraintestinal pathogenic Escherichia coli strains from human and avian sources reveals a mixed subset representing potential zoonotic pathogens. Appl. Environ. Microbiol. 74:7043–7050 [DOI] [PMC free article] [PubMed] [Google Scholar]
- 20. Kohler CD, Dobrindt U. 2011. What defines extraintestinal pathogenic Escherichia coli? Int. J. Med. Microbiol. 301:642–647 [DOI] [PubMed] [Google Scholar]
- 21. Korea CG, Badouraly R, Prevost MC, Ghigo JM, Beloin C. 2010. Escherichia coli K-12 possesses multiple cryptic but functional chaperone-usher fimbriae with distinct surface specificities. Environ. Microbiol. 12:1957–1977 [DOI] [PubMed] [Google Scholar]
- 22. Lomberg H, Hellstrom M, Jodal U, Svanborg Eden C. 1989. Secretor state and renal scarring in girls with recurrent pyelonephritis. FEMS Microbiol. Immunol. 1:371–375 [DOI] [PubMed] [Google Scholar]
- 23. Mobley HL, et al. 1990. Pyelonephritogenic Escherichia coli and killing of cultured human renal proximal tubular epithelial cells: role of hemolysin in some strains. Infect. Immun. 58:1281–1289 [DOI] [PMC free article] [PubMed] [Google Scholar]
- 24. Murray AC, Kuskowski MA, Johnson JR. 2004. Virulence factors predict Escherichia coli colonization patterns among human and animal household members. Ann. Intern. Med. 140:848–849 [DOI] [PubMed] [Google Scholar]
- 25. Ochman H, Selander RK. 1984. Standard reference strains of Escherichia coli from natural populations. J. Bacteriol. 157:690–693 [DOI] [PMC free article] [PubMed] [Google Scholar]
- 26. Parham NJ, et al. 2005. Distribution of the serine protease autotransporters of the Enterobacteriaceae among extraintestinal clinical isolates of Escherichia coli. J. Clin. Microbiol. 43:4076–4082 [DOI] [PMC free article] [PubMed] [Google Scholar]
- 27. Picard B, et al. 1999. The link between phylogeny and virulence in Escherichia coli extraintestinal infection. Infect. Immun. 67:546–553 [DOI] [PMC free article] [PubMed] [Google Scholar]
- 28. Reid SD, Betting DJ, Whittam TS. 1999. Molecular detection and identification of intimin alleles in pathogenic Escherichia coli by multiplex PCR. J. Clin. Microbiol. 37:2719–2722 [DOI] [PMC free article] [PubMed] [Google Scholar]
- 29. Restieri C, Garriss G, Locas MC, Dozois CM. 2007. Autotransporter-encoding sequences are phylogenetically distributed among Escherichia coli clinical isolates and reference strains. Appl. Environ. Microbiol. 73:1553–1562 [DOI] [PMC free article] [PubMed] [Google Scholar]
- 30. Ruiz-Perez F, et al. 2011. Serine protease autotransporters from Shigella flexneri and pathogenic Escherichia coli target a broad range of leukocyte glycoproteins. Proc. Natl. Acad. Sci. U. S. A. 108:12881–12886 [DOI] [PMC free article] [PubMed] [Google Scholar]
- 31. Sannes MR, Kuskowski MA, Owens K, Gajewski A, Johnson JR. 2004. Virulence factor profiles and phylogenetic background of Escherichia coli isolates from veterans with bacteremia and uninfected control subjects. J. Infect. Dis. 190:2121–2128 [DOI] [PubMed] [Google Scholar]
- 32. Smith JL, Fratamico PM, Gunther NW. 2007. Extraintestinal pathogenic Escherichia coli. Foodborne Pathog. Dis. 4:134–163 [DOI] [PubMed] [Google Scholar]
- 33. Spurbeck RR, et al. 2011. Fimbrial profiles predict virulence of uropathogenic Escherichia coli strains: contribution of ygi and yad fimbriae. Infect. Immun. 79:4753–4763 [DOI] [PMC free article] [PubMed] [Google Scholar]
- 34. Stapleton A, Moseley S, Stamm WE. 1991. Urovirulence determinants in Escherichia coli isolates causing first-episode and recurrent cystitis in women. J. Infect. Dis. 163:773–779 [DOI] [PubMed] [Google Scholar]
- 35. Tamura K, et al. 2011. MEGA5: molecular evolutionary genetics analysis using maximum likelihood, evolutionary distance, and maximum parsimony methods. Mol. Biol. Evol. 28:2731–2739 [DOI] [PMC free article] [PubMed] [Google Scholar]
- 36. Torres AG, Redford P, Welch RA, Payne SM. 2001. TonB-dependent systems of uropathogenic Escherichia coli: aerobactin and heme transport and TonB are required for virulence in the mouse. Infect. Immun. 69:6179–6185 [DOI] [PMC free article] [PubMed] [Google Scholar]
- 37. Vigil PD, et al. 2011. Presence of putative repeat-in-toxin gene tosA in Escherichia coli predicts successful colonization of the urinary tract. mBio 2(3):e00066-11 doi:10.1128/mBio.00066-11 [DOI] [PMC free article] [PubMed] [Google Scholar]
- 38. Warren JW, et al. 1983. A randomized, controlled trial of cefoperazone vs. cefamandole-tobramycin in the treatment of putative, severe infections with gram-negative bacilli. Rev. Infect. Dis. 5(Suppl 1):S173–S180 [DOI] [PubMed] [Google Scholar]
- 39. Warren JW, Tenney JH, Hoopes JM, Muncie HL, Anthony WC. 1982. A prospective microbiologic study of bacteriuria in patients with chronic indwelling urethral catheters. J. Infect. Dis. 146:719–723 [DOI] [PubMed] [Google Scholar]
- 40. Winsor DK, Jr, Ashkenazi S, Chiovetti R, Cleary TG. 1992. Adherence of enterohemorrhagic Escherichia coli strains to a human colonic epithelial cell line (T84). Infect. Immun. 60:1613–1617 [DOI] [PMC free article] [PubMed] [Google Scholar]
- 41. Yao Y, Xie Y, Kim KS. 2006. Genomic comparison of Escherichia coli K1 strains isolated from the cerebrospinal fluid of patients with meningitis. Infect. Immun. 74:2196–2206 [DOI] [PMC free article] [PubMed] [Google Scholar]
Associated Data
This section collects any data citations, data availability statements, or supplementary materials included in this article.