

Abstract
Multidrug-resistant tuberculosis has emerged as a major threat to tuberculosis control. Phylogenetically related rifampin-resistant actinomycetes with mutations mapping to clinically dominant Mycobacterium tuberculosis mutations in the rpoB gene show upregulation of gene networks encoding secondary metabolites. We compared the expressed proteomes and metabolomes of two fully drug-susceptible clinical strains of M. tuberculosis (wild type) to those of their respective rifampin-resistant, rpoB mutant progeny strains with confirmed rifampin monoresistance following antitubercular therapy. Each of these strains was also used to infect gamma interferon- and lipopolysaccharide-activated murine J774A.1 macrophages to analyze transcriptional responses in a physiologically relevant model. Both rpoB mutants showed significant upregulation of the polyketide synthase genes ppsA-ppsE and drrA, which constitute an operon encoding multifunctional enzymes involved in the biosynthesis of phthiocerol dimycocerosate and other lipids in M. tuberculosis, but also of various secondary metabolites in related organisms, including antibiotics, such as erythromycin and rifamycins. ppsA (Rv2931), ppsB (Rv2932), and ppsC (Rv2933) were also found to be upregulated more than 10-fold in the Beijing rpoB mutant strain relative to its wild-type parent strain during infection of activated murine macrophages. In addition, metabolomics identified precursors of phthiocerol dimycocerosate, but not the intact molecule itself, in greater abundance in both rpoB mutant isolates. These data suggest that rpoB mutation in M. tuberculosis may trigger compensatory transcriptional changes in secondary metabolism genes analogous to those observed in related actinobacteria. These findings may assist in developing novel methods to diagnose and treat drug-resistant M. tuberculosis infections.
INTRODUCTION
Approximately 9 million people develop active tuberculosis (TB) each year, resulting in nearly 2 million deaths annually (75). Recent progress controlling drug-susceptible TB has been made in many regions (50); however, drug resistance in Mycobacterium tuberculosis, including strains resistant to both first-line drugs, isoniazid and rifampin (multidrug-resistant [MDR] TB), has emerged as a threat to TB control worldwide (26, 65). Although international surveillance systems are inadequate, data from over 80 countries indicate that approximately 1 in 10 new cases of active TB have primary drug resistance (77), and MDR TB has been reported in essentially every country in which drug resistance has been studied (76). Treatment of MDR TB requires the use of costly and toxic second-line drugs for nearly 2 years and is associated with high rates of morbidity and mortality (65), which makes the spread of drug-resistant TB a major public health concern.
Drug resistance in M. tuberculosis is due primarily to single-nucleotide polymorphisms in genes encoding key mycobacterial enzymes (6). The rpoB gene encodes the β-subunit of bacterial RNA polymerase, which is the target of rifampin (12, 41). Mutations in this gene account for over 95% of clinical cases of rifampin resistance (70) and are commonly associated with the presence of MDR TB (27, 65). Although some rifampin-resistant strains demonstrate mild in vitro fitness losses compared to wild-type (WT) parental strains, the most common M. tuberculosis clinical strains containing the most frequent rpoB mutations (e.g., the S531L mutation) tend to exhibit little or no fitness defects, suggesting that certain M. tuberculosis isolates are capable of overcoming, at least to some extent, initial fitness deficiencies associated with antibiotic resistance (24, 25). Bergval et al. reported a 2- to 5-fold induction of the stress response gene dnaE2 (but not recA) in four of six rpoB mutants of M. tuberculosis compared to their wild-type isogenic parent strains using reverse transcription (RT)-PCR (5). However, relatively little is known about M. tuberculosis adaptive mechanisms, which may compensate for mutations in rpoB. Recently, compensatory mutations in RNA polymerase genes in rpoB mutant isolates of M. tuberculosis have been identified by comparative genomics (18).
Specific gene upregulation associated with rpoB mutation has been observed in numerous model organisms, including Streptomyces spp., which are environmental organisms phylogenetically related to M. tuberculosis (35, 37, 69). Moreover, upregulation of certain gene clusters via rpoB mutation has been used in actinomycetes as a way to discover new secondary metabolites, including antibiotics (34). This suggests that rpoB mutation may have analogous effects on specific gene upregulation in M. tuberculosis. The M. tuberculosis genome has an extensive array of polyketide synthase genes (17), which have been shown in other bacteria to be involved in the biosynthesis of secondary metabolites, including rifamycins (28). rpoB is an essential gene in M. tuberculosis, and clinically relevant rpoB mutations occur near the DNA-RNA channel of bacterial RNA polymerase (12, 64). We hypothesized that rpoB mutations would lead to altered expression of specific genes/proteins in rifampin-resistant strains. In the current study, we compared the proteomes and metabolomes of paired wild-type and rpoB mutant M. tuberculosis clinical isolates to identify possible compensatory mechanisms important to drug-resistant isolates of the pathogen. Identification of these pathways may yield new drug targets and diagnostics that can improve treatment of patients infected with rifampin-resistant M. tuberculosis isolates.
MATERIALS AND METHODS
M. tuberculosis strains.
All M. tuberculosis strains were obtained from patients being treated for pulmonary TB. Isolates were sent to National Jewish Hospital, Denver, CO, for confirmation of drug susceptibility data that were initially obtained by the clinical laboratories where the patients were being treated. An M. tuberculosis strain susceptible to all drugs tested (rifampin, isoniazid, pyrazinamide, and ethambutol) was obtained from a patient living in Costa Rica prior to initiating antitubercular therapy. Another isolate was later obtained from the same patient after several weeks on treatment and was confirmed to be resistant to rifampin by the agar proportion test (MIC > 1 mg/liter) but susceptible to the other 3 first-line agents. These isolates were a parent-mutant pair by spoligotyping and insertion sequence 6110 (IS6110) restriction fragment length polymorphism (RFLP) pattern. Spoligotyping analysis determined that these isolates belong to the Beijing family. Analysis of genomic DNA from these strains revealed an H445D mutation in the rpoB gene of the rifampin-resistant isolate. Both isolates also had an A463G mutation in katG but were confirmed to be susceptible to isoniazid (MIC < 0.2 mg/liter), and these mutations were considered clinically silent (31, 60). Similarly, an M. tuberculosis strain susceptible to all drugs tested (rifampin, isoniazid, pyrazinamide, and ethambutol) was obtained from a patient in San Francisco prior to initiating standard first-line antitubercular therapy. After several weeks on therapy, another isolate was obtained from the same patient and was confirmed to be resistant to rifampin by an agar proportion test (as described above) but susceptible to the other 3 first-line agents. These isolates were also confirmed as paired by spoligotyping and IS6110 RFLP and were determined to belong to the Haarlem family. Analysis of genomic DNA from these two Haarlem isolates revealed that the rifampin-resistant isolate had an S450L mutation in the rpoB gene. Both isolates also had a mutation at position 103 of the rpoB gene, and the wild-type strain had an additional mutation at position 108 of oryR. The rpoB mutations present in the resistant isolates are two of the most common rifampin resistance mutations encountered clinically in adults with TB (70).
For laboratory-based rpoB mutant generation used in confirmatory experiments, an exponentially growing culture of the Johns Hopkins University wild-type laboratory reference strain M. tuberculosis CDC1551 (1) was inoculated onto 7H10 agar containing 1 μg/ml rifampin and incubated at 37°C for 21 days. Individual colonies were inoculated separately in Middlebrook 7H9 broth containing 1 μg/ml rifampin and grown at 37°C to an optical density at 600 nm (OD600) of ∼1.0. Genomic DNA was purified from each culture, and the rpoB gene was amplified using primers 5′-AATATCTGGTCCGCTTGCAC-3′ and 5′-ACACGATCTCGTCGCTAACC-3′ and sequenced. Based on the sequencing results, a mutant containing a substitution of G for C at bp 1351 in the rpoB gene (yielding the RpoB S450L mutation) was selected for further study.
Culture conditions.
For proteomics studies, a glycerol stock of each strain was plated in Middlebrook 7H11 (Difco) supplemented with oleic acid-albumin-dextrose-catalase (OADC). After incubation for 2 weeks at 37°C, colonies were inoculated in 100 ml of Middlebrook 7H9 (Difco) supplemented with OADC and 0.05% Tween. The mycobacteria were further cultured at 37°C with agitation for 2 weeks and then washed twice with sterile phosphate-buffered saline (PBS) (Invitrogen) and inoculated in 1 liter of GAS (glycerol, alanine, salts) medium (68), a traditional Mycobacterium sp. medium used to process cells and spent filtrate for downstream proteomics applications (4, 55, 63). The cultures were then incubated at 37°C with agitation for 4 weeks. All cultures were prepared in triplicate for proteomics analyses. For metabolomics studies, a glycerol stock of each strain was plated in Middlebrook 7H11 (Difco) supplemented with OADC. The cultures were incubated at 37°C for 4 weeks. Five replicates per strain were prepared for metabolomics studies.
CFP.
Proteomics data were obtained within specific cellular fractions, consisting of culture filtrate (CFP), membrane-associated (MEM), cell wall (CW), and cytoplasm (CYT) proteins. CFP was purified as described elsewhere (55). Briefly, each culture was filtered using a 0.2-μm Whatman zap-cap filter (GE Healthcare, Piscataway, NJ). The secreted proteins were recovered from the culture filtrate as follows: 1 liter culture filtrates was concentrated to approximately 25-ml volume using a 10-kDa molecular mass cutoff membrane (Millipore). Then, the filtrate was further concentrated to approximately 300 μl using an Amicon Ultracell-15 with a 10,000 molecular weight cutoff by centrifugation at 3,000 rpm at 4°C. The purified proteins were subjected to buffer exchange using 15 ml of 10 mM ammonium bicarbonate three times in the same filter unit. Protein quantification was performed by the bicinchoninic acid (BCA) assay (Pierce).
Subcellular fractions.
Cells were pelleted by centrifugation at 3,000 rpm and washed twice with 10 ml of sterile PBS (Invitrogen). The harvested cells were inactivated with 2.4 Mrad of cesium gamma irradiation for 24 h, and death was confirmed by alamarBlue assay (Invitrogen). The cells were resuspended in 10 ml of breaking buffer (1 mM EDTA-PBS supplemented with one tablet of protease inhibitor [Roche Diagnostics] per 50 ml of buffer, 60 μl of DNase [1 mg/ml], and 60 μl of RNase [1 mg/ml]) and broken by sonication on a 50% duty cycle (12 times; 60 s with intervals of 90 s on ice). After sonication, breaking buffer was added to a final volume of 40 ml, and unbroken cells were removed by centrifugation at 3,000 rpm for 5 min at 4°C. The supernatant was further centrifuged for 1 h at 27,000 × g at 4°C to separate the cell wall pellet from the cytosol and membrane fractions (supernatant). The cell wall pellet was resuspended in 10 mM ammonium bicarbonate and stored at −80°C. Finally, membrane proteins were harvested by ultracentrifugation at 100,000 × g for 8 h (2 times for 4 h each time). The cytosol fraction (supernatant) was concentrated by centrifugation using Amicon Ultra-15 centrifugal filter units with a 10-kDa molecular mass cutoff. Buffer exchange using 15 ml of 10 mM ammonium bicarbonate was performed three times using the same filter unit. The membrane fraction was resuspended in 10 mM ammonium bicarbonate and stored at −20°C. All subcellular fractions were quantified using the BCA assay (Pierce).
In-solution protein digestion.
Fifty micrograms of the CFP, MEM, and CYT fractions was precipitated with acetone following standard protocols. The protein pellets were resuspended in 15 μl of 8 M urea, followed by addition of 20 μl of 0.2% ProteaseMax Surfactant (Promega) in 50 mM ammonium bicarbonate. After vortexing for 5 min, 58.5 μl of 50 mM ammonium bicarbonate was added to each sample. Proteins were reduced after incubation at 50°C for 20 min with 5 mM dithiothreitol (DTT). Alkylation was performed with 15 mM iodoacetamide, followed by incubation at room temperature for 15 min in the dark. Samples were digested for 3 h at 37°C with 1 μl of 1% ProteaseMax Surfactant (Promega) in 50 mM ammonium bicarbonate and 1.8 μg of trypsin. Reactions were stopped with 0.5% trifluoroacetic acid (TFA). All samples were desalted with Pierce PepClean C18 spin columns according to the manufacturer's protocol and eluted with 70% acetonitrile (ACN), 0.1% formic acid (FA). Samples were dried in a SpeedVac and resuspended in 5% ACN, 0.1% FA prior to mass spectrometry analysis. Biological replicates within each cellular fraction were randomized and injected in triplicate. Mass spectrometry analysis was performed at the Proteomics and Metabolomics Facility, Colorado State University, Pueblo, CO.
CW proteins were subjected to a delipidation protocol before digestion as follows. Ten micrograms of lysozyme was added to 1 mg of CW proteins and incubated for 30 min at 37°C. Samples were dried in a SpeedVac and resuspended in 7 ml of chloroform-methanol (2:1 [vol/vol]), followed by incubation at room temperature for 1 h and centrifugation at 3,000 rpm for 30 min at 4°C. The pelleted proteins were dried and resuspended in 7 ml of chloroform-methanol-water (10:10:3), followed by incubation with agitation at room temperature for 1 h and centrifugation at 3,000 rpm for 2 h at 4°C. Finally, the pelleted proteins were precipitated with 2 ml of cold acetone and incubated overnight at −20°C. After centrifugation at 13,000 rpm for 30 min, the protein pellet was resuspended in 10 mM ammonium bicarbonate, and quantification was performed using the BCA assay (Pierce). Fifty micrograms of sample was subjected to trypsin digestion as described above.
LC–MS-MS for proteomics studies.
All samples were randomized and analyzed in triplicate by liquid chromatography coupled with tandem mass spectrometry (LC–MS-MS). Briefly, peptides were purified and concentrated using an on-line enrichment column (Agilent Zorbax C18; 5 μm; 5 by 0.3 mm). Subsequent chromatographic separation was performed on a reverse-phase nanospray column (Agilent 1100 nanoHPLC; Zorbax C18; 5 μm; 75-μm inside diameter [ID] by 150-mm column) using a 60-min linear gradient from 25% to 55% buffer B (90% ACN, 0.1% formic acid) at a flow rate of 300 nl/min. Peptides are eluted directly into the mass spectrometer (Thermo Scientific Linear Trap Quadrupole [LTQ] linear ion trap), and spectra are collected over an m/z range of 200 to 2,000 Da using a dynamic-exclusion limit of 2 MS-MS spectra of a given peptide mass for 30 s (exclusion duration, 90 s). Compound lists of the resulting spectra were generated using Bioworks 3.2 software (Thermo Scientific) with an intensity threshold of 5,000 and 1 scan/group.
Spectra were subjected to interrogation against the M. tuberculosis genome (including the reverse strand) (GenBank accession number AL123456, R9; 7,982 entries) using SORCERER (Sage-N Research, version 2.0) and SEQUEST (Thermo Fisher Scientific, release 27, revision 12). All searches were performed assuming trypsin digestion, 4 missed cleavages, a fragment ion mass tolerance of 1.00 Da, and a parent ion tolerance of 1.5 Da. Carbamidomethyl (C) and oxidation (M) were specified as variable modifications. Analyses (per subcellular fraction) were compiled in Scaffold (version 3.00.04; Proteome Software Inc., Portland, OR) in order to validate MS-MS-based peptide and protein identification. Search results for triplicate injections of each biological replicate were summed together upon compilation within the Scaffold software. In addition, the X! Tandem database search algorithm (version 2007.01.01.2; The Global Proteome Machine [http://www.thegpm.org]) was used to verify and complement the peptide identifications from Sequest. Peptide identifications were filtered by database search engine thresholds, so that Sequest identifications required deltaCn scores greater than 0.10 and XCorr scores greater than 1.0, 2.0, 3.0, and 3.0 for singly, doubly, triply, and quadruply charged peptides, respectively. X! Tandem identifications required −Log(Expect Scores) scores greater than 2.0. Protein identifications were accepted if they could be established at greater than 99.0% probability (Protein Prophet algorithm) and contained at least 1 unique peptide (45). False-discovery rates (FDR) were calculated automatically by Scaffold (version 3.0) using the decoy database and reverse hits and the empirical method previously reported by Kall et al. (42). Analysis of each data set using these parameters resulted in FDR of 0.2% at the protein level and less than 5.3% at the peptide level. After statistical analysis, different proteins that were identified by only one unique peptide were subjected to manual spectral validation using the following criteria: (i) a minimum of 80% coverage of theoretical y or b ions (at least 5 in consecutive order), (ii) absence of prominent unassigned peaks at greater than 10% of the maximum intensity, and (iii) indicative residue-specific fragmentation, such as intense ions proximal (N-terminal) to proline and immediately distal (C-terminal) to aspartate and glutamate. The data, exported as Mascot generic files and containing all MS-MS spectra, are available in the PRoteomics IDEntifications database for review (74).
Proteomic data analysis.
Each subcellular fraction data set was subjected to spectral-count analysis using Scaffold (version 3.00.04; Proteome Software Inc., Portland, OR). Technical replicates for each biological replicate were summed within the Scaffold software, and each subcellular fraction data set was analyzed independently. Prior to all analyses of differential protein detection, spectral counts were normalized against the total signal (per biological replicate) as described previously (14). Using spectral counts, differential protein detection was assessed in multiple ways. First, after normalization, the data were log transformed, and a linear-model analysis of variance (ANOVA) comparing spectral counts for each protein within subcellular fractions for each isogenic pair was applied to identify proteins that were differentially abundant between susceptible and resistant isolates (P value < 0.05). Comparison of spectral counts was performed using DanteR (version 1.0.1.1; Pacific Northwest National Laboratory [http://omics.pnl.gov]). The reproducibility of biological replicates was assessed by visual interpretation of each data set using box plots and three-dimensional (3D) scatter plots generated on DanteR.
In addition, to ascertain global differences in protein detection between rpoB mutant and wild-type isolates, the mean spectral counts in the cell-associated fractions (CW, MEM, and CYT) were added to produce a summary spectral count for each protein. CFP was not included in the summary spectral count, given our interest in measuring differences in overall protein abundance and not secretion. This summary cell-associated spectral count was then used to calculate the fold change in detection for each protein by dividing the mean spectral count in an rpoB mutant by the mean spectral count in the paired wild-type parent isolate. The summary cell-associated spectral counts were also used to calculate the spectral index (SpI), which is a robust statistical measure of differential protein abundance useful in shotgun proteomics experiments (23). We then used the SpI, which ranges from −1 to +1, to rank order the proteins by the degree of increased detection in mutants. SpI values at or near 0 indicate that the relative peptide abundances are approximately the same in the rifampin-resistant and rifampin-susceptible cultures, whereas positive or negative values indicate enrichment in the rifampin-resistant or rifampin-susceptible cultures, respectively (23). With this ranking, we then applied gene set enrichment analysis (GSEA) at the functional class level to identify significantly upregulated gene sets in the resistant strains (67). Because rpoB mutation appears to significantly upregulate genes specifically involved in biosynthesis of natural product/secondary metabolites in other organisms (13, 34, 35, 37), we also used an automated approach to search the M. tuberculosis genome for gene clusters potentially associated with natural product biosynthesis (NP.searcher) (http://dna.sherman.lsi.umich.edu/; 49) and compared the expression of these gene clusters by mutants and wild-type M. tuberculosis using GSEA.
Macrophage studies.
The murine macrophage J774A.1 cell line was cultured in RPMI medium supplemented with 0.2 mM l-glutamine (Invitrogen) and 10% heat-inactivated fetal bovine serum (FBS) (Sigma) in a humidified 37°C, 5% CO2 incubator. After growth to a confluent monolayer, the cells were harvested using a sterile rubber scraper, and a single-cell suspension was prepared and cultured in a 75-cm2 cell culture flask (Costar). A total of 103 cells were activated by addition of 50 ng/ml gamma interferon (IFN-γ) (Roche) overnight and 200 ng/ml lipopolysaccharide (LPS) (from Escherichia coli 026:B6; <5% protein [Lowry]; Sigma) for 3 h prior to infection. After removal of the medium, the cells were incubated for 3 h with either wild-type M. tuberculosis or the rpoB mutant at a multiplicity of infection (MOI) of 1:1. The macrophages were then treated with 200 ng/ml streptomycin, washed three times with RPMI, and cultured in medium as described above. For bacterial enumeration for comparison of the growth rates of the mutant and WT isolates, the cells were lysed with Triton X-100 at predetermined time points, and the lysate was serially diluted and plated on 7H10 agar and incubated at 37°C for 28 days, as previously described (71). For mycobacterial gene expression studies, intracellular bacteria were recovered at 72 h after infection by centrifugation at 3,200 rpm for 5 min, and the bacterial pellet was resuspended in TRIzol reagent (Invitrogen).
M. tuberculosis gene expression studies.
Macrophage and mycobacterial membranes were disrupted using 0.1-mm zirconia/silica beads in a bead beater, and RNA was recovered by centrifugation, chloroform extraction, and isopropyl alcohol precipitation, as previously described (43, 44). Prior to reverse transcription, control and mutant RNAs (10 ng) were treated with RNase-free DNase (Invitrogen) and subjected to 36 cycles of PCR to ensure that all DNA had been removed, as assessed by ethidium bromide-stained agarose gel analysis. Fluorescently labeled cDNA was generated using gene-specific primers (see Table S1 in the supplemental material) and Superscript III (Invitrogen), as previously described (71). cDNA corresponding to each transcript was subjected to 40 cycles of PCR for quantification using the primers listed in Table S2 in the supplemental material and an iCycler 5.0 (Bio-Rad). The cycle threshold (CT) value obtained for each gene of interest (GOI) was normalized with that of sigA, a housekeeping gene (HKG) with constant expression under different experimental conditions (53), in order to obtain the normalized CT [nCT = (GOI CT) − (HKG CT)]. The change in the normalized CT (ΔnCT) for each gene was calculated using the following formula: ΔnCT = C(nCT) − S(nCT), where C represents the wild-type (control) strain and S represents the rpoB mutant strain. The fold regulation of individual genes was calculated using the following formula: 2−ΔnCT. The data are representative of three biological replicates, and the experiments were repeated twice.
Extraction of M. tuberculosis metabolites.
Mycobacteria were scraped at 4 weeks of culture and transferred to a glass tube; 10 ml of chloroform was added to each sample and then incubated at room temperature in agitation for 4 h. The bacteria were pelleted at 3,000 rpm for 30 min at 4°C, and the supernatant corresponding to the chloroform fraction was dried in a nitrogen bath and stored at −20°C. The pelleted bacteria were dried under nitrogen and then resuspended in 15 ml of methanol. Samples were incubated at 37°C overnight with agitation and then centrifuged at 3,000 rpm for 1 h at 4°C. Supernatant corresponding to the methanol fraction was dried under nitrogen and then stored at −20°C. Prior to mass spectrometry analysis, the chloroform and methanol fractions were resuspended in 1 ml of the corresponding solvent.
LC-MS for metabolomics. (i) Methanol fractions.
One microliter of the sample was injected into a Waters Acquity Ultra Performance Liquid Chromatography (UPLC) system equipped with a Waters Acquity UPLC T3 column (1.8 μm; 1.0 by 100 mm). Separation was achieved using a gradient from solvent A (95% water, 5% methanol, 0.1% FA) to solvent B (95% methanol, 5% water, 0.1% FA) as follows: 100% A held for 1 min, 100% B in 16 min, 100% B held for 3 min, 100% A in 0.1 min, and reequilibration for 5.9 min (total run time, 26 min/sample).
(ii) Chloroform fractions.
One microliter of the sample was injected on a Waters Acquity UPLC system equipped with a Waters Acquity UPLC C8 column (1.8 μM; 1.0 by 100 mm). Separation was achieved using a gradient from solvent A (89% water, 5% ACN, 5% isopropanol, 1% 500 mM ammonium acetate) to solvent B (49.5% ACN, 49.5% isopropanol, 1% 500 mM ammonium formate) as follows: 100% A held for 0.1 min, 40% B in 0.9 min, 100% B in 10 min, 100% B held for 3 min, 100% A in 0.1 min, and reequilibration for 5.9 min (total run time, 20 min/sample). MS-MS spectra of precursor ions 797.7 and 823.2 were collected using a Waters UPLC coupled to a Waters Xevo G2 quadrupole-time-of-flight (Q-TOF) MS. The LC conditions were the same as those listed above, and the MS-MS collision energy was ramped from 15 to 30 V to induce fragmentation.
For both fractions, the flow rate was maintained at 140 μl/min for the duration of the run, the column was held at 50°C, and samples were held at 5°C. The column eluate was infused into a Waters Q-TOF Micro MS fitted with an electrospray source. Data were collected in positive ion mode, scanning from 50 to 1,200 (methanol fraction) or 50 to 1,800 (chloroform fraction) at a rate of 0.9 s per scan with 0.1-s interscan delay. Calibration was performed prior to sample analysis via infusion of sodium formate solution, with mass accuracy within 5 ppm. During analysis, the capillary voltage was held at 2,200 V, the source temperature at 130°C, the desolvation temperature at 300°C, the desolvation gas flow rate at 400 liters/h N2 (gas), and the quadrupole at a collision energy of 7 V. The MS-MS spectra of precursor ions 797.7 and 823.2 were collected using a Waters UPLC coupled with a Waters Xevo G2 Q-TOF MS. The LC conditions were the same as those listed above, and the MS-MS collision energy was ramped from 15 to 30 V to induce fragmentation.
(iii) Metabolomics data analysis.
Raw data files were converted to .cdf format, and feature detection and alignment were performed using XCMS in the program R. Raw peak areas were normalized to the total ion signal in R, and the normalized data set was subjected to PCA in R using the pcaMethods package. Consistent with our focus on gene upregulation as a compensatory response to rpoB mutation, statistical analysis to determine peaks/features that were significantly more abundant in resistant strains was performed in DanteR, as described for proteomics above. Differential peaks (ANOVA; P value < 0.05) were grouped by retention time and then manually validated using MassLynx (Waters Corporation). Peaks with the same retention time and peak shape were considered to belong to the same compound. The retention time and the inferred molecular weight of each differential peak was used to interrogate public databases, including METLIN (http://metlin.scripps.edu) (66), KEGG (http://www.genome.jp/kegg/), LipidMaps (http://www.lipidmaps.org), and MassBank (http://www.massbank.jp) (33). Given the proteomics and metabolomics results, a phthiocerol dimycocerosate (PDIM) standard was subjected to tandem mass spectrometry analysis to gain insight into the structure of the m/z 797.74 ion.
TLC.
Two hundred micrograms of lipid fractions was analyzed by thin-layer chromatography (TLC), along with a PDIM standard (10 μg), using 98:2 (vol/vol) petroleum ether-ethyl acetate three times. Lipids were visualized with CuSO4 charring.
RESULTS
Proteomic analysis of rpoB mutant strains of M. tuberculosis.
To compare the proteomes of the Beijing and Haarlem strains of rpoB mutant, rifampin-resistant M. tuberculosis to those of their wild-type progenitor isolates, proteins from four cellular fractions were extracted from late-log-phase broth cultures. By separating the sample into less complex parts, such as subcellular fractions, protein identification using shotgun proteomic analysis is greatly increased (22, 36). In addition, because of the insoluble nature of cell wall proteins, this fraction is subjected to additional preparation prior to mass spectrometry analysis to increase solubility and the number of identified proteins. After digestion into tryptic peptides, each fraction was analyzed independently in triplicate by LC–MS-MS. The spectra were searched against the M. tuberculosis genome, and the total number of unique peptides identified in each cellular fraction of each biological replicate by strain type is shown in Table S3 in the supplemental material. Totals of 452, 1,075, 807, and 735 proteins were confidently identified in the CFP, CW, MEM, and CYT fractions, respectively, of the Haarlem isolates, and 455, 1,072, 760, and 704 proteins were confidently identified in the CFP, CW, MEM, and CYT fractions, respectively, of the Beijing isolates.
Spectral counts for each biological replicate were normalized against the total signal as described previously (14). After normalization and log transformation of the data, a linear-model ANOVA comparing spectral counts for each protein within subcellular fractions for each isogenic pair was applied to identify proteins that were differentially abundant between susceptible and resistant isolates (P value < 0.05). Thirty-two, 44, 21, and 27 proteins with significantly higher spectral counts (P < 0.05) than the wild-type isolate were identified in the CFP, CW, MEM, and CYT fractions, respectively, of the Haarlem rpoB mutant. Similarly, there were 45, 44, 43, and 31 proteins with significantly higher spectral counts detected in the CFP, CW, MEM, and CYT fractions, respectively, of the Beijing rpoB mutant isolate than in those of its wild-type progenitor isolate. A comparison of both rpoB mutants with their respective wild-type rifampin-susceptible parent revealed 10 proteins with statistically significantly (P < 0.05) higher normalized spectral counts (Table 1). All of the products identified at significantly higher spectral counts in the cell wall fractions of both rpoB mutant rifampin-resistant strains represented proteins that are transcriptionally coupled on a 50-kb region involved in the biosynthesis of PDIM in M. tuberculosis (10, 72), including two type I polyketide synthase genes (Rv2933/ppsC and Rv2935/ppsE) and a probable daunorubicin-dimycoserosate (DIM) transport protein (Rv2936/drrA). Other proteins identified in cellular fractions other than the cell wall included a succinate semialdehyde dehydrogenase (Rv0234c), a putative integration host factor (Rv1388/mihF), a probable acyl-coenzyme A (CoA) dehydrogenase (Rv3562/fadE31) involved in lipid degradation, and a polynucleotide phosphorylase/polyadenylase (Rv2783c/gpsI) involved in mRNA degradation. The final three products identified (Rv1056, Rv3038c, and Rv3661) are conserved hypothetical proteins with unknown functions (Table 1). We specifically examined spectral counts of recA and dnaE2 based on a previous study using quantitative RT (qRT)-PCR (5) but did not find increased spectral counts for the corresponding proteins (data not shown). Table S4 in the supplemental material shows the number of proteins detected in the rpoB mutant Haarlem and Beijing isolates at summary (combined CW, MEM, and CYT) spectral counts at least 2-fold higher than those of the wild-type isolates, as well as the number of proteins detected in the mutant isolates alone (where the fold change is set arbitrarily to 100). There were 25 proteins detected in neither wild-type isolate and in both rpoB mutants (see Table S4 in the supplemental material). Five of these proteins were detected in at least 2 replicates in both rpoB mutants, as shown in Table S5 in the supplemental material. Table S5 lists the Rv numbers, spectral counts, fold changes, replicate raw data, and P values for the comparison of the two strains for the 90 cell-associated proteins detected at >2-fold-higher levels in both rpoB mutant isolates than in the wild type, including proteins detected only in the mutant strains. Of the 10 proteins identified at statistically significantly higher counts in specific cellular fractions of both rpoB mutants (Table 1), 3 also had summary cell-associated (e.g., combined spectral counts of all fractions except CFP) spectral counts at least 2-fold higher in both mutants than in the wild-type isolates, and of these, 2 involved the PDIM biosynthetic locus (ppsC and drrA). The increased detection levels in the rpoB mutant Haarlem and Beijing isolates of ppsC and drrA were 3.6 and 10.2, and 100 (detected in the mutant but not the wild type) and 4.7, respectively. The fold change values for ppsE were 3.07 and 1.97 for the Haarlem and Beijing strains, respectively.
Table 1.
Mean spectral counts and functional classes of proteins detected at statistically significantly higher spectral counts in specific cellular fractions of both rpoB mutant versus wild-type parent strains of M. tuberculosis
| Protein name (gene) | Rv no. | Fraction | Functional class | Spectral counta |
|||||
|---|---|---|---|---|---|---|---|---|---|
| Haarlem |
Beijing |
||||||||
| rpoB | WT | P value | rpoB | WT | P value | ||||
| Succinic semialdehyde dehydrogenase (gabD1) | Rv0234c | CYT | Intermediary metabolism and respiration | 29 | 21 | 0.003 | 24 | 15 | 0.002 |
| Hypothetical protein Rv1056 | Rv1056 | CFP | Conserved hypothetical | 32 | 11 | 0.029 | 41 | 17 | 0.037 |
| Putative integration host factor MIHF (mihF)b | Rv1388 | CFP | Information pathways | 5.35b | 0 | 0.022 | 4.61 | 0 | 0.009 |
| Probable acyl-CoA dehydrogenase FADE31 (fadE31) | Rv3562 | CFP | Lipid metabolism | 2.34 | 0 | 0.004 | 2.05 | 0 | 0.002 |
| Polynucleotide phosphorylase/polyadenylase (gpsI) | Rv2783c | MEM | Information pathways | 74.78 | 44.32 | 0.038 | 95.96 | 54.98 | 0.003 |
| Hypothetical protein Rv3038c | Rv3038c | MEM | Conserved hypothetical | 10.87 | 1.37 | 0.014 | 3.89 | 0.66 | 0.045 |
| Hypothetical protein Rv3661b | Rv3661 | MEM | Conserved hypothetical | 9.43 | 0.73 | 0.012 | 7.29 | 2.51b | 0.007 |
| Phenolpthiocerol synthesis type I polyketide synthase (ppsC) | Rv2933 | CW | Lipid metabolism | 16.32 | 4.98 | 0.001 | 41.74 | 3.66 | 0.029 |
| Phenolpthiocerol synthesis type I polyketide synthase (ppsE) | Rv2935 | CW | Lipid metabolism | 41.69 | 19.75 | 0.049 | 65.64 | 32.15 | 0.041 |
| Probable daunorubicin-DIM-transport ATP-binding protein ABC transporter (drrA) | Rv2936 | CW | Cell wall and cell processes | 3.83 | 0 | 0.012 | 6.55 | 1.41 | 0.034 |
The spectral counts are the means of 3 biological replicates for each isolate. The numbers correspond to normalized spectral counts.
Protein identified by only 1 unique peptide in all biological replicates. See Fig. S1a to f in the supplemental material for spectra of these two proteins.
Gene set enrichment analysis of proteins upregulated in both rpoB mutants.
The distributions of functional classes among genes upregulated ≥2-fold in both rpoB mutants versus genes not upregulated in both mutants were not statistically significantly different when the proportions of genes in each functional categorization of gene products (COG) class were compared (chi-square tests, all P > 0.05). Among the four gene loci identified as possibly involved in natural product biosynthesis in M. tuberculosis by NP.searcher, the polyketide synthase gene cluster ppsA-ppsE and drrA was significantly upregulated in both rpoB mutants (Fig. 1).
Fig 1.
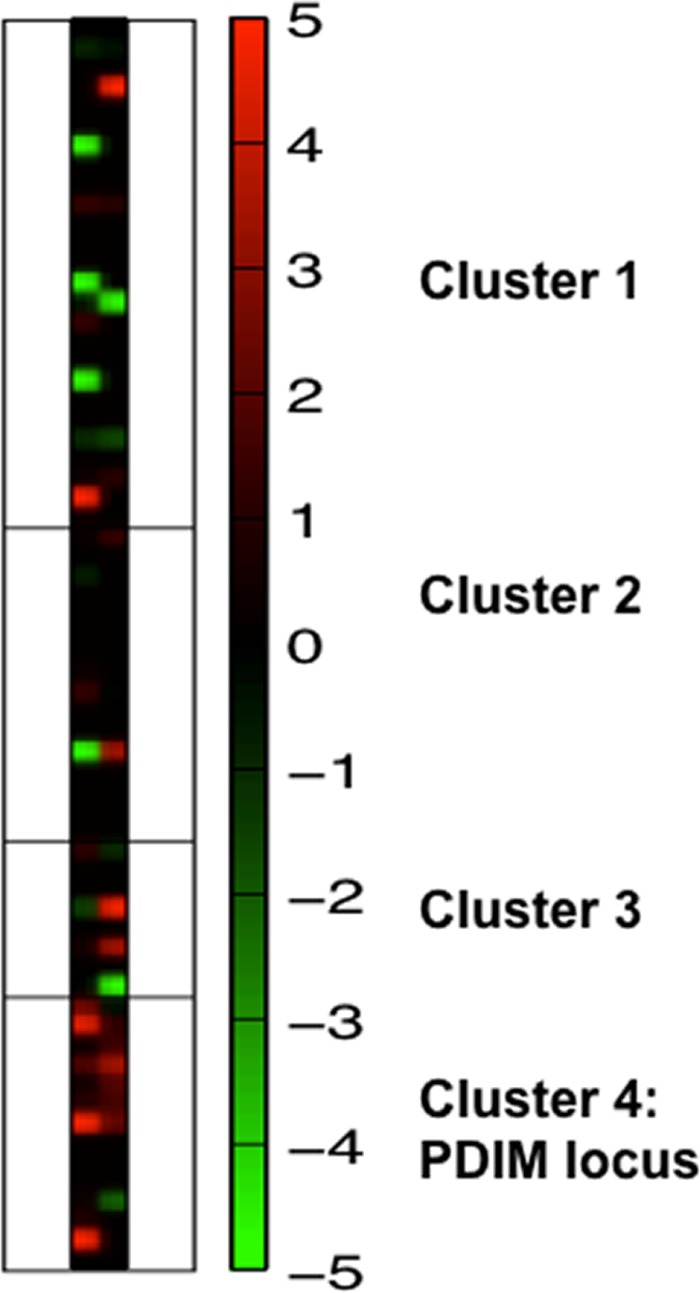
Heat map of protein detection in rpoB mutant versus wild-type strains as determined by summary cell-associated spectral counts in 4 gene clusters identified as possibly involved in natural product biosynthesis by NP.searcher. The PDIM biosynthetic locus is cluster 4. Cluster 1, Rv0993-Rv1017c; cluster 2, Rv1536-Rv1551; cluster 3, Rv1661-Rv1668c; cluster 4, Rv2930-Rv2943. Genes are shown in increasing order of Rv number from top to bottom. The column on the left corresponds to the Haarlem strains, while the one on the right corresponds to the Beijing strains.
Selected expression of genes in the PDIM biosynthetic locus in the Beijing rpoB mutant M. tuberculosis during active infection of murine macrophages.
In order to determine if increased expression of proteins involved in PDIM biosynthesis correlated with increased transcription of the corresponding genes, qRT-PCR was performed. Consistent with the proteomic analysis, the ppsA gene was found to be upregulated >2-fold in the Beijing rpoB mutant relative to the parental strain (Fig. 2A). Next, using qRT-PCR, we sought to determine the effect of rpoB mutation on the expression levels of selected PDIM biosynthesis genes during M. tuberculosis infection of activated murine macrophages. The genes ppsA, ppsC, and ppsE were each found to have >10-fold-increased expression in the rpoB mutant relative to the rifampin-sensitive parent strain, while expression of the control gene Rv0496 was not different between the two strains (Fig. 2B). A comparison of upregulation in Fig. 2A and B indicates that the upregulation was more striking in activated macrophages than in nutrient-rich medium. Consistent with the proteomic data, Rv0799c, which encodes a conserved hypothetical protein, was also found to be mildly upregulated in the rpoB mutant relative to the parent strain in activated murine macrophages. The rpoB mutation did not appear to confer a fitness cost, as the rpoB mutant and the WT parent strain showed nearly equivalent growth rates and survival in activated macrophages (Fig. 2C). Finally, in order to confirm that the gene expression profile observed in the rpoB mutant was attributable to the RpoB S450L mutation in the rpoB gene, we experimentally generated a mutant strain containing the RpoB S450L mutation in the background of the laboratory strain M. tuberculosis CDC1551. The genes ppsA, ppsB, ppsC, and Rv0799c were each upregulated in this rpoB S450L mutant relative to the isogenic CDC1551 WT strain during logarithmic growth in nutrient-rich broth (Fig. 2D).
Fig 2.

Effects of rpoB S450L mutation on M. tuberculosis gene expression and fitness. (A) Expression of the PDIM biosynthesis locus in the rpoB mutant Beijing strain relative to the rifampin-sensitive wild-type parent strain during logarithmic growth in nutrient-rich broth, as measured by RT-PCR. (B) Gene expression of the same strains after 72 h of infection in activated murine macrophages. (C) Growth and survival of the rpoB mutant (gray) relative to the Beijing wild-type parent strain (white) in activated murine macrophages. (D) RT-PCR analysis of gene expression in a laboratory-generated RpoB S450L mutant relative to the isogenic CDC1551 wild-type strain during logarithmic growth in nutrient-rich broth. The CT obtained for each gene of interest was normalized with that of the housekeeping gene sigA. Fold regulation of individual genes was calculated using the following formula: 2−[C(CT) −S(CT)], where C represents the wild-type (control) strain and S represents the rpoB mutant strain. The error bars indicate standard deviations.
Metabolomics analysis.
In addition to the proteomics experiments described above, metabolomics analyses were performed in order to determine if rpoB mutations also might lead to changes in the M. tuberculosis metabolome. Because of the great complexity of the sample, two sequential extractions were performed to separate cell wall-associated lipids and other nonpolar metabolites from more polar metabolites. This analysis revealed 99 molecular features in the chloroform fraction that were significantly more abundant (P < 0.05) in both rifampin-resistant M. tuberculosis strains than in their susceptible counterparts (see Table S6 in the supplemental material). A search performed against the LipidMaps database suggested that several of these significant features correspond to diacylglycerol phosphocholines (Table 2). Since the proteomics and GSEA findings suggested that the polyketide synthase genes involved in phenolpthiocerol biosynthesis are upregulated in the rpoB mutant isolates of M. tuberculosis, we compared the chloroform extract to a positive authentic PDIM standard that was obtained from M. tuberculosis H37Rv and analyzed by LC-MS using identical parameters. The PDIM standard was obtained through the Tuberculosis Vaccine Testing and Research Material Contract (TVTRMC). The 797.7 m/z and 823.2 m/z signals, observed to increase in the resistant strains relative to their respective parent strains (Fig. 3 and Table 2), were also found in an authentic PDIM standard. When MS-MS analysis was performed on the 797.7 m/z ion, a fragment of 523.47 m/z and neutral loss of 274.27 were observed (data not shown). The difference of 2 Da from the expected 525.5 m/z of phthiocerol (40) suggests desaturation by loss of the methyl group and therefore most likely corresponds to phthiodiolone. These data are consistent with accumulation of PDIM precursors in the rifampin-resistant isolates, perhaps due to elevated levels of polyketide synthase-related proteins.
Table 2.
Metabolites identified as statistically significantly more abundant in both rpoB mutants versus wild-type parent strains of M. tuberculosis, with putative identifications
| Mass (M+H)+ | RTa (s) | Avg peak intensity |
P value | Avg peak intensity |
P value | ||
|---|---|---|---|---|---|---|---|
| Haarlem rpoB | Haarlem WT | Beijing rpoB | Beijing WT | ||||
| Spectra in chloroform fraction identified as diacylglycerol phosphocholine-related polymerb (scorec = 3) | |||||||
| 200.1 | 318 | 11.598 | 4.620 | 0.043 | 6.580 | 3.204 | 0.001 |
| 215.1 | 318 | 217.697 | 89.613 | 0.050 | 126.643 | 62.609 | 0.001 |
| 747.6 | 318 | 444.030 | 189.220 | 0.048 | 243.566 | 119.076 | 0.001 |
| 819.7 | 318 | 74.700 | 31.109 | 0.048 | 41.029 | 25.357 | 0.015 |
| 838.7 | 318 | 54.247 | 17.966 | 0.046 | 26.170 | 11.222 | 0.001 |
| 780.6 | 487 | 31.377 | 20.849 | 0.044 | 126.434 | 63.609 | 0.032 |
| 807.6 | 517 | 110.520 | 69.352 | 0.041 | 396.873 | 59.912 | 0.000 |
| 808.6 | 517 | 40.775 | 27.568 | 0.049 | 127.011 | 25.237 | 0.000 |
| 864.8 | 693 | 3,945.021 | 3,202.000 | 0.007 | 5,929.751 | 3,489.109 | 0.000 |
| 865.8 | 693 | 2,079.054 | 1,681.559 | 0.008 | 4,001.476 | 2,100.497 | 0.000 |
| Spectra in chloroform fraction identified as a PDIM derivatived (score = 1) | |||||||
| 797.7 | 679 | 291.565 | 236.479 | 0.043 | 1,281.437 | 607.982 | 0.000 |
| 823.2 | 679 | 6.644 | 4.660 | 0.043 | 34.537 | 21.806 | 0.008 |
| Spectra in methanol fraction identified as a Hex-N-acetyl-hexosamine-fucose-N-acetyl-hexosamine-related polymera (score = 3) | |||||||
| 321.2 | 1,016 | 60.948 | 46.177 | 0.047 | 42.502 | 29.030 | 0.003 |
| 567.4 | 1,016 | 98.960 | 63.557 | 0.025 | 56.887 | 33.203 | 0.014 |
| 636.5 | 1,016 | 48.163 | 32.947 | 0.048 | 29.572 | 14.773 | 0.011 |
| 637.5 | 1,016 | 16.337 | 7.594 | 0.038 | 9.879 | 3.414 | 0.020 |
| 717.6 | 1,016 | 8,520.133 | 6,005.559 | 0.048 | 5,015.322 | 2,481.935 | 0.002 |
| 719.6 | 1,016 | 631.562 | 470.320 | 0.043 | 439.111 | 292.037 | 0.027 |
| 736.6 | 1,016 | 126.813 | 87.716 | 0.017 | 359.462 | 193.015 | 0.007 |
| 754.6 | 1,016 | 224.169 | 158.316 | 0.047 | 139.541 | 79.460 | 0.004 |
| 771.6 | 1,016 | 408.037 | 265.790 | 0.049 | 226.849 | 117.176 | 0.005 |
| 880.6 | 1,016 | 15.607 | 6.143 | 0.024 | 8.211 | 2.613 | 0.005 |
| Spectra in methanol fraction identified as a PG derivativee (score = 2) | |||||||
| 187.1 | 1,061 | 208.350 | 143.458 | 0.016 | 160.662 | 110.637 | 0.011 |
| 265.1 | 1,061 | 21.793 | 13.452 | 0.028 | 17.680 | 12.084 | 0.027 |
| 345.2 | 1,061 | 10.419 | 5.687 | 0.034 | 14.349 | 5.727 | 0.019 |
| 363.2 | 1,061 | 74.866 | 49.437 | 0.014 | 63.242 | 44.048 | 0.003 |
| 389.3 | 1,061 | 53.262 | 34.879 | 0.024 | 46.866 | 31.877 | 0.017 |
| 531.5 | 1,061 | 151.562 | 91.939 | 0.036 | 109.917 | 56.560 | 0.015 |
| 532.5 | 1,061 | 56.525 | 36.064 | 0.028 | 42.000 | 20.758 | 0.012 |
| 636.5 | 1,061 | 47.548 | 23.712 | 0.004 | 38.509 | 17.748 | 0.009 |
| 699.6 | 1,061 | 33.271 | 18.839 | 0.023 | 24.653 | 12.342 | 0.021 |
| 717.6 | 1,061 | 6,257.378 | 3,655.220 | 0.033 | 4,529.182 | 1,897.650 | 0.007 |
| 718.6 | 1,061 | 2,867.806 | 1,806.767 | 0.045 | 2,124.351 | 1,002.772 | 0.008 |
| 735.6 | 1,061 | 799.634 | 409.858 | 0.034 | 546.444 | 249.317 | 0.014 |
| 736.6 | 1,061 | 83.305 | 52.974 | 0.030 | 249.131 | 128.015 | 0.011 |
| 753.6 | 1,061 | 170.532 | 104.240 | 0.038 | 123.990 | 62.392 | 0.007 |
| 754.6 | 1,061 | 94.545 | 61.712 | 0.036 | 71.979 | 43.733 | 0.031 |
| 771.6 | 1,061 | 198.991 | 117.007 | 0.014 | 131.692 | 70.860 | 0.007 |
| 772.6 | 1,061 | 107.522 | 67.597 | 0.009 | 80.007 | 42.733 | 0.016 |
| 773.6 | 1,061 | 31.654 | 18.005 | 0.015 | 22.130 | 11.537 | 0.025 |
| 789.6 | 1,061 | 247.516 | 151.338 | 0.036 | 177.175 | 94.146 | 0.015 |
| 790.6 | 1,061 | 124.074 | 79.885 | 0.024 | 91.662 | 53.478 | 0.013 |
| 791.6 | 1,061 | 37.056 | 23.549 | 0.046 | 27.228 | 15.857 | 0.012 |
| 807.6 | 1,061 | 296.842 | 176.814 | 0.033 | 201.738 | 97.621 | 0.008 |
| 808.6 | 1,061 | 166.267 | 93.964 | 0.015 | 109.848 | 52.227 | 0.022 |
| 809.6 | 1,061 | 52.777 | 30.453 | 0.030 | 36.652 | 20.813 | 0.017 |
RT, retention time.
Identified by analysis in LipidMaps or Massbank.
Scoring system based on metabolite identification guidelines (http://www.metabolomicssociety.org). Scores: 1, identified compound where the retention time and mass spectrum of interest match those of a purified standard; 2, putatively annotated compound based on spectral similarity to public spectral libraries or published data; 3, putatively characterized compound classes based on spectral similarity to known compounds of a chemical class.
Identified by comparison of MS spectra produced by analysis of purified PDIM from M. tuberculosis.
Identified by query of published reports of M. tuberculosis peptidoglycan (PG) mass spectra.
Fig 3.

Representative spectra for some of the significant features found at higher abundance in the chloroform fraction of rpoB mutant versus WT susceptible M. tuberculosis isolates, which also matched peaks found in the PDIM standard. The retention time for these peaks was 11.32 min. The main differentially significant peaks are indicated by arrows (m/z 797.7 and m/z 823.2). CI22 is the Beijing rpoB mutant.
Eighty-seven molecular features from the methanol fraction were significantly more abundant (P < 0.05) in both resistant strains than in their susceptible counterparts (see Table S6 in the supplemental material). A large portion of these molecular features were observed in two clusters at a retention time of 16.9 min, suggesting that they may be derived from a common parent compound (Table 2). Each cluster of peaks was searched against the MassBank spectral database, and both returned matches to hexose-N-acetyl-hexosamine-fucose-N-acetyl-hexosamine (Table 2). To determine if this compound originated from peptidoglycan (PG), an M. tuberculosis petidoglycan standard, obtained through the TVTRMC, was analyzed by LC-MS under identical conditions. On comparison, the standard peptidoglycan spectrum did not correlate with the molecular features observed in the methanol sample fraction. However, this was not entirely unexpected, given the extensive cross-linking in mature PG and the stability of the mature product. An analysis of the literature for mass spectra of partially hydrolyzed PG demonstrated reports of PG N-acetylmuramic acid (MurNac) tetra- and pentapeptides and MurNac of M. tuberculosis PG that do match the molecular features observed in the spectra from our methanol sample fractions. Specifically, the molecular features at 808.6 m/z (790.6 m/z minus water), 736.6 m/z (718.6 m/z minus water), and 531.5 m/z correspond to these three PG derivatives (48, 52). An examination of the gene cluster associated with peptidoglycan biosynthesis in M. tuberculosis (Rv2158c-2152c) did not, however, reveal significantly increased spectral counts in the rpoB mutant isolates using GSEA. A previously reported scoring system of 1 to 4 (1, high; 4, low) was used to determine the level of confidence in metabolite identification (http://www.metabolomicssociety.org/).
DISCUSSION
We hypothesized that rpoB mutation would lead to upregulation of M. tuberculosis genes involved in secondary metabolism, given known relationships between rpoB mutation and upregulation of genes involved in natural product biosynthesis in other organisms (34, 35, 37). This study, which is the first to comprehensively compare the proteomes and metabolomes of rpoB mutant rifampin-resistant M. tuberculosis with those of their paired wild-type rifampin-susceptible parent strains, supports this hypothesis by demonstrating that several genes, particularly those involved in the biosynthesis of cell wall lipids, including PDIM, are upregulated in rpoB mutants, both in broth culture and, in particular, when grown in murine macrophages. Using the program NP.searcher, we found 4 gene loci possibly related to natural product biosynthesis in M. tuberculosis, and the GSEA indicated that of these four, the proteins encoded by ppsA-ppsE and drrA were more abundant in the cell walls of both rpoB mutants than in those of their wild-type parent strains. Furthermore, in situ overexpression of several pps genes was confirmed using a CDC1551 strain, as well as a macrophage model for the Beijing isolate, indicating that the changes in expression of ppsA-ppsE are unlikely to be due to inherent characteristics of the two clinical strains used or the in vitro culture system. Our study is different from previous studies demonstrating that exposure to rifampin induces several changes in rifampin-resistant M. tuberculosis gene expression, including marked upregulation of drug efflux pump-related genes (30, 51). Specifically, in this study, the impacts of rpoB mutations on the proteomes and metabolomes of rifampin-resistant and -susceptible strains were studied in the absence of rifampin in order to determine protein and metabolite abundance changes that are associated with rpoB mutations independent of drug exposure.
Proteins encoded by ppsA-ppsE are involved in PDIM biosynthesis, and the corresponding genes are grouped on a 50-kb fragment of the M. tuberculosis chromosome (10). Although we did not find evidence of higher levels of intact PDIM in the Haarlem rpoB mutant, levels of PDIM in the Beijing rpoB mutant isolate appear to be elevated compared to its isogenic strain, as evaluated by TLC (see Fig. S1 in the supplemental material). However, metabolites with the same spectra as PDIM precursors were detected at higher levels in both rpoB mutant isolates compared to their wild-type progenitor isolates. While we evaluated only two strains, the finding of similar changes in protein abundance in a Beijing and a Haarlem strain of M. tuberculosis with different rpoB mutations grown in the absence of drug exposure suggests that rpoB mutation and rifampin resistance in M. tuberculosis may lead to a pattern of differential protein and metabolite abundance that is conserved across both mutations and strains, but the extent of this effect may be related to the genetic background of the isolates.
PDIM is a long-chain β-diol (phthiocerol) esterified with two branched-chain mycocerosic acids located in the outer mycobacterial cell wall that has been implicated in M. tuberculosis virulence (11, 19, 59). The genes ppsA-ppsE (Rv2931-Rv2935) encode a type I modular polyketide synthase responsible for biosynthesis of the phtiocerol backbone of PDIM, with PpsA-PpsC sequentially loading ketide units onto long-chain fatty acids and PpsD and PpsE subsequently extending the phthiocerol further by adding a 4-methyl branch and malonyl- or methylmalonyl-CoA, respectively (3, 72). The genes drrA-drrC (Rv2936-Rv2938) are located adjacent to ppsE (Rv2935) and are thought to encode proteins involved in the transport and localization of PDIM across the cell membrane (8, 10). Others have demonstrated upregulation of genes in this pathway in response to acid exposure (29, 62), hypoxia (58, 62), and treatment with antibiotics, such as clofazamine and rifapentine (7). Furthermore, M. tuberculosis strains with defects in this pathway have been shown to have increased cell envelope permeability (10) and are more susceptible to IFN-γ-mediated and IFN-γ-independent immunity (46, 56). Importantly, PDIM deficiency appears to be particularly important to M. tuberculosis growth in the host environment, as isolates with deficiencies in this pathway have pronounced growth defects in the spleens and lungs of infected mice (11, 19, 47) and are more susceptible to the nitric oxide-dependent killing of macrophages (61). More recently, PDIM has been shown to play a role in M. tuberculosis interaction with the host macrophage cell envelope, inducing changes that favor receptor-mediated phagocytosis of the bacterium (2). In this study, we found that the upregulation of PDIM by rpoB mutants relative to WT isolates, initially identified by proteomics experiments on M. tuberculosis isolates grown in broth, was more dramatic when these comparisons were performed in activated murine macrophages. Thus, although we cannot discern the physiological importance of PDIM upregulation by rpoB mutants from these data, it is possible that upregulation of the PDIM pathway is related to increased pressure for rpoB mutants to maintain or remodel the cell wall, particularly during host cell infection. Of note, certain other bacteria have been shown to increase lipid abundance in association with rpoB mutations, which suggests that this may be a conserved response to the development of drug resistance (73).
The finding of increased peptidoglycan precursors in the rpoB mutants in the metabolomics data is also supportive of this hypothesis. Peptidoglycan biosynthesis is a multienzyme process that involves the MurA-MurG cluster, in addition to MurX and a putative flippase (16). Our proteomic analysis identified three of the seven Mur proteins (MurD-MurF) in the cell wall, membrane, and cytosol that did not show significant differences in their abundances between resistant and susceptible strains. However, given the lack of data on the relative abundances of the other peptidoglycan biosynthetic enzymes and the complex nature of peptidoglycan precursor biosynthesis, we cannot discard the idea that the increased amount of PG-related metabolites could be associated with an increase in the production of PG enzymes, especially with those involved in the last steps of the biosynthetic pathway, such as MurG and MurX (also known as MraY). Further work is required to evaluate this possibility, however. Nonetheless, peptidoglycan and PDIM are both significant components of the cell envelope, with peptidoglycan forming the inner cell wall layer and PDIM decorating the outer layer via noncovalent association with other cell envelope lipids (9). Peptidoglycan interacts (at least indirectly) with PDIM to form the mature mycobacterial cell envelope, in that PDIM translocates across peptidoglycan via mmpl7 to reside in the outer layer of the cell envelope (39).Thus, it is plausible that changes in PG ultrastructure combined with changes in PDIM biosynthesis synergize to affect the overall integrity of the mycobacterial cell envelope together in response to rpoB mutation.
rpoB mutant strains of saprophytic environmental mycobacteria have been found to cohabit with rifamycin-producing organisms on marine sponges (38), indicating that ancestors of M. tuberculosis faced rifamycin exposure long before this class of antibiotics was used to treat TB. Rifamycin-resistant rpoB mutant environmental mycobacteria antagonized by antibiotics secreted by surrounding competitor organisms conceivably would have experienced a survival advantage if they were able to maintain the integrity of their cell walls. Thus, it is possible that upregulation of the PDIM biosynthetic pathway in rpoB mutants of M. tuberculosis, as demonstrated here in both broth and macrophage culture, is a defense mechanism response to competition interference inherited from the environmental ancestors of M. tuberculosis. Although the physiological relevance of this gene upregulation to the human pathogen M. tuberculosis is unknown, it may be important to the survival of rifampin-resistant mycobacteria in the setting of rifamycin or other antibiotic exposure. In particular, future research should comprehensively investigate the degrees to which various globally heterogeneous strains of rpoB mutant M. tuberculosis upregulate PDIM, the mechanisms that result in PDIM upregulation, and the effect of rpoB mutation and PDIM upregulation on susceptibility to various stressors, including existing and novel antibiotics used to treat TB.
The M. tuberculosis genome contains an expansive repertoire of polyketide synthase genes that in related bacteria are involved in the biosynthesis of various secondary metabolites, including erythromycin A and rifamycin B (17, 28, 57). The finding of upregulation of several genes encoding polyketide synthases in both rpoB mutants of M. tuberculosis is of interest in that it suggests that the adaptive response of M. tuberculosis to rpoB mutation may be analogous to responses observed in related model organisms. As such, rpoB mutations lead to upregulation of otherwise dormant gene clusters, resulting in increased abundance of specific secondary metabolites that are absent or minimally present in wild-type strains (34, 79). For example, genes encoding protein enzymes involved in actinorhodin (Act) and undecylprodigiosin (Red) biosynthesis are found in Streptomyces lividans but normally are not expressed by the corresponding paired wild-type isolates from which they arose (35). Certain rifampin-resistant rpoB mutants of S. lividans, however, produce both Act and Red in abundance, a phenomenon that can be reversed by replacing mutant with wild-type rpoB (35). Similarly, specific rpoB mutations in Bacillus subtilis lead to dramatic autoinduction of the antibiotic 3,3′-neotrehalosadiame (NTD), which wild-type strains do not produce (37). Remarkably, while only certain rpoB mutations are associated with gene upregulation in model organisms, the specific mutations most commonly associated with induced gene expression in nonmycobacterial organisms (13, 35, 37) align with mutations most commonly found in clinical rifampin-resistant M. tuberculosis strains (i.e., positions 445 and 450 in M. tuberculosis) (15, 32, 54, 70, 78). This suggests that those rpoB mutations that trigger upregulation of genes involved in biosynthesis of secondary metabolites are evolutionarily advantageous.
Camacho et al. demonstrated that the PDIM locus is divided into three transcriptional units, one spanning fadD26 to papA5 (which includes the genes ppsA-ppsE and drrA), another containing only the mas gene, and a third including fadD28 and mmpL7 (10). The transcription of all three units appears to be required for the correct biosynthesis and placement of intact PDIM in the cell (10). The genes ppsC, ppsE, and drrA are located within the first transcriptional unit, and in this study, their corresponding PDIM precursor proteins were detected at statistically significantly higher levels in the rpoB mutants than in their corresponding wild-type parent strains. Although the limited sensitivity of shotgun proteomics approaches hinders our ability to definitively conclude that proteins found in the other two downstream PDIM transcriptional units were not also upregulated, these findings, together with the metabolomics data, suggest that the first transcriptional unit of the PDIM biosynthetic locus, and not the others, may be specifically upregulated in rpoB mutant isolates of M. tuberculosis. Comprehensive transcriptomics data are needed to confirm this hypothesis, and if it is true, the biological relevance of this phenomenon is unknown. PDIM production is characteristic of pathogenic, but not environmental, mycobacterial strains (20). This indicates that PDIM production is not important for survival of environmental mycobacteria and, to the extent that the responses of M. tuberculosis to rpoB mutation may have been inherited from the saprophytic environmental ancestors of M. tuberculosis, provides one speculative explanation for the observation that intact PDIM was not found in greater amounts in rpoB mutant isolates in this study.
Domenech and Reed have shown that in vitro passage of M. tuberculosis H37Rv can lead to the inability of mycobacteria to produce PDIM (21). However, the two H37Rv strains analyzed (ATCC versus Pasteur) showed significant differences in the appearance of the PDIM phenotype, which may indicate that loss of PDIM can be affected by the strain genetic background. In the present study, clinical isolates from two different M. tuberculosis genotypes had minimal in vitro passage, and all of them showed the presence of PDIM when assessed by TLC (see Fig. S1 in the supplemental material). From these isolates, only the rpoB mutants showed higher abundance of Pps proteins and of a PDIM-related fragment or precursor, suggesting these changes are directly related to the rpoB mutations rather than spontaneous mutations acquired during in vitro culture. Analysis of the whole genome sequences of these isolates will add important information and may provide additional explanations of the findings reported in the present study.
This comprehensive analysis suggests that further research to identify more precisely the effects of rpoB mutation on gene expression in M. tuberculosis will yield novel insights into diagnostics and treatments for drug-resistant TB. For example, if induction of PDIM biosynthetic pathways represents a compensatory virulence mechanism as a result of rpoB mutation, the development of novel drugs specifically targeting these pathways may be particularly effective when used to treat TB caused by rifampin-resistant M. tuberculosis. Although the ppsA-ppsE genes are considered nonessential by transposon mutagenesis (64), Camacho et al. showed that mutant strains of M. tuberculosis with transposon insertions in the PDIM biosynthetic pathway were more sensitive to detergents than wild-type strains (10). Thus, growth of rpoB mutants may be more sensitive to inhibitors of this pathway than wild-type strains, but this hypothesis remains to be tested. Furthermore, if certain genes are expressed preferentially by rifampin-resistant M. tuberculosis strains, immune responses to the corresponding proteins could be investigated as a way to identify individuals with rifampin-resistant latent M. tuberculosis infection. The significance of gene upregulation associated with rpoB mutation for treatment of drug-resistant TB is unknown, but these data indicate that compensatory mechanisms and pathways should be further explored in order to identify new ways to diagnose and treat this globally important disease.
Supplementary Material
ACKNOWLEDGMENTS
We thank Harvey Rubin (University of Pennsylvania) for his thoughtful comments on the manuscript.
This work was funded by administrative funds made available to G.P.B. by the University of Pennsylvania Department of Medicine.
Footnotes
Published ahead of print 21 September 2012
Supplemental material for this article may be found at http://jb.asm.org/.
REFERENCES
- 1. Ahmad Z, et al. 2009. Biphasic kill curve of isoniazid reveals the presence of drug-tolerant, not drug-resistant, Mycobacterium tuberculosis in the guinea pig. J. Infect. Dis. 200:1136–1143 [DOI] [PubMed] [Google Scholar]
- 2. Astarie-Dequeker C, et al. 2009. Phthiocerol dimycocerosates of M. tuberculosis participate in macrophage invasion by inducing changes in the organization of plasma membrane lipids. PLoS Pathog. 5:e1000289 doi:10.1371/journal.ppat.1000289. [DOI] [PMC free article] [PubMed] [Google Scholar]
- 3. Azad AK, Sirakova TD, Fernandes ND, Kolattukudy PE. 1997. Gene knockout reveals a novel gene cluster for the synthesis of a class of cell wall lipids unique to pathogenic mycobacteria. J. Biol. Chem. 272:16741–16745 [DOI] [PubMed] [Google Scholar]
- 4. Barnes PF, et al. 1989. Characterization of T cell antigens associated with the cell wall protein-peptidoglycan complex of Mycobacterium tuberculosis. J. Immunol. 143:2656–2662 [PubMed] [Google Scholar]
- 5. Bergval IL, Klatser PR, Schuitema AR, Oskam L, Anthony RM. 2007. Specific mutations in the Mycobacterium tuberculosis rpoB gene are associated with increased dnaE2 expression. FEMS Microbiol. Lett. 275:338–343 [DOI] [PubMed] [Google Scholar]
- 6. Blanchard JS. 1996. Molecular mechanisms of drug resistance in Mycobacterium tuberculosis. Annu. Rev. Biochem. 65:215–239 [DOI] [PubMed] [Google Scholar]
- 7. Boshoff HI, et al. 2004. The transcriptional responses of Mycobacterium tuberculosis to inhibitors of metabolism: novel insights into drug mechanisms of action. J. Biol. Chem. 279:40174–40184 [DOI] [PubMed] [Google Scholar]
- 8. Braibant M, Gilot P, Content J. 2000. The ATP binding cassette (ABC) transport systems of Mycobacterium tuberculosis. FEMS Microbiol. Rev. 24:449–467 [DOI] [PubMed] [Google Scholar]
- 9. Brennan PJ. 2003. Structure, function, and biogenesis of the cell wall of Mycobacterium tuberculosis. Tuberculosis (Edinb.) 83:91–97 [DOI] [PubMed] [Google Scholar]
- 10. Camacho LR, et al. 2001. Analysis of the phthiocerol dimycocerosate locus of Mycobacterium tuberculosis. Evidence that this lipid is involved in the cell wall permeability barrier. J. Biol. Chem. 276:19845–19854 [DOI] [PubMed] [Google Scholar]
- 11. Camacho LR, Ensergueix D, Perez E, Gicquel B, Guilhot C. 1999. Identification of a virulence gene cluster of Mycobacterium tuberculosis by signature-tagged transposon mutagenesis. Mol. Microbiol. 34:257–267 [DOI] [PubMed] [Google Scholar]
- 12. Campbell EA, et al. 2001. Structural mechanism for rifampicin inhibition of bacterial RNA polymerase. Cell 104:901–912 [DOI] [PubMed] [Google Scholar]
- 13. Carata E, et al. 2009. Phenotypes and gene expression profiles of Saccharopolyspora erythraea rifampicin-resistant (rif) mutants affected in erythromycin production. Microb. Cell Fact. 8:18. [DOI] [PMC free article] [PubMed] [Google Scholar]
- 14. Carvalho PC, Hewel J, Barbosa VC, Yates JR., III 2008. Identifying differences in protein expression levels by spectral counting and feature selection. Genet. Mol. Res. 7:342–356 [DOI] [PMC free article] [PubMed] [Google Scholar]
- 15. Cavusoglu C, Hilmioglu S, Guneri S, Bilgic A. 2002. Characterization of rpoB mutations in rifampin-resistant clinical isolates of Mycobacterium tuberculosis from Turkey by DNA sequencing and line probe assay. J. Clin. Microbiol. 40:4435–4438 [DOI] [PMC free article] [PubMed] [Google Scholar]
- 16. Cole ST. 2005. Tuberculosis and the tubercle bacillus. ASM Press, Washington, DC [Google Scholar]
- 17. Cole ST, et al. 1998. Deciphering the biology of Mycobacterium tuberculosis from the complete genome sequence. Nature 393:537–544 [DOI] [PubMed] [Google Scholar]
- 18. Comas I, et al. 2011. Whole-genome sequencing of rifampicin-resistant Mycobacterium tuberculosis strains identifies compensatory mutations in RNA polymerase genes. Nat. Genet. 44:106–110 [DOI] [PMC free article] [PubMed] [Google Scholar]
- 19. Cox JS, Chen B, McNeil M, Jacobs WR., Jr 1999. Complex lipid determines tissue-specific replication of Mycobacterium tuberculosis in mice. Nature 402:79–83 [DOI] [PubMed] [Google Scholar]
- 20. Daffe M, Laneelle MA. 1988. Distribution of phthiocerol diester, phenolic mycosides and related compounds in mycobacteria. J. Gen. Microbiol. 134:2049–2055 [DOI] [PubMed] [Google Scholar]
- 21. Domenech P, Reed MB. 2009. Rapid and spontaneous loss of phthiocerol dimycocerosate (PDIM) from Mycobacterium tuberculosis grown in vitro: implications for virulence studies. Microbiology 155:3532–3543 [DOI] [PMC free article] [PubMed] [Google Scholar]
- 22. Dreger M. 2003. Subcellular proteomics. Mass Spectrom. Rev. 22:27–56 [DOI] [PubMed] [Google Scholar]
- 23. Fu X, et al. 2008. Spectral index for assessment of differential protein expression in shotgun proteomics. J. Proteome Res. 7:845–854 [DOI] [PubMed] [Google Scholar]
- 24. Gagneux S. 2009. Fitness cost of drug resistance in Mycobacterium tuberculosis. Clin. Microbiol. Infect. 15(Suppl. 1):66–68 [DOI] [PubMed] [Google Scholar]
- 25. Gagneux S, et al. 2006. The competitive cost of antibiotic resistance in Mycobacterium tuberculosis. Science 312:1944–1946 [DOI] [PubMed] [Google Scholar]
- 26. Gandhi NR, et al. 2010. Multidrug-resistant and extensively drug-resistant tuberculosis: a threat to global control of tuberculosis. Lancet 375:1830–1843 [DOI] [PubMed] [Google Scholar]
- 27. Geffen N. 2010. Cepheid Gene Xpert diagnostic technology for TB. Memories of the 40th World Conference on Lung Health of the International Union Against Tuberculosis and Lung Disease 3–7 December 2009. HIV Treatment Bulletin South (HTB), April 2010 (http://i-base.info/htb-south/960.)
- 28. Gokhale RS, Saxena P, Chopra T, Mohanty D. 2007. Versatile polyketide enzymatic machinery for the biosynthesis of complex mycobacterial lipids. Nat. Prod. Rep. 24:267–277 [DOI] [PubMed] [Google Scholar]
- 29. Golby P, et al. 2007. Comparative transcriptomics reveals key gene expression differences between the human and bovine pathogens of the Mycobacterium tuberculosis complex. Microbiology 153:3323–3336 [DOI] [PubMed] [Google Scholar]
- 30. Gupta AK, et al. 2010. Microarray analysis of efflux pump genes in multidrug-resistant Mycobacterium tuberculosis during stress induced by common anti-tuberculous drugs. Microb. Drug Resist. 16:21–28 [DOI] [PubMed] [Google Scholar]
- 31. Haas WH, et al. 1997. Molecular analysis of katG gene mutations in strains of Mycobacterium tuberculosis complex from Africa. Antimicrob. Agents Chemother. 41:1601–1603 [DOI] [PMC free article] [PubMed] [Google Scholar]
- 32. Herrera L, Jimenez S, Valverde A, Garcia-Aranda MA, Saez-Nieto JA. 2003. Molecular analysis of rifampicin-resistant Mycobacterium tuberculosis isolated in Spain (1996–2001). Description of new mutations in the rpoB gene and review of the literature. Int. J. Antimicrob. Agents 21:403–408 [DOI] [PubMed] [Google Scholar]
- 33. Horai H, et al. 2010. MassBank: a public repository for sharing mass spectral data for life sciences. J. Mass Spectrom. 45:703–714 [DOI] [PubMed] [Google Scholar]
- 34. Hosaka T, et al. 2009. Antibacterial discovery in actinomycetes strains with mutations in RNA polymerase or ribosomal protein S12. Nat. Biotechnol. 27:462–464 [DOI] [PubMed] [Google Scholar]
- 35. Hu H, Zhang Q, Ochi K. 2002. Activation of antibiotic biosynthesis by specified mutations in the rpoB gene (encoding the RNA polymerase beta subunit) of Streptomyces lividans. J. Bacteriol. 184:3984–3991 [DOI] [PMC free article] [PubMed] [Google Scholar]
- 36. Huber LA, Pfaller K, Vietor I. 2003. Organelle proteomics: implications for subcellular fractionation in proteomics. Circ. Res. 92:962–968 [DOI] [PubMed] [Google Scholar]
- 37. Inaoka T, Takahashi K, Yada H, Yoshida M, Ochi K. 2004. RNA polymerase mutation activates the production of a dormant antibiotic 3,3′-neotrehalosadiamine via an autoinduction mechanism in Bacillus subtilis. J. Biol. Chem. 279:3885–3892 [DOI] [PubMed] [Google Scholar]
- 38. Izumi H, et al. 2010. Diversity of Mycobacterium species from marine sponges and their sensitivity to antagonism by sponge-derived rifamycin-synthesizing actinobacterium in the genus Salinispora. FEMS Microbiol. Lett. 313:33–40 [DOI] [PubMed] [Google Scholar]
- 39. Jain M, Cox JS. 2005. Interaction between polyketide synthase and transporter suggests coupled synthesis and export of virulence lipid in M. tuberculosis. PLoS Pathog. 1:e2 doi:10.1371/journal.ppat.0010002. [DOI] [PMC free article] [PubMed] [Google Scholar]
- 40. Jain M, et al. 2007. Lipidomics reveals control of Mycobacterium tuberculosis virulence lipids via metabolic coupling. Proc. Natl. Acad. Sci. U. S. A. 104:5133–5138 [DOI] [PMC free article] [PubMed] [Google Scholar]
- 41. Jin DJ, Gross CA. 1988. Mapping and sequencing of mutations in the Escherichia coli rpoB gene that lead to rifampicin resistance. J. Mol. Biol. 202:45–58 [DOI] [PubMed] [Google Scholar]
- 42. Kall L, Storey JD, MacCoss MJ, Noble WS. 2008. Assigning significance to peptides identified by tandem mass spectrometry using decoy databases. J. Proteome Res. 7:29–34 [DOI] [PubMed] [Google Scholar]
- 43. Karakousis PC, Williams EP, Bishai WR. 2008. Altered expression of isoniazid-regulated genes in drug-treated dormant Mycobacterium tuberculosis. J. Antimicrob. Chemother. 61:323–331 [DOI] [PubMed] [Google Scholar]
- 44. Karakousis PC, et al. 2004. Dormancy phenotype displayed by extracellular Mycobacterium tuberculosis within artificial granulomas in mice. J. Exp. Med. 200:647–657 [DOI] [PMC free article] [PubMed] [Google Scholar]
- 45. Keller A, Nesvizhskii AI, Kolker E, Aebersold R. 2002. Empirical statistical model to estimate the accuracy of peptide identifications made by MS/MS and database search. Anal. Chem. 74:5383–5392 [DOI] [PubMed] [Google Scholar]
- 46. Kirksey MA, et al. 2011. Spontaneous phthiocerol dimycocerosate-deficient variants of Mycobacterium tuberculosis are susceptible to gamma interferon-mediated immunity. Infect. Immun. 79:2829–2838 [DOI] [PMC free article] [PubMed] [Google Scholar]
- 47. Kondo E, Kanai K. 1976. A suggested role of a host-parasite lipid complex in mycobacterial infection. Jpn. J. Med. Sci. Biol. 29:199–210 [DOI] [PubMed] [Google Scholar]
- 48. Lavollay M, et al. 2008. The peptidoglycan of stationary-phase Mycobacterium tuberculosis predominantly contains cross-links generated by L,D-transpeptidation. J. Bacteriol. 190:4360–4366 [DOI] [PMC free article] [PubMed] [Google Scholar]
- 49. Li MH, Ung PM, Zajkowski J, Garneau-Tsodikova S, Sherman DH. 2009. Automated genome mining for natural products. BMC Bioinformatics 10:185. [DOI] [PMC free article] [PubMed] [Google Scholar]
- 50. Lonnroth K, et al. 2010. Tuberculosis control and elimination-50: cure, care, and social development. Lancet 375:1814–1829 [DOI] [PubMed] [Google Scholar]
- 51. Louw GE, et al. 2011. Rifampicin reduces susceptibility to ofloxacin in rifampicin-resistant Mycobacterium tuberculosis through efflux. Am. J. Respir. Crit. Care Med. 184:269–276 [DOI] [PMC free article] [PubMed] [Google Scholar]
- 52. Mahapatra S, Scherman H, Brennan PJ, Crick DC. 2005. N glycosylation of the nucleotide precursors of peptidoglycan biosynthesis of Mycobacterium spp. is altered by drug treatment. J. Bacteriol. 187:2341–2347 [DOI] [PMC free article] [PubMed] [Google Scholar]
- 53. Manganelli R, Dubnau E, Tyagi S, Kramer FR, Smith I. 1999. Differential expression of 10 sigma factor genes in Mycobacterium tuberculosis. Mol. Microbiol. 31:715–724 [DOI] [PubMed] [Google Scholar]
- 54. Mani C, Selvakumar N, Narayanan S, Narayanan PR. 2001. Mutations in the rpoB gene of multidrug-resistant Mycobacterium tuberculosis clinical isolates from India. J. Clin. Microbiol. 39:2987–2990 [DOI] [PMC free article] [PubMed] [Google Scholar]
- 55. Mehaffy C, et al. 2010. Descriptive proteomic analysis shows protein variability between closely related clinical isolates of Mycobacterium tuberculosis. Proteomics 10:1966–1984 [DOI] [PMC free article] [PubMed] [Google Scholar]
- 56. Murry JP, Pandey AK, Sassetti CM, Rubin EJ. 2009. Phthiocerol dimycocerosate transport is required for resisting interferon-gamma-independent immunity. J. Infect. Dis. 200:774–782 [DOI] [PMC free article] [PubMed] [Google Scholar]
- 57. Parish T, Brown A. 2009. Mycobacterium: genomics and molecular biology. Caister Academic Press, Norfolk, United Kingdom [Google Scholar]
- 58. Park HD, et al. 2003. Rv3133c/dosR is a transcription factor that mediates the hypoxic response of Mycobacterium tuberculosis. Mol. Microbiol. 48:833–843 [DOI] [PMC free article] [PubMed] [Google Scholar]
- 59. Reed MB, et al. 2004. A glycolipid of hypervirulent tuberculosis strains that inhibits the innate immune response. Nature 431:84–87 [DOI] [PubMed] [Google Scholar]
- 60. Rouse DA, Li Z, Bai GH, Morris SL. 1995. Characterization of the katG and inhA genes of isoniazid-resistant clinical isolates of Mycobacterium tuberculosis. Antimicrob. Agents Chemother. 39:2472–2477 [DOI] [PMC free article] [PubMed] [Google Scholar]
- 61. Rousseau C, et al. 2004. Production of phthiocerol dimycocerosates protects Mycobacterium tuberculosis from the cidal activity of reactive nitrogen intermediates produced by macrophages and modulates the early immune response to infection. Cell Microbiol. 6:277–287 [DOI] [PubMed] [Google Scholar]
- 62. Rustad TR, Harrell MI, Liao R, Sherman DR. 2008. The enduring hypoxic response of Mycobacterium tuberculosis. PLoS One 3:e1502 doi:10.1371/journal.pone.0001502. [DOI] [PMC free article] [PubMed] [Google Scholar]
- 63. Sartain MJ, Slayden RA, Singh KK, Laal S, Belisle JT. 2006. Disease state differentiation and identification of tuberculosis biomarkers via native antigen array profiling. Mol. Cell. Proteomics 5:2102–2113 [DOI] [PubMed] [Google Scholar]
- 64. Sassetti CM, Boyd DH, Rubin EJ. 2003. Genes required for mycobacterial growth defined by high density mutagenesis. Mol. Microbiol. 48:77–84 [DOI] [PubMed] [Google Scholar]
- 65. Shah NS, et al. 2007. Worldwide emergence of extensively drug-resistant tuberculosis. Emerg. Infect. Dis. 13:380–387 [DOI] [PMC free article] [PubMed] [Google Scholar]
- 66. Smith CA, et al. 2005. METLIN: a metabolite mass spectral database. Ther. Drug Monit. 27:747–751 [DOI] [PubMed] [Google Scholar]
- 67. Subramanian A, et al. 2005. Gene set enrichment analysis: a knowledge-based approach for interpreting genome-wide expression profiles. Proc. Natl. Acad. Sci. U. S. A. 102:15545–15550 [DOI] [PMC free article] [PubMed] [Google Scholar]
- 68. Takayama K, Wang L, David HL. 1972. Effect of isoniazid on the in vivo mycolic acid synthesis, cell growth, and viability of Mycobacterium tuberculosis. Antimicrob. Agents Chemother. 2:29–35 [DOI] [PMC free article] [PubMed] [Google Scholar]
- 69. Tala A, et al. 2009. Activation of dormant bacterial genes by Nonomuraea sp. strain ATCC 39727 mutant-type RNA polymerase. J. Bacteriol. 191:805–814 [DOI] [PMC free article] [PubMed] [Google Scholar]
- 70. Telenti A, et al. 1993. Detection of rifampicin-resistance mutations in Mycobacterium tuberculosis. Lancet 341:647–650 [DOI] [PubMed] [Google Scholar]
- 71. Thayil SM, Morrison N, Schechter N, Rubin H, Karakousis PC. 2011. The role of the novel exopolyphosphatase MT0516 in Mycobacterium tuberculosis drug tolerance and persistence. PLoS One 6:e28076 doi:10.1371/journal.pone.0028076. [DOI] [PMC free article] [PubMed] [Google Scholar]
- 72. Trivedi OA, et al. 2005. Dissecting the mechanism and assembly of a complex virulence mycobacterial lipid. Mol. Cell 17:631–643 [DOI] [PubMed] [Google Scholar]
- 73. Vitali B, et al. 2008. Molecular and phenotypic traits of in-vitro-selected mutants of Bifidobacterium resistant to rifaximin. Int. J. Antimicrob. Agents 31:555–560 [DOI] [PubMed] [Google Scholar]
- 74. Vizcaino JA, et al. 2010. The Proteomics Identifications database: 2010 update. Nucleic Acids Res. 38:D736–D742 [DOI] [PMC free article] [PubMed] [Google Scholar]
- 75.WHO 2010. Global tuberculosis control 2010. World Health Organization, Geneva, Switzerland [Google Scholar]
- 76.WHO 2010. Multi-drug and extensively drug-resistant TB (M/XDR-TB): 2010 global report on surveillance and response. World Health Organization, Geneva, Switzerland [Google Scholar]
- 77. Wright A, et al. 2009. Epidemiology of antituberculosis drug resistance 2002–07: an updated analysis of the Global Project on Anti-Tuberculosis Drug Resistance Surveillance. Lancet 373:1861–1873 [DOI] [PubMed] [Google Scholar]
- 78. Yue J, et al. 2003. Mutations in the rpoB gene of multidrug-resistant Mycobacterium tuberculosis isolates from China. J. Clin. Microbiol. 41:2209–2212 [DOI] [PMC free article] [PubMed] [Google Scholar]
- 79. Zazopoulos E, et al. 2003. A genomics-guided approach for discovering and expressing cryptic metabolic pathways. Nat. Biotechnol. 21:187–190 [DOI] [PubMed] [Google Scholar]
Associated Data
This section collects any data citations, data availability statements, or supplementary materials included in this article.