

Abstract
Objective
To determine whether targeted pharmacological improvement of insulin sensitivity will normalize the associated elevations of thrombotic and inflammatory cardiovascular disease (CVD) biomarkers in individuals with insulin resistance.
Patients and Methods
Study 1 was a cross-sectional study of Asian Indians with and without diabetes mellitus and Northern European Americans without diabetes (n=14 each) conducted between December 11, 2003, and July 14, 2006. Study 2 was a secondary analysis of a double-blind randomized controlled study conducted between August 19, 2005, and August 24, 2010, that included 25 individuals with untreated diabetes or impaired fasting glucose who were randomized to receive placebo (n=13) or a combination of metformin, 1000 mg twice daily, and pioglitazone, 45 mg daily (n=12), for 3 months. In both studies, measurements of insulin sensitivity (euglycemic-hyperinsulinemic clamp) and plasma inflammatory and thrombotic factor concentrations were obtained on enrollment (studies 1 and 2) and after intervention (study 2).
Results
Study 1 demonstrated significant correlations between insulin sensitivity and plasma adiponectin, high-density lipoprotein cholesterol, plasminogen activator inhibitor 1, interleukin 6, tumor necrosis factor α, and triglycerides. Insulin sensitizer therapy significantly improved insulin sensitivity, inflammatory cytokines except interleukin 6, and thrombotic factors except fibrinogen, without concomitant changes in weight, blood pressure, or body composition.
Conclusion
Insulin sensitizer therapy ameliorates inflammatory and thrombotic factors implicated in developing CVD. Interventions to improve insulin sensitivity may thus be considered as therapeutic options to reduce CVD burden in insulin-resistant states, although further research is needed to determine long-term effects on morbidity and mortality.
Trial Registration
clinicaltrials.gov identifier: NCT00443755 (study 2)
Abbreviations and Acronyms: BMI, body mass index; CRP, C-reactive protein; CVD, cardiovascular disease; FFM, fat-free mass; GIR, glucose infusion rate; HbA1c, glycosylated hemoglobin; HDL-C, high-density lipoprotein cholesterol; IL-6, interleukin 6; PAI-1, plasminogen activator inhibitor 1; TNF-α, tumor necrosis factor α
Individuals with diabetes mellitus are disproportionately affected by atherothrombotic disorders, including cardiovascular, cerebrovascular, and peripheral vascular diseases. Atherothrombotic disease risk and mortality are also increased with metabolic syndrome, a constellation of risk factors present in more than 34% of US adults,1 even in the absence of diabetes.2 Which among the 5 clinical criteria defining metabolic syndrome underlies this risk is widely researched and debated. These criteria, as defined by the third report of the National Cholesterol Education Program Adult Treatment Panel, include abdominal obesity, elevated triglyceride level, low high-density lipoprotein cholesterol (HDL-C) level, hypertension, and impaired fasting glucose (glucose level ≥100 mg/dL [to convert to mmol/L, multiply by 0.0555]).3,4 Yet, large clinical trials of diabetes therapies have shown that conventional cardiovascular disease (CVD) risk factors, specifically hyperglycemia and hypertension, do not fully account for increased CVD risk associated with type 2 diabetes.5-7 Attention therefore shifted to alternative risk factors, including insulin resistance and inflammation.8,9
Elevations of circulating atherogenic factors and inflammatory cytokines have been detected previously in individuals with insulin resistance, including those with prediabetes and diabetes. Among thrombogenic markers, these factors include the antifibrinolytic plasminogen activator inhibitor 1 (PAI-1)10,11 and the prothrombotic fibrinogen.9,12 Similarly, atherogenic dyslipidemia, characterized by high triglyceride and low HDL-C levels,8 is highly prevalent in both prediabetic and diabetic patients.13,14 Inflammatory cytokines, particularly interleukin 6 (IL-6), tumor necrosis factor α (TNF-α), and C-reactive protein (CRP), are increased in these states.15 Conversely, concentrations of the anti-inflammatory cytokine adiponectin are decreased with diabetes and insulin resistance.16,17 Many of the same factors have been implicated in the pathogenesis of CVD,15 suggesting that there may be an etiologic link among insulin resistance, inflammation, and thrombotic events.
If insulin resistance is shown to drive the heightened CVD risk in patients with diabetes and metabolic syndrome, targeted pharmacological improvement of insulin sensitivity, rather than intensive glycemic control, may prove to be the elusive key to managing these macrovascular complications. Two insulin-sensitizing agents, metformin and pioglitazone, are currently approved for the treatment of diabetes and, in the case of metformin, other insulin-resistant states, such as polycystic ovarian syndrome. Both have been retrospectively found to lower the CVD event rate and mortality.18-25 However, to date, no randomized controlled trials have focused specifically on the effects of pioglitazone plus metformin on improvements in insulin sensitivity and atherothrombotic risk factors in insulin-resistant individuals without underlying CVD.
We hypothesized that the increased atherothrombotic disease risk in diabetes and metabolic syndrome, manifested by elevated concentrations of circulating prothrombotic and proinflammatory factors, is in part due to insulin resistance. Thus, if insulin sensitivity influences thrombotic and inflammatory burden, then circulating concentrations of prothrombotic and proinflammatory factors will be disproportionately higher in individuals with greater insulin resistance. They will also be higher in ethnic groups particularly prone to diabetes and CVD, such as Asian Indians, who have higher prevalences of insulin resistance, type 2 diabetes, and CVD than expected for their age and body mass index (BMI; calculated as weight in kilograms divided by height in meters squared).26,27 Finally, if indeed modulated by insulin sensitivity, these factors should improve with insulin sensitizer therapy in direct proportion to increase in insulin sensitivity. Establishing a clear relationship between insulin sensitivity assessed using the criterion standard hyperinsulinemic-euglycemic clamp and clinically validated biomarkers of inflammation and thrombosis may pave the way for targeted treatment of insulin resistance to mitigate atherothrombotic disease burden.
Patients and Methods
Study 1
Fourteen Asian Indians with diabetes, 14 Asian Indians without diabetes, and 14 Northern European Americans without diabetes (40-75 years old with BMIs of 22 to 34) frequency matched for sex, age, and BMI were included in this cross-sectional study. The study was conducted between December 11, 2003, and July 14, 2006. Asian Indians with diabetes had a clinically established diagnosis of diabetes (fasting glucose level ≥126 mg/dL at the time of diagnosis), whereas Asian Indians without diabetes and Northern European Americans without diabetes had fasting glucose levels less than 100 mg/dL and were not receiving any antihyperglycemic treatment. Some patients were included in a previous study of mitochondrial dysfunction with insulin resistance.26 Participants with diabetes were treated with metformin alone (n=4); sulfonylurea and thiazolidinedione (n=1); metformin and sulfonylurea (n=5); metformin and thiazolidinedione (n=1); metformin, sulfonylurea, and thiazolidinedione (n=2); and insulin, metformin, and sulfonylurea (n=1). Thiazolidinedione therapy was stopped 3 weeks before the study. Treatment with all other agents was stopped 5 days before the study. Subcutaneous injection of regular insulin was used in the interim to maintain fasting blood glucose levels between 80 and 140 mg/dL.
Study 2
Northern European Americans (n=28) with impaired fasting glucose or diabetes (fasting glucose levels of 100-180 mg/dL and BMIs of 27 to 36) who never received antihyperglycemic treatment were recruited for a double-blind, randomized, placebo-controlled study (www.clinicaltrials.gov identifier NCT00443755) (Figure 1). The study was conducted between August 19, 2005, and August 24, 2010. Participants were randomized to receive either placebo or a combination of pioglitazone (45 mg daily) and metformin (1000 mg twice daily) for 3 months. Twenty-eight individuals with impaired fasting glucose or type 2 diabetes were enrolled in the study; none had been previously treated with insulin or other antihyperglycemic agents. Three did not complete the study because of personal reasons (1 participant in each group) or inability to tolerate study procedures (1 participant in treatment group) (Figure 1). In total, 12 patients in the treatment group and 13 in the placebo group completed the study and were included in the analysis. Both agents were titrated up from starting doses of pioglitazone (30 mg daily) and metformin (500 mg twice daily) for 2 weeks; no adverse effects were reported.
FIGURE 1.
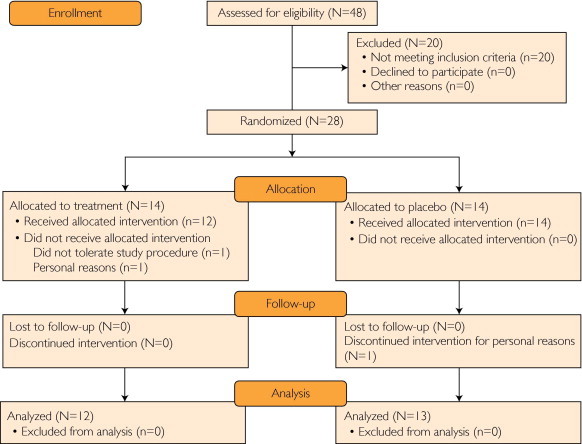
Study flow diagram.
For both studies, exclusion criteria included known CVD, liver or kidney disease, and other chronic diseases. Written informed consent was obtained from all study participants before enrollment. The study protocols and consent forms were approved by the Mayo Clinic Institutional Review Board.
Measurements
All demographic and laboratory measurements were obtained during an inpatient study day: once in study 1 (association study) and twice (baseline and 3 months) in study 2 (insulin sensitizer study). All measurements in study 2 were obtained after randomization. For each of the study days, participants were admitted to the Mayo Clinic Clinical Research Unit on the preceding evening and a standardized meal was provided. Insulin sensitivity was measured the following morning after an overnight fast using a hyperinsulinemic (1.5 μU/kg of fat-free mass [FFM] per minute)-euglycemic (85-95 mg/dL) clamp; in study 1, insulin alone was infused, whereas in study 2, insulin was infused with 5% essential amino acid solution (3 mL/kg of FFM/hour) (NephrAmine; B. Braun Medical Inc, Irvine, CA) to prevent the insulin-dependent decrease of amino acids during insulin infusion. The mean glucose infusion rate (GIR) was calculated as the rate per kilograms of FFM during 4 hours of steady state (hours 4 through 8 of the 8-hour clamp). The FFM was measured by dual-energy x-ray absorptiometry. All marker measurements were performed on stored plasma. Adiponectin, lipids, high-sensitivity CRP, IL-6, and TNF-α were measured as previously described.26 Glycosylated hemoglobin (HbA1c) was measured by ion-exchange chromatography, insulin by immunoenzymatic assay, PAI-1 by enzyme-linked immunosorbent assay (Diagnostica Stago Inc, Parsippany, NJ), fibrinogen by thrombin clotting rate assay (Beckman Coulter Inc, Brea, CA), and antithrombin III by chromogenic assay (Beckman Coulter Inc).
Statistical Analyses
For the initial correlative analysis (study 1), unadjusted and adjusted analyses were conducted to test whether factor concentrations varied across the 3 patient populations with different concentrations of insulin sensitivity. Unadjusted differences were tested with the Kruskal-Wallis test with post hoc comparisons with the Wilcoxon rank sum test. Adjusted analyses were tested with multiple linear regression with age, sex, and BMI used as covariates. For the analysis of the randomized trial (study 2), the change from baseline to 3 months for each factor was used as the outcome measure. Differences in the change scores among the groups were tested using the Wilcoxon rank sum test. For the biomarkers of interest, the P values for these change score differences were also adjusted for multiple comparisons using the method of Hochberg.28 Correction for multiple testing was not applied to study 1 results given their exploratory (hypothesis-generating) nature or to descriptive comparisons in study 2. All analyses were conducted using SAS statistical software, version 9.2 (SAS Institute Inc, Cary, NC).
Results
Study 1: Relationship Between Insulin Resistance and Thrombotic and Inflammatory Factors
Clinical and demographic characteristics of participants in study 1 are summarized in Table 1. Insulin sensitivity was determined as the mean GIR necessary to maintain euglycemia (target glucose level of 90 mg/dL) during a constant infusion of insulin; higher GIR is indicative of higher insulin sensitivity (eg, lower insulin resistance). Among all study participants, GIR ranged from 2.5 to 97.9 μmol/kg of FFM/min (interquartile range, 23.7-63.1 μmol/kg of FFM/min).
TABLE 1.
Study 1 Participant Demographic and Metabolic Characteristicsa
| Variableb,c | Kruskal-Wallis P value | Wilcoxon rank sum P values |
|||||
|---|---|---|---|---|---|---|---|
| NEA (n=14) | AI (n=14) | AI-D (n=14) | NEA vs AI | AI vs AI-D | NEA vs AI-D | ||
| Demographic characteristics | |||||||
| Age (y) | 46.6 (8.0) | 46.7 (8.9) | 54.6 (11.6) | .07 | .91 | .05 | .04 |
| Female, No. (%)d | 6 (43) | 6 (43) | 5 (36) | .91 | |||
| BMI | 24.6 (2.7) | 23.9 (1.9) | 26.6 (3.5) | .07 | .27 | .04 | .17 |
| GIR (μmol/kg of FFM per minute) | 66.52 (12.22) | 41.59 (14.26) | 21.85 (13.15) | <.001 | .001 | .004 | <.001 |
| Lipid profile | |||||||
| Triglycerides (mg/dL) | 90 (29) | 142 (79) | 114 (52) | .15 | .07 | .48 | .24 |
| HDL-C (mg/dL) | 49 (9) | 38 (12) | 34 (7) | .002 | .03 | .40 | .001 |
| Non–HDL-C (mg/dL) | 120 (30) | 135 (30) | 125 (34) | .47 | .27 | .38 | .84 |
| Thrombotic markers | |||||||
| Fibrinogen (mg/dL)e | 150.7 (51.3) | 181.7 (59.5) | 213.1 (74.6) | .05 | .11 | .32 | .04 |
| PAI-1 (ng/dL)e | 8.1 (5.6) | 14.6 (7.9) | 19.4 (12.1) | .002 | .02 | .22 | .003 |
| AT-III (% activity) | 108.9 (8.2) | 110.1 (10.3) | 102.8 (7.2) | .05 | .65 | .03 | .06 |
| Inflammatory markers | |||||||
| CRP (mg/dL)e | 0.14 (0.15) | 0.09 (0.08) | 0.52 (0.68) | .001 | .19 | .002 | .01 |
| IL-6 (pg/mL)e | 1.1 (0.6) | 2.0 (1.2) | 6.1 (3.9) | <.001 | .006 | .001 | <.001 |
| TNF-α (pg/mL)e | 1.4 (0.4) | 1.7 (0.3) | 3.1 (3.3) | <.001 | .05 | .01 | .002 |
| Adiponectin (mg/mL)e | 11.7 (3.7) | 8.4 (3.1) | 6.2 (2.9) | <.001 | .02 | .10 | .001 |
AI = Asian Indians without diabetes; AI-D = Asian Indians with diabetes; AT-III = antithrombin III; BMI = body mass index; CRP = C-reactive protein; FFM = fat-free mass; GIR = glucose infusion rate; HDL-C = high-density lipoprotein cholesterol; IL-6 = interleukin 6; NEA = Northern European Americans without diabetes; PAI-1 = plasminogen activator inhibitor 1; TNF-α = tumor necrosis factor α.
SI conversion factors: To convert triglyceride levels to mmol/L, multiply by 0.0113; to convert HDL-C levels to mmol/L, multiply by 0.0259; to convert non–HDL-C levels to mmol/L, multiply by 0.0259; to convert fibrinogen levels to μmol/L, multiply by 0.0294; and to convert CRP levels to mg/L, multiply by 10.
Characteristics of participants recruited for study 1 (preliminary association study), grouped by ethnicity and diabetic status. The GIR was calculated as mean rate of glucose infusion maintaining euglycemia during hours 4 through 8 of an 8-hour insulin infusion. Data are mean ± SD.
Differences tested using Pearson χ2 test.
Inflammatory markers and coagulation factors were log transformed before analysis to minimize effect of outlying values.
The potential effect of ethnicity on prothrombotic and proinflammatory factors was assessed in Asian Indians without diabetes and Northern European Americans without diabetes, thereby eliminating the potential confounding effect of diabetes. As indicated in Table 1, Asian Indians without diabetes had significantly lower insulin sensitivity and higher concentrations of circulating IL-6, TNF-α, and PAI-1 than Northern European Americans without diabetes. In contrast, their concentrations of adiponectin and HDL-C were significantly lower. Similarly, comparisons between Asian Indians with and without diabetes revealed that Asian Indians with diabetes had significantly lower insulin sensitivity and higher concentrations of IL-6, TNF-α, and CRP than Asian Indians without diabetes (Table 1). The PAI-1 level was higher in Asian Indians with diabetes than in Asian Indians without diabetes; however, this difference failed to reach statistical significance. Although Asian Indians with diabetes had a higher BMI than Asian Indians without diabetes (26.6±3.5 vs 23.9±1.9), the observed differences in thrombotic and inflammatory factor concentrations remained significant after adjustment for BMI.
We hypothesized that the observed differences in inflammatory and thrombotic factors as a function of ethnicity and presence of diabetes may be in part due to underlying differences in insulin sensitivity among the groups. Because insulin sensitivity varied widely among the participants, cross-sectional assessment of potential associations between insulin sensitivity and key prothrombotic and proinflammatory factors could be performed (Table 2). After adjustment for age, sex, and BMI, concentrations of the antifibrinolytic PAI-1 were inversely correlated to insulin sensitivity (r=−0.492). No association was found between insulin sensitivity and either fibrinogen or antithrombin III. Among inflammatory cytokines, both TNF-α (r=−0.420) and IL-6 (r=−0.541) were inversely correlated with insulin sensitivity, whereas the anti-inflammatory cytokine adiponectin was positively correlated with insulin sensitivity (r=0.619). The relationship between insulin sensitivity and CRP level, and insulin sensitivity and non–HDL-C level, showed trends toward inverse correlation but failed to reach statistical significance (Table 2). Finally, HDL-C concentrations were positively correlated with insulin sensitivity (r=0.461), and triglyceride concentrations were negatively correlated with insulin sensitivity (r=−0.322). These associations remained unaffected by subgroup analysis that included either only Asian Indians (with or without diabetes) or only participants without diabetes (Northern European Americans and Asian Indians).
TABLE 2.
The Relationship Between Insulin Sensitivity and Markers of Thrombosis and Inflammationa
| Variableb,c | Pearson correlation |
Partial (adjusted) correlation |
|||
|---|---|---|---|---|---|
| r | P value | r | r2 | P value | |
| Lipid profile | |||||
| Triglycerides (mg/dL) | −0.319 | .04 | −0.322 | 0.104 | .05 |
| HDL-C (mg/dL) | 0.527 | <.001 | 0.461 | 0.213 | .003 |
| Non–HDL-C (mg/dL) | −0.191 | .23 | −0.222 | 0.049 | .18 |
| Thrombotic markers | |||||
| Fibrinogen (mg/dL)d | −0.191 | .23 | −0.198 | 0.039 | .24 |
| PAI-1 (ng/dL)d | −0.588 | <.001 | −0.492 | 0.242 | .001 |
| AT-III (% activity) | 0.092 | .56 | −0.073 | 0.005 | .66 |
| Inflammatory markers | |||||
| CRP (mg/dL)d | −0.214 | .17 | −0.207 | 0.043 | .21 |
| IL-6 (pg/mL)d | −0.594 | <.001 | −0.541 | 0.293 | <.001 |
| TNF-α (pg/mL)d | −0.419 | .006 | −0.420 | 0.177 | .007 |
| Adiponectin (mg/mL)d | 0.634 | <.001 | 0.619 | 0.383 | <.001 |
AT-III = antithrombin III; BMI = body mass index; CRP = C-reactive protein; HDL-C = high-density lipoprotein cholesterol; IL-6 = interleukin 6; NEA = Northern European Americans without diabetes; PAI-1 = plasminogen activator inhibitor 1; TNF-α = tumor necrosis factor α.
SI conversion factors: To convert triglyceride levels to mmol/L, multiply by 0.0113; to convert HDL-C levels to mmol/L, multiply by 0.0259; to convert non–HDL-C levels to mmol/L, multiply by 0.0259; to convert fibrinogen levels to μmol/L, multiply by 0.0294; and to convert CRP levels to mg/L, multiply by 10.
Insulin sensitivity was calculated as mean rate of glucose infusion maintaining euglycemia during hours 4 through 8 of an 8-hour insulin infusion, when steady-state dynamics have been achieved. Partial correlation reflects adjustment for age, sex, and BMI. The r2 value is the partial coefficient of determination, adjusted for age, sex, and BMI.
Inflammatory markers and coagulation factors were log transformed to minimize effect of outlying values.
Study 2: Insulin Sensitizer Therapy Effect on Atherothrombotic and Inflammatory Profiles
Twenty-five individuals with impaired fasting glucose or type 2 diabetes completed the study (Figure 1); none had been previously treated with insulin or other antihyperglycemic agents (Table 3). At baseline, fasting glucose concentrations ranged from 100.5 to 192.5 mg/dL (interquartile range, 109.5-142 mg/dL); each value is the mean of 2 independent measurements. Similar to the results in study 1, insulin sensitivity was determined to be the mean GIR necessary to maintain euglycemia during a hyperinsulinemic-euglycemic clamp. However, in study 2, insulin was coinfused with essential amino acids to prevent the decrease in plasma essential amino acids that can occur during infusion of insulin. Absolute GIR values therefore cannot be compared across studies but are comparable within studies. No difference was found in age, sex, fasting glucose level, HbA1c level, or GIR in individuals randomly assigned to treatment or placebo arms (Table 3). The GIR on enrollment ranged from 0.15 to 65.80 μmol/kg of FFM/min (interquartile range, 14.44-38.95 μmol/kg of FFM/min).
TABLE 3.
Insulin Sensitizer Effect on Atherothrombotic and Inflammatory Profiles After 3 Months of Treatment With Insulin Sensitizer or Placeboa
| Variableb,c | Insulin sensitizer (n=12) |
Placebo (n=13) |
Between groups |
|||||
|---|---|---|---|---|---|---|---|---|
| Baseline | 3 mo | Change | Baseline | 3 mo | Change | Unadjusted P value | Adjusted P value | |
| Demographic characteristics | ||||||||
| Age (y) | 52.5 (15.6) | 52.2 (18.2) | >.99 | – | ||||
| Female, No. (%) | 7 (58) | 8 (62) | .87 | – | ||||
| BMI | 32.43 (5.53) | 32.89 (5.49) | 0.49 (0.61) | 29.60 (3.23) | 29.42 (3.11) | −0.18 (0.46) | <.001 | – |
| FFM (kg) | 48.81 (14.98) | 47.68 (12.91) | −1.13 (2.75) | 46.67 (13.27) | 46.33 (13.52) | −0.34 (1.26) | .65 | – |
| Body fat (%) | 46.49 (5.79) | 48.22 (4.73) | 1.73 (3.01) | 43.26 (8.99) | 43.25 (8.68) | −0.01 (1.41) | .06 | – |
| Glycemic control | ||||||||
| Glucose (mg/dL) | 126.25 (21.39) | 106.29 (12.98) | −19.96 (13.71) | 129.00 (25.79) | 137.39 (43.96) | 8.39 (22.06) | <.001 | – |
| HbA1c (%) | 5.97 (0.69) | 5.62 (0.59) | −0.35 (0.39) | 6.25 (0.64) | 6.43 (1.12) | 0.19 (0.56) | .001 | – |
| Insulin sensitivity | ||||||||
| GIR (μm/kg of FFM/min) | 22.28 (14.35) | 40.23 (13.07) | 17.95 (8.41) | 23.40 (14.96) | 25.08 (17.81) | 1.68 (7.41) | <.001 | – |
| Insulin (μU/mL) | 15.68 (9.54) | 8.26 (3.87) | −8.13 (7.29) | 10.18 (5.58) | 11.55 (6.96) | 1.38 (3.22) | <.001 | – |
| Lipid profile | ||||||||
| Triglycerides (mg/dL) | 131.42 (53.55) | 115.83 (54.10) | −15.58 (31.95) | 135.00 (50.33) | 152.77 (62.95) | 17.77 (28.29) | .003 | .02 |
| HDL-C (mg/dL) | 43.33 (12.50) | 47.67 (14.13) | 4.33 (6.60) | 39.23 (8.53) | 38.92 (9.84) | −0.31 (3.82) | .01 | .03 |
| Non–HDL-C (mg/dL) | 135.58 (25.59) | 128.08 (32.73) | −7.50 (14.95) | 132.46 (21.21) | 137.08 (27.41) | 4.62 (17.40) | .01 | .03 |
| Thrombotic markers | ||||||||
| Fibrinogen (mg/dL) | 393.67 (76.90) | 407.67 (103.83) | 14.00 (69.67) | 418.92 (98.20) | 400.31 (62.19) | −18.62 (61.64) | .09 | .09 |
| PAI-1 (ng/dL) | 8.18 (2.15) | 4.77 (2.53) | −3.42 (2.48) | 5.59 (3.30) | 6.40 (2.69) | 0.82 (3.01) | <.001 | .001 |
| Inflammatory markers | ||||||||
| CRP (mg/dL) | 0.42 (0.42) | 0.23 (0.23) | −0.19 (0.22) | 0.43 (0.48) | 0.28 (0.23) | −0.15 (0.52) | .006 | .03 |
| IL-6 (pg/mL) | 2.46 (1.64) | 1.47 (0.57) | −0.99 (1.41) | 3.28 (4.69) | 1.85 (0.72) | −1.42 (4.74) | .04 | .07 |
| TNF-α (pg/mL) | 1.40 (0.55) | 1.26 (0.51) | −0.13 (0.20) | 2.98 (5.23) | 3.15 (5.22) | 0.18 (0.36) | .001 | .008 |
| Adiponectin (mg/mL) | 6.08 (2.13) | 15.24 (6.63) | 9.1 (5.10) | 5.22 (2.09) | 5.68 (2.80) | 4.61 (0.91) | <.001 | .001 |
BMI = body mass index; CRP = C-reactive protein; FFM = fat-free mass; GIR = glucose infusion rate; HbA1c = glycosylated hemoglobin; HDL-C = high-density lipoprotein cholesterol; IL-6 = interleukin 6; NEA = Northern European Americans without diabetes; PAI-1 = plasminogen activator inhibitor 1; TNF-α = tumor necrosis factor α.
SI conversion factors: To convert glucose levels to mmol/L, multiply by 0.0555; to convert insulin levels to pmol/L, multiply by 6.945; to convert triglyceride levels to mmol/L, multiply by 0.0113; to convert HDL-C levels to mmol/L, multiply by 0.0259; to convert non–HDL-C levels to mmol/L, multiply by 0.0259; to convert fibrinogen levels to μmol/L, multiply by 0.0294; and to convert CRP levels to mg/L, multiply by 10.
The GIR was calculated as mean rate of glucose infusion maintaining euglycemia during hours 4 through 8 of an 8-hour insulin and essential amino acid infusion. Data are mean ± SD. P values are from Wilcoxon rank sum comparisons of the change scores between groups. Both unadjusted and adjusted (Hochberg) P values are reported.
After 3 months of metformin and pioglitazone therapy, participants in the treatment arm experienced significant improvements in insulin sensitivity and fasting glucose and insulin concentrations (all P≤.001) (Table 3). The HbA1c levels also decreased with treatment, but the observed difference was small (5.97%±0.69% vs 5.62%±0.59%). Blood pressure and heart rate were not affected by treatment (data not shown). The BMI tended to increase in the treatment arm (32.43±5.53 to 32.89±5.49), primarily as a result of a nonsignificant trend toward increased fat mass with treatment, and there was no change in FFM (Table 3).
Three months of insulin sensitizer therapy yielded significantly greater improvements in all lipid parameters compared with placebo, including a 10% increase in HDL-C level (adjusted P=.03; Figure 2A), 5.5% decrease in non–HDL-C level (adjusted P=.03), and 11.9% decrease in triglyceride level (adjusted P=.02) (Table 3; Figure 2B). The PAI-1 level decreased by 41.8% with treatment (adjusted P=.001; Figure 2C). Consistent with the findings in study 1, which demonstrated that fibrinogen concentration did not correlate with insulin sensitivity, insulin sensitizer therapy had no effect on fibrinogen concentration (Table 3; Figure 2D).
FIGURE 2.
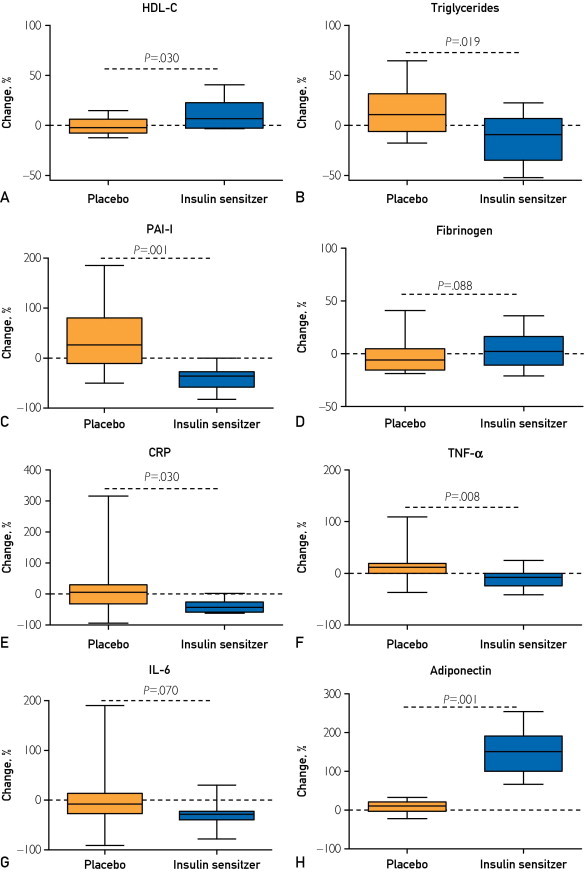
Effects of insulin sensitizer therapy. Mean percent change in clinical measures of insulin sensitivity, inflammation, and thrombosis during 3 months of treatment (metformin plus pioglitazone) vs placebo. Error bars indicate SD. CRP = C-reactive protein; HDL-C = high-density lipoprotein cholesterol; IL-6 = interleukin 6; PAI-1 = plasminogen activator inhibitor 1; TNF-α = tumor necrosis factor α.
Similar favorable changes in inflammatory cytokines were induced by insulin sensitizer therapy, as summarized in Table 3. Significantly greater reductions in CRP (45.2% reduction; adjusted P=.03; Figure 2E) and TNF-α (9.3% reduction; adjusted P=.008; Figure 2F) were observed in the treated group during the treatment period. Although IL-6 concentrations decreased by 40.2% with treatment, the decrease in IL-6 was no longer statistically significant after adjustment for multiple comparisons (Figure 2G). The treatment group also had a greater increase in the anti-inflammatory adiponectin than the placebo group (149.7% increase; adjusted P=.001; Figure 2H). For all variables, treatment effect remained significant after adjustment for interim changes in BMI, HbA1c level, and fasting glucose concentration.
Discussion
Results from the 2 studies reveal a close association between insulin sensitivity and nearly all of the key thrombotic and inflammatory factors thought to modulate CVD risk. This relationship was apparent in different ethnic groups and was independent of the presence of diabetes. More important, targeted pharmacological improvement of insulin sensitivity significantly improved nearly all of the thrombotic and inflammatory biomarkers without lowering blood pressure or weight or altering body composition. Although fasting glucose levels improved with treatment, all treatment-related improvements in PAI-1, CRP, TNF-α, adiponectin, triglycerides, HDL-C, and non–HDL-C remained significant after adjustment for interim changes in HbA1c and fasting glucose concentrations. This finding reinforces the hypothesis that hyperglycemia, hypertension, and adiposity do not account for the entirety of thrombotic and inflammatory dysregulation present in individuals with impaired fasting glucose and type 2 diabetes.
Study 2 clearly demonstrated that therapeutic doses of metformin and pioglitazone have a favorable effect on many important CVD risk factors. Although on the basis of these data one cannot conclude definitively that improvement in insulin sensitivity alone caused all of the favorable changes in thrombotic and inflammatory factors, these changes occurred with improved insulin sensitivity and independent of glycemia, blood pressure, and body composition. The parallel, double-blind, randomized controlled study design minimized potential confounders of dietary and physical activity modifications.
Insulin resistance is a key feature of metabolic syndrome and has been proposed to be the unifying abnormality underlying atherothrombotic risk among individuals with both diabetes and metabolic syndrome.2,29 The ability of insulin sensitizer therapy to improve CVD biomarkers while improving insulin sensitivity but without altering blood pressure, weight, adiposity, or glycemic control further supports the importance of insulin resistance in driving CVD risk. It may similarly explain how in addition to improving insulin sensitivity, exercise30,31 and caloric restriction32 also significantly lower inflammatory cytokine levels.
Longer-term studies are needed to determine whether insulin sensitizer therapy in insulin-resistant individuals without diabetes will lower atherothrombotic event rates and/or mortality rates. Nonetheless, the observed improvements in inflammatory and thrombotic factors strongly support the theory that insulin-sensitizing agents can translate directly into improved clinical outcomes. Indeed, metformin-pioglitazone therapy increased HDL-C levels by 10% and adiponectin by 149.7% while lowering concentrations of triglycerides by 11.9% and CRP by 45.2%, all of which have been linked to decreased rates of fatal and nonfatal CVD events.33,34
Insulin sensitizer therapy was previously found to improve these molecular risk factors in individuals with known CVD,35 but no prior prospective studies specifically assessed the association between insulin sensitization and molecular CVD risk factors. Indeed, pioglitazone has been shown to reduce the risk of fatal and nonfatal stroke, as well as fatal and nonfatal myocardial infarction, in patients with type 2 diabetes with and without a history of stroke.22 Likewise, intensive medical therapy, which included insulin sensitization or insulin provision therapy, resulted in similar CVD outcomes during a 5-year period as did a more invasive revascularization strategy among patients with type 2 diabetes and angiographically confirmed CVD.25 Yet the study presented here represents the first prospective trial of insulin sensitizer therapy in individuals without known CVD.
These results also offer a potential mechanistic explanation for earlier observations that metformin and pioglitazone therapies lower CVD event rates in patients with type 2 diabetes.18,20,21,36 It remains to be determined whether insulin sensitizer therapy can similarly improve thrombotic and/or inflammatory profiles in individuals with other diseases characterized by insulin resistance, such as chronic kidney disease, polycystic ovarian syndrome, autoimmune disorders, and hypertension.
The significantly lower insulin sensitivity, along with the concomitantly higher concentrations of inflammatory and thrombotic factors, in Asian Indians without diabetes compared with Northern European Americans without diabetes observed in the current study may explain the disproportionately higher incidence of CVD among Asian groups.37,38 Consistent with previously published studies, Asian Indians without diabetes have greater insulin resistance and higher circulating levels of inflammatory markers than Northern European Americans without diabetes.26,39,40 We have also shown that prothrombotic factors are increased in Asian Indians without diabetes compared with Northern European Americans without diabetes, potentially contributing to CVD risk.
A potential limitation of the study 1 design is that a cohort of Northern European Americans with diabetes was not included in the study. Because Northern European Americans with type 2 diabetes tend to have significantly higher BMI than age-matched Asian Indians with diabetes, the marked discrepancies in BMI between the 2 groups would confound any conclusions drawn from the effect of insulin sensitivity itself. Indeed, the 9 participants of study 2 who met the criteria for diagnosis of diabetes on enrollment (fasting glucose level ≥126 mg/dL) had a mean BMI of 33±6.08 compared with 26.6±3.5 in Asian Indians with diabetes. Body mass index is known to be associated with the inflammatory and thrombotic factors under investigation, and the goal of our studies was to determine the potential contribution of insulin sensitivity to this relationship. The increase in CVD risk factors and insulin resistance despite significantly lower BMI are consistent with clinical data showing that Asian Indians develop diabetes and CVD at much lower BMI than Northern Europeans.
Conclusion
There is a close and direct association between insulin resistance and prothrombotic and proinflammatory factors linked to atherothrombotic disease. Metformin and pioglitazone combination therapy, in addition to enhancing insulin sensitivity, significantly improved these factors. As the number of individuals affected by obesity, diabetes, and related disorders increases, CVD will continue to incur great personal and economic losses. Targeted therapy of insulin resistance may ultimately help decrease some of this morbidity and mortality.
Acknowledgments
We thank Bobbie Soderberg, Clinical Research Unit staff, Maureen Bigelow, and technical staff in the Clinical Immunology Laboratory for skilled technical assistance. We are grateful to Takeda Pharmaceuticals America for supplying drug and placebo tablets.
Footnotes
Dr Soop is currently with the Auckland University North Shore Hospital, Auckland, New Zealand. Dr Srinivasan is currently with Mount Sinai Hospital, New York, NY. Dr Tatpati is currently with Kansas University School of Medicine, Wichita. Dr Chow is currently with University of Minnesota, Minneapolis.
Grant Support: This work was supported by National Institutes of Health grants RO1-DK41973-A23 (K.S.N) and KL2-RR024151 (B.A.I.), David Murdock-Dole Professorship of Nutrition, and Mayo Clinic Center for Translational Science Activities grant UL1-RR24150.
References
- 1.Ervin R.B. Prevalence of metabolic syndrome among adults 20 years of age and over, by sex, age, race and ethnicity, and body mass index: United States, 2003-2006. Natl Health Stat Report. 2009;(13):1–7. [PubMed] [Google Scholar]
- 2.Mottillo S., Filion K.B., Genest J. The metabolic syndrome and cardiovascular risk: a systematic review and meta-analysis. J Am Coll Cardiol. 2010;56(14):1113–1132. doi: 10.1016/j.jacc.2010.05.034. [DOI] [PubMed] [Google Scholar]
- 3.Executive Summary of the Third Report of The National Cholesterol Education Program (NCEP) Expert Panel on Detection, Evaluation, and Treatment of High Blood Cholesterol in Adults (Adult Treatment Panel III) JAMA. 2001;285(19):2486–2497. doi: 10.1001/jama.285.19.2486. [DOI] [PubMed] [Google Scholar]
- 4.Grundy S.M., Brewer H.B., Jr, Cleeman J.I., Smith S.C., Jr, Lenfant C. Definition of metabolic syndrome: report of the National Heart, Lung, and Blood Institute/American Heart Association conference on scientific issues related to definition. Circulation. 2004;109(3):433–438. doi: 10.1161/01.CIR.0000111245.75752.C6. [DOI] [PubMed] [Google Scholar]
- 5.Cushman W.C., Evans G.W., Byington R.P. Effects of intensive blood-pressure control in type 2 diabetes mellitus. N Engl J Med. 2010;362(17):1575–1585. doi: 10.1056/NEJMoa1001286. [DOI] [PMC free article] [PubMed] [Google Scholar]
- 6.Gerstein H.C., Miller M.E., Byington R.P. Effects of intensive glucose lowering in type 2 diabetes. N Engl J Med. 2008;358(24):2545–2559. doi: 10.1056/NEJMoa0802743. [DOI] [PMC free article] [PubMed] [Google Scholar]
- 7.Patel A., MacMahon S., Chalmers J. Intensive blood glucose control and vascular outcomes in patients with type 2 diabetes. N Engl J Med. 2008;358(24):2560–2572. doi: 10.1056/NEJMoa0802987. [DOI] [PubMed] [Google Scholar]
- 8.Third Report of the National Cholesterol Education Program (NCEP) Expert Panel on Detection, Evaluation, and Treatment of High Blood Cholesterol in Adults (Adult Treatment Panel III) final report. Circulation. 2002;106(25):3143–3421. [PubMed] [Google Scholar]
- 9.Dunn E.J., Grant P.J. Type 2 diabetes: an atherothrombotic syndrome. Curr Mol Med. 2005;5(3):323–332. doi: 10.2174/1566524053766059. [DOI] [PubMed] [Google Scholar]
- 10.Juhan-Vague I., Roul C., Alessi M.C., Ardissone J.P., Heim M., Vague P. Increased plasminogen activator inhibitor activity in non insulin dependent diabetic patients—relationship with plasma insulin. Thromb Haemost. 1989;61(3):370–373. [PubMed] [Google Scholar]
- 11.Meigs J.B., Mittleman M.A., Nathan D.M. Hyperinsulinemia, hyperglycemia, and impaired hemostasis: the Framingham Offspring Study. JAMA. 2000;283(2):221–228. doi: 10.1001/jama.283.2.221. [DOI] [PubMed] [Google Scholar]
- 12.Erem C., Hacihasanoglu A., Celik S. Coagulation and fibrinolysis parameters in type 2 diabetic patients with and without diabetic vascular complications. Med Princ Pract. 2005;14(1):22–30. doi: 10.1159/000081919. [DOI] [PubMed] [Google Scholar]
- 13.Kwiterovich P.O., Jr The antiatherogenic role of high-density lipoprotein cholesterol. Am J Cardiol. 1998;82(9A):13Q–21Q. doi: 10.1016/s0002-9149(98)00808-x. [DOI] [PubMed] [Google Scholar]
- 14.Ginsberg H.N. Diabetic dyslipidemia: basic mechanisms underlying the common hypertriglyceridemia and low HDL cholesterol levels. Diabetes. 1996;45(suppl 3):S27–S30. doi: 10.2337/diab.45.3.s27. [DOI] [PubMed] [Google Scholar]
- 15.Hevener A.L., Febbraio M.A. The 2009 stock conference report: inflammation, obesity and metabolic disease. Obes Rev. 2010;11(9):635–644. doi: 10.1111/j.1467-789X.2009.00691.x. [DOI] [PubMed] [Google Scholar]
- 16.Thorand B., Zierer A., Baumert J., Meisinger C., Herder C., Koenig W. Associations between leptin and the leptin/adiponectin ratio and incident type 2 diabetes in middle-aged men and women: results from the MONICA/KORA Augsburg Study 1984-2002. Diabet Med. 2010;27(9):1004–1011. doi: 10.1111/j.1464-5491.2010.03043.x. [DOI] [PubMed] [Google Scholar]
- 17.Walsh K. Adipokines, myokines and cardiovascular disease. Circ J. 2009;73(1):13–18. doi: 10.1253/circj.cj-08-0961. [DOI] [PubMed] [Google Scholar]
- 18.Holman R.R., Paul S.K., Bethel M.A., Matthews D.R., Neil H.A. 10-Year follow-up of intensive glucose control in type 2 diabetes. N Engl J Med. 2008;359(15):1577–1589. doi: 10.1056/NEJMoa0806470. [DOI] [PubMed] [Google Scholar]
- 19.Kao J., Tobis J., McClelland R.L. Relation of metformin treatment to clinical events in diabetic patients undergoing percutaneous intervention. Am J Cardiol. 2004;93(11):1347–1350. doi: 10.1016/j.amjcard.2004.02.028. A1345. [DOI] [PubMed] [Google Scholar]
- 20.Tzoulaki I., Molokhia M., Curcin V. Risk of cardiovascular disease and all cause mortality among patients with type 2 diabetes prescribed oral antidiabetes drugs: retrospective cohort study using UK general practice research database. BMJ. 2009;339:b4731. doi: 10.1136/bmj.b4731. [DOI] [PMC free article] [PubMed] [Google Scholar]
- 21.Mannucci E., Monami M., Lamanna C., Gensini G.F., Marchionni N. Pioglitazone and cardiovascular risk: a comprehensive meta-analysis of randomized clinical trials. Diabetes Obes Metab. 2008;10(12):1221–1238. doi: 10.1111/j.1463-1326.2008.00892.x. [DOI] [PubMed] [Google Scholar]
- 22.Wilcox R., Bousser M.G., Betteridge D.J. Effects of pioglitazone in patients with type 2 diabetes with or without previous stroke: results from PROactive (PROspective pioglitAzone Clinical Trial In macroVascular Events 04) Stroke. 2007;38(3):865–873. doi: 10.1161/01.STR.0000257974.06317.49. [DOI] [PubMed] [Google Scholar]
- 23.Erdmann E., Dormandy J.A., Charbonnel B., Massi-Benedetti M., Moules I.K., Skene A.M. The effect of pioglitazone on recurrent myocardial infarction in 2,445 patients with type 2 diabetes and previous myocardial infarction: results from the PROactive (PROactive 05) Study. J Am Coll Cardiol. 2007;49(17):1772–1780. doi: 10.1016/j.jacc.2006.12.048. [DOI] [PubMed] [Google Scholar]
- 24.Dormandy J.A., Charbonnel B., Eckland D.J. Secondary prevention of macrovascular events in patients with type 2 diabetes in the PROactive Study (PROspective pioglitAzone Clinical Trial In macroVascular Events): a randomised controlled trial. Lancet. 2005;366(9493):1279–1289. doi: 10.1016/S0140-6736(05)67528-9. [DOI] [PubMed] [Google Scholar]
- 25.Frye R.L., August P., Brooks M.M. A randomized trial of therapies for type 2 diabetes and coronary artery disease. N Engl J Med. 2009;360(24):2503–2515. doi: 10.1056/NEJMoa0805796. [DOI] [PMC free article] [PubMed] [Google Scholar]
- 26.Nair K.S., Bigelow M.L., Asmann Y.W. Asian Indians have enhanced skeletal muscle mitochondrial capacity to produce ATP in association with severe insulin resistance. Diabetes. 2008;57(5):1166–1175. doi: 10.2337/db07-1556. [DOI] [PMC free article] [PubMed] [Google Scholar]
- 27.Ramachandran A., Snehalatha C., Mary S., Mukesh B., Bhaskar A.D., Vijay V. The Indian Diabetes Prevention Programme shows that lifestyle modification and metformin prevent type 2 diabetes in Asian Indian subjects with impaired glucose tolerance (IDPP-1) Diabetologia. 2006;49(2):289–297. doi: 10.1007/s00125-005-0097-z. [DOI] [PubMed] [Google Scholar]
- 28.Hochberg Y. A sharper Bonferroni procedure for multiple tests of significance. Biometrika. 1988;75(4):800–802. [Google Scholar]
- 29.Ferrannini E., Natali A., Bell P., Cavallo-Perin P., Lalic N., Mingrone G., European Group for the Study of Insulin Resistance (EGIR) Insulin resistance and hypersecretion in obesity. J Clin Invest. 1997;100(5):1166–1173. doi: 10.1172/JCI119628. [DOI] [PMC free article] [PubMed] [Google Scholar]
- 30.Kasapis C., Thompson P.D. The effects of physical activity on serum C-reactive protein and inflammatory markers: a systematic review. J Am Coll Cardiol. 2005;45(10):1563–1569. doi: 10.1016/j.jacc.2004.12.077. [DOI] [PubMed] [Google Scholar]
- 31.Gielen S., Adams V., Mobius-Winkler S. Anti-inflammatory effects of exercise training in the skeletal muscle of patients with chronic heart failure. J Am Coll Cardiol. 2003;42(5):861–868. doi: 10.1016/s0735-1097(03)00848-9. [DOI] [PubMed] [Google Scholar]
- 32.Xydakis A.M., Case C.C., Jones P.H. Adiponectin, inflammation, and the expression of the metabolic syndrome in obese individuals: the impact of rapid weight loss through caloric restriction. J Clin Endocrinol Metab. 2004;89(6):2697–2703. doi: 10.1210/jc.2003-031826. [DOI] [PubMed] [Google Scholar]
- 33.Ridker P.M., Danielson E., Fonseca F.A. Rosuvastatin to prevent vascular events in men and women with elevated C-reactive protein. N Engl J Med. 2008;359(21):2195–2207. doi: 10.1056/NEJMoa0807646. [DOI] [PubMed] [Google Scholar]
- 34.Wolk R., Berger P., Lennon R.J., Brilakis E.S., Davison D.E., Somers V.K. Association between plasma adiponectin levels and unstable coronary syndromes. Eur Heart J. 2007;28(3):292–298. doi: 10.1093/eurheartj/ehl361. [DOI] [PubMed] [Google Scholar]
- 35.Sobel B.E., Hardison R.M., Genuth S. Profibrinolytic, antithrombotic, and antiinflammatory effects of an insulin-sensitizing strategy in patients in the Bypass Angioplasty Revascularization Investigation 2 Diabetes (BARI 2D) trial. Circulation. 2011;124(6):695–703. doi: 10.1161/CIRCULATIONAHA.110.014860. [DOI] [PMC free article] [PubMed] [Google Scholar]
- 36.Betteridge D.J. CHICAGO, PERISCOPE and PROactive: CV risk modification in diabetes with pioglitazone. Fundam Clin Pharmacol. 2009;23(6):675–679. doi: 10.1111/j.1472-8206.2009.00741.x. [DOI] [PubMed] [Google Scholar]
- 37.Ghaffar A., Reddy K.S., Singhi M. Burden of non-communicable diseases in South Asia. BMJ. 2004;328(7443):807–810. doi: 10.1136/bmj.328.7443.807. [DOI] [PMC free article] [PubMed] [Google Scholar]
- 38.Yusuf S., Reddy S., Ounpuu S., Anand S. Global burden of cardiovascular diseases, Part II: variations in cardiovascular disease by specific ethnic groups and geographic regions and prevention strategies. Circulation. 2001;104(23):2855–2864. doi: 10.1161/hc4701.099488. [DOI] [PubMed] [Google Scholar]
- 39.Hughes K., Aw T.C., Kuperan P., Choo M. Central obesity, insulin resistance, syndrome X, lipoprotein(a), and cardiovascular risk in Indians, Malays, and Chinese in Singapore. J Epidemiol Community Health. 1997;51(4):394–399. doi: 10.1136/jech.51.4.394. [DOI] [PMC free article] [PubMed] [Google Scholar]
- 40.Matsushita K., Yatsuya H., Tamakoshi K. Comparison of circulating adiponectin and proinflammatory markers regarding their association with metabolic syndrome in Japanese men. Arterioscler Thromb Vasc Biol. 2006;26(4):871–876. doi: 10.1161/01.ATV.0000208363.85388.8f. [DOI] [PubMed] [Google Scholar]