

Abstract
The histone demethylase LSD1, a component of the CoREST (corepressor for element 1-silencing transcription factor) corepressor complex, plays an important role in the downregulation of gene expression during development. However, the activities of LSD1 in mediating short-time-scale gene expression changes have not been well understood. To reveal the mechanisms underlying these two distinct functions of LSD1, we performed genome-wide mapping and cellular localization studies of LSD1 and its dimethylated histone 3 lysine 4 (substrate H3K4me2) in mouse embryonic stem cells (ES cells). Our results showed an extensive overlap between the LSD1 and H3K4me2 genomic regions and a correlation between the genomic levels of LSD1/H3K4me2 and gene expression, including many highly expressed ES cell genes. LSD1 is recruited to the chromatin of cells in the G1/S/G2 phases and is displaced from the chromatin of M-phase cells, suggesting that LSD1 or H3K4me2 alternatively occupies LSD1 genomic regions during cell cycle progression. LSD1 knockdown by RNA interference or its displacement from the chromatin by antineoplastic agents caused an increase in the levels of a subset of LSD1 target genes. Taken together, these results suggest that cell cycle-dependent association and dissociation of LSD1 with chromatin mediates short-time-scale gene expression changes during embryonic stem cell cycle progression.
INTRODUCTION
Embryonic stem (ES) cells have two remarkable properties: self-renewal, the capability to proliferate indefinitely in an undifferentiated state, and pluripotency, the ability to differentiate into all cell types. Recent studies suggest that self-renewal and pluripotency are intimately linked to cell cycle regulation in ES cells (30, 68). ES cells show a high proliferation rate and a unique cell cycle structure, characterized by a shortened G1 phase (8, 61), and the induction of cell cycle arrest is sufficient to commit ES cells toward differentiation (46). A core regulatory circuitry involving a group of transcription factors, microRNAs, and chromatin-remodeling enzymes is associated with the control of self-renewal and pluripotency (36, 40, 67). This circuitry includes transcription factors, such as Oct4, Sox2, Nanog, Esrrb, Tbx3, and Tcf3, which form self-regulatory networks and regulate a wide range of downstream genes required for these processes (7, 10, 23, 26, 51). In addition to the transcription factors, a group of noncoding RNA genes and posttranslational modifications of histone proteins are thought to be important epigenetic events associated with transcriptional regulation in ES cells (35, 40). Despite extensive knowledge about the core transcriptional circuitry, little is known about the regulation of the ES cell transcriptional circuitry during cell cycle progression.
Cell cycle progression depends on a highly regulated series of events in which transcriptional control plays a major role. Complex transcriptional regulation during the cell cycle is orchestrated by several converging and reinforcing signals, including transcription factors, noncoding RNAs, DNA methylation, and histone modifications (6). Coactivators and corepressors have a major role in altering chromatin structure through the modification of core histone amino-terminal tails (28, 43, 53). Lysine-specific demethylase 1 (LSD1/KDM1a/Aof2/BHC110) is a component of various protein complexes that contain several transcriptional corepressors, including the RE1-silencing transcription factor (REST), corepressor CoREST (corepressor for element 1-silencing transcription factor), BHC80, HDAC1/2 (histone deacetylases 1 and 2), CtBP (C-terminal binding protein), BRAF35, NuRD (nucleosome remodelling and histone deacetylation), and RCOR2 (22, 31, 50, 60, 64, 66). LSD1 removes di- and monomethylation from histone 3 lysine 4 (H3K4) and H3K9 by using an amine oxidase reaction (37, 49). It participates in gene repression as part of the CoREST and NuRD corepressor complexes by mediating the demethylation of mono-/dimethylated H3K4 (H3K4me1/-me2), an active marker of transcription (50, 60, 62). Interaction of LSD1 with CoREST is required for the recognition and demethylation of nucleosomal substrates (31, 50). Structural studies have shown that LSD1 interacts with CoREST via an extended helical region termed the “Tower” domain and that the C-terminal SANT domain within CoREST facilitates the association with chromatin by interacting directly with DNA (11, 14, 63). LSD1 was recently shown to be recruited to the NuRD complex via interaction of the Tower domain with metastasis tumor antigen (MTA) in breast cancer cells (60). It has been demonstrated that LSD1 is also able to demethylate lysine residues at several nonhistone substrates, such as p53 (20), Dnmt1 [DNA (cytosine-5)-methyltransferase 1] (58), and E2f1 (27). Recent reports describe contradictory roles for LSD1 in mouse ES cells (1, 16, 58, 59, 62, 64). Genetic ablation of LSD1 causes early embryonic lethality at approximately embryonic day 6.5, characterized by impaired differentiation properties, apoptosis, and failure in maintaining global DNA methylation (58, 59). Moreover, Foster et al. demonstrated that LSD1 knockout mouse ES cell lines show precocious expression of developmental genes (16). These findings suggest that activities of LSD1-containing complexes therefore have the potential to regulate both short- and long-time-scale gene expression changes during early development. However, little is known about the mechanisms by which LSD1 mediates short-time-scale gene expression changes required for the maintenance of ES cell self-renewal.
Here, we show that during cell cycle progression, LSD1 is recruited to the chromatin of cells at G1/S/G2 phases and excluded from the chromatin of cells at M phase, suggesting that LSD1 genomic regions are alternatively occupied by LSD1 or its substrate in a cell cycle-dependent manner. Both the depletion of LSD1 by RNA interference and its displacement from the chromatin by antineoplastic agents increased a subset of LSD1 target genes, including Oct4 and Sox2. We propose a model where LSD1, possibly through the association and dissociation with chromatin, is required for coordinating the dynamic H3K4 methylation changes at the promoter regions and, thus, contributes to short-time-scale transcriptional changes required for the self-renewal of ES cells.
MATERIALS AND METHODS
ES cell culture.
R1 ES cells (38) were maintained and propagated as described previously (39). ES cells growing on gelatin-coated tissue culture plates in the presence of 1,500 U/ml leukemia inhibitory factor (LIF; Chemicon, Temecula, CA) in ES cell medium consisting of Dulbecco's minimal essential medium (DMEM) supplemented with 15% fetal calf serum (FCS), 1 mM sodium pyruvate, 0.1 mM minimal essential medium (MEM) nonessential amino acids, 0.1 mM 2-mercaptoethanol, 2 mM l-glutamine, and antibiotics (all from Invitrogen, Carlsbad, CA) were used in all experiments.
ChIP.
Chromatin immunoprecipitation (ChIP) assays were performed by using an EZ-ChIP kit from Upstate Biotechnology (Millipore) according to the manufacturer's instructions. Briefly, 5 × 10⁷ cells were trypsinized, fixed with 1% formaldehyde, resuspended in lysis buffer, and fragmented with a Bioruptor UCD-200 (Diagenode, Inc.) ultrasonic cell disrupter to a size range of 200 to 1,000 bases. Solubilized chromatin was diluted 10-fold in ChIP dilution buffer and, after removal of a control aliquot, incubated with antibody against dimethyl histone H3 lysine 4 (CST 9726), LSD1 (Abcam 17721), Oct4 (SCB sc-8628), or CoREST (Millipore 07-455) overnight at 4°C. Control IgG was used as a negative control in all ChIP experiments. To purify the DNA, the immune complexes and the input DNA were concurrently treated for cross-link reversal. Solexa/Illumina sequencing and quantitative PCR were used to analyze the purified DNA.
ChIP-seq and data analysis.
Immunoprecipitated DNA was purified, and the libraries were prepared according to Illumina's instructions accompanying the massively parallel DNA sequencing (ChIP-seq) sample preparation kit (part number IP-102-1001). Approximately 200-bp DNA fragments were purified from the amplified library from an agarose gel. DNA was captured on an Illumina flow cell for cluster generation. Libraries were then subjected to sequencing in an Illumina genome analyzer II to generate 36-bp reads. The output of the Solexa Analysis Pipeline was converted to browser extensible data (BED) files detailing the genomic coordinates of each read. Sequence reads were aligned to the mouse reference genome NCBI Build 37 (mm9) using ELAND software. We used a previously published method, MACS algorithm (69), for the data analysis. Binding intervals were identified by using a fold change of the total tag count of the ChIP library to the input library of at least 16 times and a P value threshold of 10−10.
We further characterized the LSD1 and H3K4me2 binding intervals based on their locations relative to the transcript start site (TSS) and the transcription end site (TES) coordinates of known genes annotated using RefSeq (44). The mouse genome coordinate information was downloaded from the UCSC Genome Browser Mouse 2007 (mm9) assembly (NCBI build 37) (24). The gene body was defined from TSS−10k (10 kbp upstream of the TSS) to TES+10k (10 kbp downstream of the TES). A gene is linked to an interval if the middle point falls within the gene body. Note that one gene can be linked with more than one interval and vice versa. We segregated LSD1 and H3K4me2 binding sites into promoter, intragenic, and distal based on their locations with respect to their position on the gene. The promoter region was defined as from 2 kb upstream to 1 kb downstream of the TSS. The region between TSS and TES that is not the promoter region was defined as intragenic. The gene body that is not promoter or intragenic was defined as distal.
To determine the occupancy profile of LSD1 and H3K4me2 binding for the gene and the promoter region for all genes, uniquely aligned 36-bp sequences were extended to 110 bp in the 3′ direction and allocated into 20-bp bins. We averaged the number of extended reads for all RefSeq genes for the same position relative to the TSS and then divided by the number of reads in a particular library and presented the results as normalized tag counts.
Determination of distance and statistical significance between the intervals.
To determine the relative distance between LSD1 and H3K4me2 intervals, the distance (d) was defined as −(r − 1), if there was an overlap, where r was the number of nucleotides in the overlapping interval. If there was no overlap, the distance d was defined as s + 1, where s was the number of nucleotides in the gap interval. We also determined the minimum distance d between an LSD1 interval and all intervals for H3K4me2. The cumulative probability at distance d = d0 (d0 varies from −1,000 to 106) was defined as the proportion of LSD1 intervals that can find an interval in H3K4me2 library with distance no greater than d0. The P value of a binding interval for LSD1 was defined as shown below. For a longer LSD1 interval, we expect to see a shorter distance with an interval in the H3K4me2 library. Let len(q) be the length of an interval q, defined as the number of possible locations minus 1, and dist(q,S) be the minimal distance between the interval q and all H3K4me2 intervals. The P value for an interval qi in LSD1 with length l and distance d was defined as Pi = Pr{dist(q,S) ≤ d|len(q) = l} = Pr{dist(q,S) ≤ d and len(q) = l}/Pr{len(q) = l} = #{k: dist([k,k + l],S) ≤ d}/#{k: [k,k + l] belongs to the chromosome}, where q is an interval that is uniformly distributed at random along the whole chromosome and k is a possible location such that [k,k + l] is an interval on the same chromosome with length l beginning at location k. Pr is defined as the probability, # is the number of a set, and [k,k + l] is the closed interval starting at k and ending at k + l. Please note that these P values were not corrected for the multiple testing, as there were 5,106 LSD1 binding intervals. We do not use the P values to identify which LSD1 binding intervals were close to an interval in the H3K4me2 library, but we use the distribution of the P values for all LSD1 binding intervals to describe the global behavior.
Motif analysis.
Motif scanning was done using the program Weeder (42). Three separate scans were performed: sequences of entire LSD1 peak regions, sequences of LSD1 peak regions that overlapped with 2,000 bases upstream from the TSS of a gene, and sequences of LSD1 peak regions that overlapped with the 5′ untranslated region (5′UTR). Ensemble annotations were used to determine TSS and 5′UTR locations. Both strands of the sequences were searched, but otherwise default Weeder parameters were used. For whole genomic regions and upstream regions, the “mm9” mouse background frequency file (supplied with the software) was used. For 5′UTRs, in order to properly account for the increased CpG content, custom frequency files were constructed using all annotated 5′UTR regions.
Correlation of ChIP-seq data with gene expression.
The gene expression data for R1 ES cells with accession numbers GDS2666 and GDS26667 were downloaded from the GEO database. The NetAffx annotation files for the mouse expression set 430 (MOE430A and MOE430B) were downloaded from the Affymetrix website and used to map the Affy probe set to possible RefSeq genes. Since some genes have more than one TSS, we further mapped the RefSeq genes to all possible TSS. If a probe set was mapped to more than one TSS, then this probe set was discarded for further analysis. When multiple probe sets were mapped to a specific TSS on a DNA strand, the gene expression values were averaged. After analysis, we obtained the expression data for 14,548 genes for R1 ES cells. We sorted the genes according to their average expression levels in ES cells and divided the 14,548 genes into three groups of equal size. We normalized the occupancy profiles for LSD1 and H3K4me2 in the promoter region for each gene by dividing by the maximum occupancy for the LSD1 library and the H3K4me2 library, respectively.
Gene ontology analysis.
The gene ontology was calculated online at DAVID Bioinformatics Resources (http://david.abcc.ncifcrf.gov) as described previously (21).
Gene expression and ChIP analysis.
Quantitative real-time PCR (qPCR) was carried out to measure gene expression as described in our previous publication (39). Briefly, RNA was isolated using an Absolutely RNA preparation kit (Agilent Technologies), reverse transcribed, and quantified by qPCR using SYBR green in an ABI Prism 7900HT. Relative fold enrichments were determined by the 2−ΔΔCT (cycle threshold) method (39). Primer sequences are listed in Table 1.
Table 1.
RT-qPCR primer sequences
| Gene product | Accession no. | Primer |
|
|---|---|---|---|
| Sense | Antisense | ||
| Pou5f1 | NM_013633 | CCCACTTCACCACACTCTACT | GCTCCAGGTTCTCTTGTCTA |
| Sox-2 | NM_011443 | CCGTGATGCCGACTAGAAAAC | AGCGCCTAACGTACCACTAG |
| c-Myc | NM_010849 | TTGAGGAAACGACGAGAACAG | GGTTGTGAGGTTAGGCTTTGAG |
| Nanog | NM_028016 | CCACCAGGTGAAATATGAGAC | GGCTCACAACCATACGTAACA |
| Tbx3 | NM_198052 | TGGCTCAGTGTCCTTGTCAC | ACTGGAATGGAGAGACCTTGG |
| Cyclin B1 | NM_172301 | ACAGGGTCGTGAAGTGACTG | CATCTTCTTGGGCACACAAC |
| Cyclin E1 | NM_007633 | AACCTACAACACCCGAGCAG | AACACCACTGAGTGCTCCAG |
| α-Tubulin | NM_011653 | CTGGAGCAGTTTGACGACAC | TGCCTTTGTGCACTGGTATG |
| Rps11 | NM_013725 | GCACATTGAATCGCACAGTC | CGTGACGAAGATGAAGATGC |
| β-Actin | NM_007393 | CTGCGCAAGTTAGGTTTTGTCAAAG | GCTGCCTCAACACCTCAAC |
| Cebpb | NM_007678 | GAAGTCGGTGGACAAGAACAG | GGTCATTGTCACTGGTCAACTC |
| Fiz1 | NM_001110328 | CTGGAGTGTGGCAAGTTCTTC | GGGTGTCCTGGTTATTCAGTC |
| Atp1b1 | NM_009721 | CCCTAAGTATTGCCGCCTTG | TGCCAGTTTTATTCCCGTTG |
| Mex3d | NM_198615 | TGTGTGGTGTGTTCTGAAGG | GGACATTCTGGTTCACTCTTCC |
| Repin1 | NM_001079901 | CTTGATGCACCAGAAGAAGC | TGTTCCTCTAGCAGCATCAGTG |
| Ybx2 | NM_016875 | CAACAGGAATGACACCAAGG | GACATCAAACTCCACAGTCTCC |
| Serbf1 | NM_011480 | CTGTTGGCATCCTGCTATCTG | TTTGGGGTCTAGCTGGAAGTG |
| Exosc7 | NM_001081188 | AGATGATGGAGAGCAGCAAG | GAGAGAAATCACCCCAGGAAC |
| Lsd1 | NM_133872 | CACAGCAGTCCCCAAGTATGT | GCCTCTGCTGTCAAACTAGGA |
| Clcln1 | NM_013491 | GATGAGGAAGATGAGGACGAG | CAGTGGTGGTAGGAAGAAGATG |
| Ldb1 | MMU70375 | ATTCCACAGCAACTTCGTGTC | CTTTATCCGCATCATGTCGTC |
| Jarid1b | NM_152895 | CCGCAGAAGTGTGTTTGCTCT | TGGCTTAAAGGACTGGCTCT |
To quantify the DNA in ChIP assays, qPCR was performed on nonamplified LSD1, H3K4me2, Oct4, CoREST, and rabbit IgG ChIP DNA using SYBR green master mix reagents. Relative levels of occupancy or fold enrichments were calculated by determining the immunoprecipitation efficiency (ratio of the amount of immunoprecipitated DNA to that of the input sample) normalized to the level observed at a control region (intergenic), which was defined as 1.0. All ChIP experiments were repeated three times. The primers used for real-time PCR to quantitate the ChIP-enriched DNA are as follows: Oct4 −2098/−1928 (positions relative to TSS), GGAACTGGGTGTGGGGAGGTTGTA and GCAGATTAAGGAAGGGCTAGGACGAGAG; Oct4 −553/−381, TCTCTGGGGACATATCTGGTTG and CCACTCCTCAGTTCTTGCTTAC; Oct4 +1274/+1478, GGATTGGGGAGGGAGAGGTGAAACCGT and TGGAAGCTTAGCCAGGTTCGAGGATCCAC; Sox2 −582/−347, AGGCTTGGGTCTAACTTCTCG and AGAGCTCCATGGCAGGTAGA; Nanog −753/−378, AAACCAAAGCATGGACCAAC and GACCTTGCTGCCAAAGTCTC; and Nanog +537/+785, TAGTCTGAAATAGAGATCCGGGAC and AGGTTGAGAGAAATGC-TAACTGCT. Primers AAGGGGCCTCTGCTTAAAAA and AGAGCTCCATGGCAGGTAGA, overlapping an intergenic region in chromosome 19, were used as a control.
ddPCR analysis.
To confirm the effects of knocking down endogenous LSD1, R1 ES cells were transfected with control small interfering RNA (siRNA [siControl]) (Accell nontargeting pool number D-001910-10; Dharmacon) or siRNA against LSD1 (siLSD1; 30 nM) (Accell smart pool number E-065198-00; Dharmacon) using Lipofectamine 2000 (Invitrogen). After 48 h, total RNA was prepared using an Absolutely RNA preparation kit (Stratagene). The RNA samples (1 μg) were reverse transcribed using the Superscript III first-strand synthesis system (Invitrogen), and the resulting cDNAs were used for droplet digital PCR (ddPCR). Endogenous mRNA levels were measured by ddPCR using the QuantaLife droplet digital PCR system according to the manufacturer's instructions. Briefly, the 20-μl ddPCR mixture was prepared by combining the reverse transcription (RT) product, primers, and probes with QuantaLife master mix. Approximately 10,000 to 14,000 monodispersed droplets for each sample were prepared using the QuantaLife droplet generator. The droplets were transferred to a 96-well PCR plate and amplified to endpoint using the following conditions: 95°C for 10 min, 40 cycles of 94°C for 30 s, 60°C for 1 min, and 98°C for 10 min in a standard thermal cycler (PTC100; MJ Research). Plates were read in a QuantaLife droplet reader, and the concentrations (copy numbers) of the targets in the samples were determined using QuantaSoft software. The ddPCR primers used were as follows: for LSD1, 5′-CACAGCAGTCCCCAAGTATGT-3′ (forward), 5′-GCCTCTGCTGTCAAACTAGGA-3′ (reverse), and (6-FAM)ACGGCATGTCATCTGCCACG(BHQ1a) (probe) (FAM, 6-carboxyfluorescein, and BHQ1a, black hole quencher 1a); for Oct4, 5′-CCCACTTCACCACACTCTACT-3′ (forward), 5′-GCTCCAGGTTCTCTTGTCTA-3′ (reverse), and (6-FAM)CTCTGGGCTCTCCCATGCA(BHQ1a) (probe); for Nanog, 5′-CCACCAGGTGAAATATGAGAC-3′ (forward), 5′-GGCTCACAACCATACGTAACA-3′ (reverse), and (6-FAM)GTCAGGGCAAAGCCAGGTTCC(BHQ1a) (probe); for c-Myc, 5′-TTGAGGAAACGACGAGAACAG-3′ (forward), 5′-GGTTGTGAGGTTAGGCTTTGAG-3′ (reverse), and (6-FAM)ACCTAACTCGAGGAGGAGCTGGA(BHQ1a) (probe); for Tbx3, 5′-TGGCTCAGTGTCCTTGTCAC-3′ (forward), 5′-ACTGGAATGGAGAGACCTTGG-3′ (reverse), and (6-FAM)GCTACCAGCGAACTGCAGAGT(BHQ1a) (probe); for Jarid1b, 5′-CCGCAGAAGTGTGTTTGCTCT-3′ (forward), 5′-TGGCTTAAAGGACTGGCTCT-3′ (reverse), and (6-FAM)CTGTGCCTTCATGCCCCACT(BHQ1a) (probe); and for β-actin, 5′-AGGTGACAGCATTGCTTCTG-3′ (forward), 5′-GCTGCCTCAACACCTCAAC-3′ (reverse), and (6-FAM)CTGAATGGCCCAGGTCTGAGG(BHQ1a) (probe). The efficiency of the primer-template combination for each gene used in the study was assessed using serial dilutions of a cDNA template to create a standard curve of the change in copy number with each dilution. We used the slope of the linear regression (R2) to determine the efficiency of amplification, which is 1 if a dilution of 1:2 results in a copy number difference of 0.5.
Western immunoblotting.
Total cell extracts from R1 ES cells treated with nocodazole (100 ng/ml for 16 h) and from LSD1 siRNA-transfected cells were prepared as described in our previous publication (39) and quantified using a Bio-Rad protein assay (Bio-Rad). Acid extraction of histones was performed as previously described (48). Western immunoblotting, stripping, reprobing, and quantification of the blots were performed as described in our previous publication (39). Antibodies to the following proteins were used: LSD1 (CST 2139), Jarid1b (A301-813A; Bethyl), Nanog (560259; BD Bioscience), Oct4 (SCB sc-8628), GAPDH (glyceraldehyde-3-phosphate dehydrogenase) (SCB sc-166545), CoREST (07-455; Millipore), FLAG (F7425; Sigma), H3K4me2 (CST 9726), H3K4me3 (CST 9727), H3K9me2 (CST 9753), and histone H3 (CST 9715). Horseradish peroxidase-conjugated anti-rabbit and anti-mouse antibodies from Santa Cruz Biotechnology were used in all experiments.
Immunocytochemistry.
Cells grown on gelatin-coated cover glasses were permeabilized and incubated with primary antibodies at 4°C overnight as described previously (39). The primary antibodies used were a rabbit polyclonal anti-LSD1 antibody (dilution of 1:400) and a rabbit polyclonal antibody that recognizes H3K4me2 (dilution of 1:500). After washing with PBST (phosphate-buffered saline with 0.1% Tween 20), the cells were incubated at room temperature for 2 h with Alexa Fluor 488-conjugated donkey anti-rabbit IgG or Alexa Fluor 568-conjugated goat anti-rabbit IgG (dilution of 1:400; Molecular Probes). The cells were washed with PBST, and the nuclei were stained with 0.5 μg/ml (in PBS) of the fluorescent DNA dye 4,6-diamidino-2-phenylindole dihydrochloride (DAPI) and mounted in Vectashield (Vector Laboratories) mounting medium. The images were acquired with an Olympus BX65 fluorescence microscope.
Luciferase reporter assays.
To generate pBIND-LSD1 and pBIND-PGC1α constructs, full-length LSD1 and PGC1α (peroxisome proliferator-activated receptor gamma [PPAR-γ] coactivator 1α) cDNAs were amplified by using a HotStar HiFidelity polymerase kit (Qiagen). We added SalI and XbaI restriction sites at the 5′ and 3′ ends of the cDNAs, respectively. The gel-purified DNA fragments were cloned into the TOPO TA cloning vector (pCR vector; Invitrogen). The full-length LSD1 or PGC1α cDNA insert was excised by SalI/XbaI digestion and cloned into the pBIND vector (Promega). To generate C-terminal deletion constructs of pBIND-LSD1Δ (amino acids 1 to 719) and pBIND-PGC1αΔ (amino acids 1 to 405), full-length LSD1 and PGC1α cDNAs were digested with BamHI and XbaI, respectively, and cloned into the pBIND vector. The nucleotide sequences of all the constructs were confirmed by DNA sequencing. R1 ES cells growing on gelatinized 24-well plates were transfected with a mixture of 0.5 μg of a pG5-luciferase reporter (pG5luc) plasmid (Promega) and pBIND constructs as indicated below, using Lipofectamine 2000 according to the manufacturer's instructions (Invitrogen). Cells were lysed 24 to 48 h later and processed for luciferase assay using the Dual-Luciferase reporter assay system. Firefly luciferase and Renilla luciferase activities were measured using a Mithras LB 940 luminometer (Berthold Technologies). The luciferase activities of the pG5luc reporter were normalized based on the Renilla luciferase activity of the pBIND construct. At a minimum, transfections were done in triplicate and on three independent occasions.
Cell cycle synchronization.
To synchronize cells at metaphase, ES cells were first grown to about 60% confluence in complete ES cell medium. Prior to the addition of 100 ng/ml nocodazole or vincristine, the medium was replaced with serum-free medium and the cells incubated for 16 to 18 h. Synchronization and cell cycle state were examined by flow cytometry and imaging flow cytometry.
Flow cytometry and imaging flow cytometry.
For cell cycle analysis by flow cytometry, cells were stained with 50 μM Hoechst 33342 (Sigma) for 15 min and analyzed in an LSRII (BD Biosciences) loaded with FACSDiva software. For imaging flow cytometry, ES cell cultures were incubated with DNA dye DRAQ5 (1 μg/ml; Biostatus) for 5 min at 37°C. The cells were fixed for 20 min in 4% paraformaldehyde-PBS, washed in PBS, and trypsinized. A total of 10,000 cells were imaged using an Amnis ImageStream multispectral imaging flow cytometer system (model IS100; Amnis, Seattle, WA). Following data acquisition, approximately 5,000 cells were gated and analyzed for mitotic nuclear morphology using analysis features available in IDEAS (Image Data Exploration and Analysis Software; Amnis Corporation).
Cell proliferation assay.
For cell proliferation analysis, cells were plated at a density of 1 × 10⁴ cells/well on 96-microwell cell culture plates (in 100 μl of medium). The next day, cells were transfected with siLSD1 or siControl and grown for 5 days. The medium was changed daily, and the cell proliferation was determined using CellTiter-Blue reagent (Promega, Madison, WI). The fluorescence was quantified using a spectrofluorometer (SPECTRAmax Gemini XS; Molecular Devices) by measuring the fluorescence at excitation/emission wavelengths of 555/585 nm. Data are expressed as percentages of the results for the vehicle-treated controls, and values represent the means ± standard errors of the means from eight microwells from each of two independent experiments (n = 16).
Statistical analysis.
The data were analyzed using the GraphPad Prism data analysis program (GraphPad Software, San Diego, CA). For the comparison of statistical significance between two groups, Student's t tests for paired and unpaired data were used. For multiple comparisons, one-way analysis of variance (ANOVA) followed by post hoc comparison of the group means according to the method of Tukey were used.
ChIP-seq data accession number.
ChIP-seq datasets have been deposited in the GEO database with accession number GSE18515.
RESULTS
Whole-genome mapping demonstrates that LSD1 genomic regions overlap H3K4me2 regions.
To define the LSD1 transcriptional repressive network in ES cells, we mapped the genomic sites of LSD1 and H3K4me2, the substrate of LSD1. Chromatin immunoprecipitation coupled to massively parallel sequencing (ChIP-seq) was performed using the ES cells growing under self-renewal conditions. Using specific antibodies, we immunoprecipitated LSD1- and H3K4me2-associated genomic DNA, and the resulting DNA was sequenced on a Solexa Genome Analyzer platform (ChIP-seq). After data filtering, we obtained an average of 5 million high-quality unique tags, consisting of 36 bases in each fragment (Table 2). Putative genomic regions were identified where the total tag count in the ChIP library (LSD1 or H3K4me2) was significantly greater than the input library. We used the MACS algorithm (69) to detect the enriched intervals. Totals of 5,106 LSD1 and 32,256 H3K4me2 peaks were identified (Table 3). In order to match these peaks to genes, we first examined the LSD1 and H3K4me2 peak distribution over all of the well-annotated RefSeq genes (44). The LSD1 and H3K4me2 peaks were mapped to 4,890 and 13,273 UCSC known genes, respectively (Table 4).
Table 2.
Summary of the total numbers of 36-bp-long tags obtained by Illumina/Solexa sequencing
| ChIP sample | Total no. of tags | No. of tags that passed Q filter without QC flag |
|||
|---|---|---|---|---|---|
| Total | Tags that mapped to a single location (distinct locations mapped by tags)a | Tags that mapped to more than one location | Tags that did not map | ||
| Inputb | 9,083,970 | 6,211,915 | 4,200,996 (3,801,082) | 1,656,633 | 354,286 |
| IgGc | 11,390,022 | 8,005,692 | 5,021,532 (4,755,619) | 1,489,370 | 1,494,790 |
| LSD1 | 13,211,210 | 8,722,807 | 6,012,048 (5,833,862) | 1,664,914 | 1,045,845 |
| H3K4me2 | 12,993,878 | 8,670,421 | 6,614,294 (6,416,657) | 1,459,424 | 596,703 |
Tags were mapped to the mm9 genome. The numbers of distinct mm9 genome locations that were mapped by the tags are shown in parentheses.
Genomic DNA used for the chromatin immunoprecipitation.
Chromatin immunoprecipitation was performed with control rabbit IgG.
Table 3.
Summary of the interval-based gene annotation for the binding intervals detected in IgG, LSD1, and H3K4me2 ChIP-seq libraries
| ChIP sample | No. of binding intervals |
||||||||||
|---|---|---|---|---|---|---|---|---|---|---|---|
| Total | Intergenic | Promoter | Intragenic |
Distal |
|||||||
| 5′UTR | 3′UTR | Intron | Exon | Total | 5′ | 3′ | Total | ||||
| IgG | 158 | 77 | 3 | 7 | 4 | 37 | 15 | 63 | 9 | 6 | 15 |
| LSD1 | 5,106 | 630 | 2,706 | 199 | 58 | 657 | 411 | 1,325 | 267 | 178 | 445 |
| H3K4me2 | 32,256 | 6,148 | 13,679 | 1,566 | 332 | 5,546 | 1,632 | 9,076 | 1,948 | 1,405 | 3,353 |
Table 4.
Summary of the gene-based annotation for the binding intervals detected in IgG, LSD1, and H3K4me2 ChIP-seq libraries
| ChIP sample | No. of genes to which tags mapped |
|||||||||
|---|---|---|---|---|---|---|---|---|---|---|
| Total | Promoter | Intragenic |
Distal |
|||||||
| 5′UTR | 3′UTR | Intron | Exon | Total | 5′ | 3′ | Total | |||
| IgG | 84 | 3 | 7 | 4 | 34 | 3 | 49 | 17 | 15 | 32 |
| LSD1 | 4,890 | 2,647 | 129 | 41 | 35 | 248 | 884 | 845 | 514 | 1,359 |
| H3K4me2 | 13,273 | 10,663 | 235 | 83 | 713 | 319 | 1,350 | 627 | 633 | 1,260 |
To characterize the LSD1 and H3K4me2 peaks, we divided the genomic regions into different groups based on their positions relative to the transcription start sites (TSS; ±2 kb) (Table 4). Analysis of the average LSD1 and H3K4me2 tag density distributions across the gene units (defined as the gene body plus 2,000 bp upstream of the TSS) revealed strong enrichment of LSD1 and H3K4me2 binding near the TSS. The majority of LSD1 and H3K4me2 binding sites were observed within 2,000 bp upstream or 1,000 bp downstream of the TSS of individual genes (Fig. 1A). Approximately 54% of the LSD1 and 80% of the H3K4me2 genomic regions were located within −2,000 to +1,000 bp of the TSS (Fig. 1B; also see Table S1 in the supplemental material). These results indicate that the majority of LSD1 and H3K4me2 is present at the promoter regions.
Fig 1.

ChIP-seq analysis demonstrates significant overlap between LSD1 and H3K4me2 genomic regions. (A) Tag density plot shows strong enrichment of LSD1 and H3K4me2 near the TSS. Distribution of LSD1 and H3K4me2 at the gene was defined as the intervals observed from 2 kb upstream from the TSS to the TES. (B) Summary of genome-wide distribution of LSD1 and H3K4me2 ChIP-seq peaks. The percentages of sites mapped to promoter, intragenic, and distal genomic regions are shown in parentheses. (C) LSD1 matrices predicted by the de novo motif discovery algorithm Weeder. (D) The top predicted LSD1 motif is localized within the center of the LSD1 binding peaks. The locations of the motifs were deduced from the Weeder output, and these values were used to compute distance to the center of the input sequences. (E) LSD1 binds to the genome in close proximity to H3K4me2. Approximately 91% of the LSD1 intervals overlap H3K4me2 intervals (marked by red line).
To determine the enriched motifs of LSD1 ChIP-seq peaks, we used a de novo motif discovery algorithm as described in the program Weeder (42). The top LSD1 motif (Fig. 1C and D) derived from the ChIP-seq data set resembles the nescient helix loop helix 1 (NHLH1) TRANSFAC motif (score of 0.945977). NHLH1 is a DNA binding protein and a member of the basic helix-loop-helix proteins (33). The SWIRM domain of LSD1 has been reported to form a helix-loop-helix motif and to bind to chromatin and nucleosomal DNA (14). In our genome-wide analysis, a subset of H3K4me2 binding regions lacked LSD1 binding sites. The recent identification of a demethylase capable of removing mono- and dimethyl moieties at H3K4 (25) suggests that another demethylase(s) may exist in ES cells that specifically recognize dimethylated H3K4 in a sequence-specific manner.
We also computed the genomic positions of LSD1 with H3K4me2 regions. LSD1/H3K4me2 peak regions are considered to be overlapping if they overlap or if the distance between them is less than 100 bp. We found that approximately 91% of LSD1 peak regions overlap H3K4me2 regions (Fig. 1E). These findings suggest that LSD1 and H3K4me2 regions are in close proximity to each other and located within nucleosomes rather than random genomic regions. A nearly complete overlap of LSD1 with H3K4me2 genomic regions suggests that LSD1 genomic regions are also highly enriched for H3K4me2 in ES cells.
The transcriptional corepressor LSD1 is enriched at the promoter regions of highly expressed genes in ES cells.
Previous studies have suggested that H3K4 dimethylation is associated with active gene promoters in ES cells (5); however, LSD1 functions as a transcriptional corepressor by removing mono- and dimethyl moieties from H3K4 (49). Therefore, we hypothesized that H3K4me2 will be enriched at active genes, whereas LSD1 will be enriched at genes that are repressed in ES cells. To examine the relationships of promoter status to the LSD1 and H3K4me2 enrichments, we compared the gene expression levels in R1 ES cells. Based on the microarray expression data (18), we found that the levels of LSD1 and H3K4me2 on the genome correlate positively with gene expression in ES cells (see Table S2 in the supplemental material). A class of highly expressed genes in ES cells had high levels of LSD1 and H3K4me2 levels, whereas low levels of LSD1 and H3K4me2 correlated with a group of genes expressed at low levels (Fig. 2A and B). These results suggest that both LSD1 and H3K4me2 are enriched at the promoter regions of highly expressed genes in ES cells. During the preparation of the manuscript, it was reported that LSD1 occupies the core promoters and enhancers of a substantial population of actively transcribed and bivalent genes in ES cells (62). Gene ontology enrichment analysis of LSD1 target genes revealed a significant representation of genes connected to mRNA transcriptional regulation (Fig. 2C). These results are consistent with the recent reports that LSD1 plays an important role in the regulation of gene transcription that is important for the maintenance and differentiation of ES cells (1, 16, 62).
Fig 2.
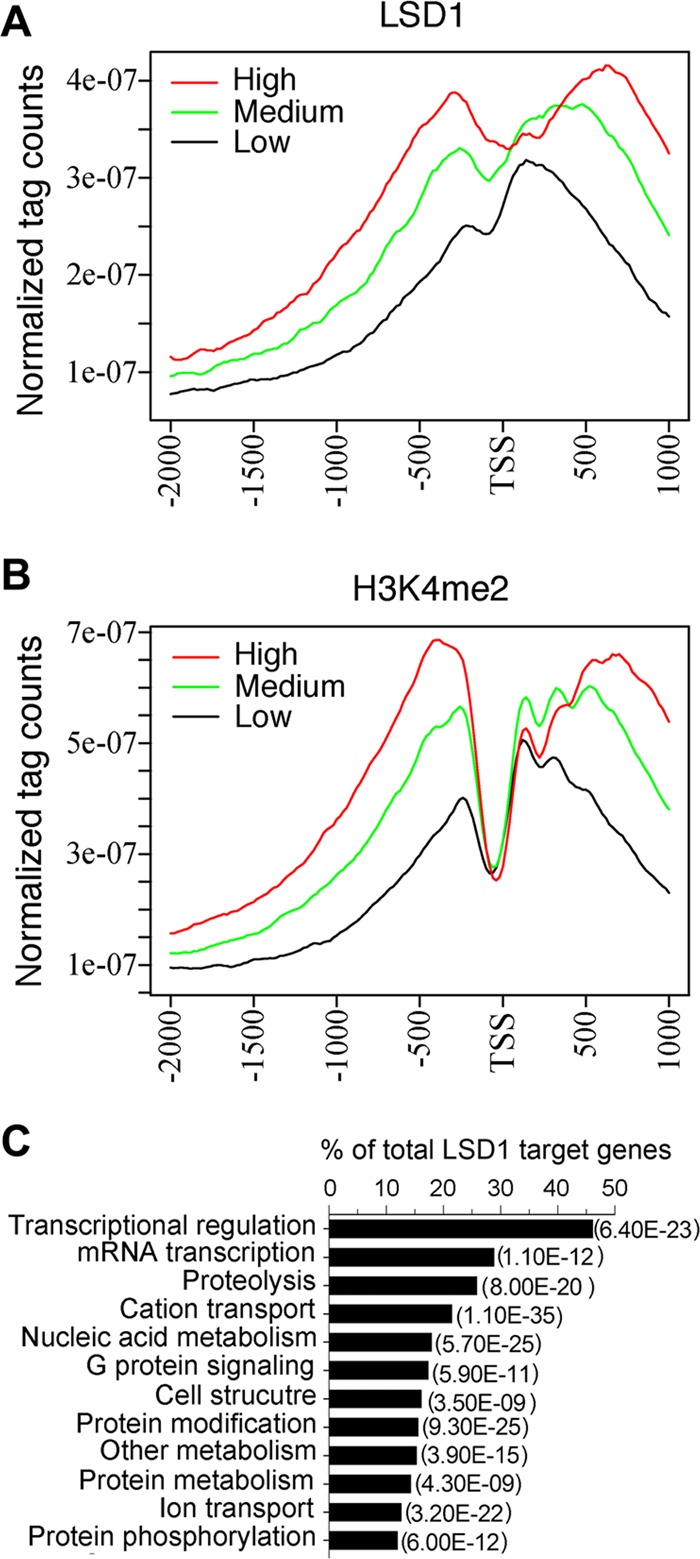
LSD1 and H3K4me2 are enriched at a group of active genes in mouse ES cells. (A and B) LSD1 (A) and H3K4me2 (B) peaks are enriched at active genes and correlate with gene expression in ES cells. The LSD1 and H3K4me2 levels were calculated for the gene sets and are represented as high, medium, or low levels. (C) The overrepresented set of LSD1 target genes is associated with transcriptional regulation. Gene ontology analysis was performed using tools provided by DAVID Bioinformatics Resources, and highly significant groups are shown. P values are shown in parentheses.
LSD1 is regulated in a cell cycle-dependent manner.
Genome-wide analysis revealed that LSD1 genomic regions overlap H3K4me2 regions and that the amounts of LSD1 and H3K4me2 correlate positively with gene expression in ES cells. To determine the molecular basis of complete overlap of LSD1 with H3K4me2 genomic regions, we examined the expression of LSD1 at the cellular level. Immunofluorescence staining coupled with analysis of the nuclear morphology characteristics of mitotic phases in ES cells growing under self-renewal conditions demonstrated that LSD1 is localized in the nuclei of cells at G1, S, and G2 phases of the cell cycle (Fig. 3A). These results are consistent with the chromatin-modifying activity of LSD1 (49). However, in mitotic cells (M phase), as determined by the nuclear morphology as shown in Fig. 3B, LSD1 was displaced from the chromatin, and it was mainly present in the cytoplasm of cells at all phases of mitosis (Fig. 3A and B). These results suggest that the occupancy of LSD1 at the chromatin is regulated in a cell cycle-dependent manner. Quantification of M-phase cells in ES cells growing under self-renewal conditions, determined by mitotic nuclear morphology and exclusion of LSD1 (Fig. 3B), suggests that approximately 6% of the cells in the cultures show mitotic nuclear morphology and LSD1 exclusion from the chromatin (Fig. 3D). Analysis of ES cell cultures by flow cytometry, which measures the cells at different stages of the cell cycle, showed that approximately 20% of the cells are in G2/M phase (Fig. 3E). We also used imaging flow cytometry, which combines high-speed multispectral image acquisition and automated image analysis to allow identification of the morphologically distinguishable phases of the cell cycle (Fig. 3F), and found that approximately 10% of the cells are in M phase of the cell cycle. The higher percentage of M-phase cells observed in flow cytometry analysis includes G2- and M-phase cells, whereas microscopic and imaging flow cytometry analyses only assess M-phase cells.
Fig 3.

LSD1 is regulated in a cell cycle-dependent manner. (A) Immunofluorescence analysis showing the association of LSD1 (green) with nuclei (blue) in G1, S, and G2 phases and its displacement from chromatin to cytoplasm of M-phase ES cells (arrows). DMSO, dimethyl sulfoxide. (B) LSD1 is excluded from the chromatin of cells at all phases of mitosis. R1 ES cells growing under self-renewal conditions were stained with antibodies to H3K4me2 (red; top) or LSD1 (green; bottom). Nuclei were stained with DAPI (blue). Arrows show cells at different phases of mitosis as indicated. Note the cytoplasmic localization of LSD1 in M-phase cells. (C) Synchronization of cells at G2/M phase by nocodazole treatment (100 ng/ml for 16 h) significantly increased the amount of cells with LSD1 (green) excluded from the chromatin (blue) (arrows). (D) Quantitation of cells in G1/S/G2 and M phase in R1 ES cultures. Cells grown in vehicle or nocodazole (100 ng/ml for 16 h) were stained with antibodies to LSD1, and nuclei were stained with DAPI. The nuclear morphology and the subcellular localization of LSD1 were analyzed by fluorescence microscopy. The numbers of cells analyzed for subcellular localization of LSD1 and nuclear morphology characteristics in G1/S/G2 and M phase in each group are shown in parentheses. (E) Flow cytometry analysis of R1 ES cells stained with Hoechst 33342. (F) Representative Amnis ImageStream flow cytometry images showing different stages of the cell cycle as indicated.
To further elucidate the dissociation of LSD1 from the chromatin of mitotic cells, we synchronized ES cells in G2/M phase using nocodazole, which exerts its effect in cells by interfering with the polymerization of microtubules, and localized LSD1 by immunostaining in these cells (Fig. 3C). There was a significant increase in the number of cells (37%) showing LSD1 dissociation from the chromatin as chromosomes condensed in M phase due to nocodazole treatment compared to the levels of dissociation in control and vehicle-treated cells, as determined by fluorescence microscopic analysis (Fig. 3C and D). Western immunoblotting confirmed that the levels of LSD1 protein remained unchanged in nocodazole-treated cells (Fig. 4A), suggesting that reduction of LSD1 at the mitotic chromatin is not mediated by the protein instability. The levels of Jarid1b, an H3K4 demethylase, were reduced in nocodazole-treated cells, suggesting that cell cycle-dependent downregulation of demethylases may exist during cell cycle progression (Fig. 4B). Analysis of histone H3 lysine 4 and 9 methylations using specific antibodies showed no global increase in the levels of H3K4me2 and H3K9me2, the substrates of LSD1, indicating that locus-specific changes in methylation may be occurring during the G2-M transition (Fig. 4C).
Fig 4.

(A and B) Stability of LSD1 protein was not affected by nocodazole treatment. R1 ES cells were treated with either vehicle or nocodazole (100 ng/ml for 16 h), and whole-cell extracts were prepared and subjected to immunoblotting for LSD1/GAPDH (A) and Jarid1b (B). Lanes 1, molecular mass marker; lanes 2, control; lanes 3, nocodazole-treated cells; lanes 4, vehicle-treated cells. (C) Synchronization of cells at G2/M phase by nocodazole (100 ng/ml for 16 h) had no effect on the levels of H3K4 and H3K9 methylations. Immunoblots of histones prepared from control (lane 1), nocodazole-treated (lane 2), and vehicle-treated (lane 3) cells were probed with indicated antibodies. (D) LSD1 interaction with CoREST is impaired in nocodazole-treated cells. Cell extracts from vehicle-treated (lane 1) and nocodazole-treated (lane 2) cells were immunoprecipitated (IP) with anti-LSD1 antibody and immunoblotted (IB) for CoREST. The same blot was stripped and reprobed for LSD1. (E) Western immunoblot showing the stability of CoREST in nocodazole-treated cells. Lane 1, vehicle-treated cells; lane 2, nocodazole-treated cells. (F) Immunoblots of chromatin prepared from vehicle-treated (lane 1) and nocodazole-treated (lane 2) cells were probed with LSD1 and H3K4me2. Note the reduced amount of LSD1 in chromatin prepared from nocodazole-treated cells. All of the blots shown are representative of two independent experiments.
To further confirm the exclusion of LSD1 from the chromatin of mitotic cells, we determined the association of LSD1 with CoREST during cell cycle progression. CoREST is a central binding partner of LSD1 in cells and, together with histone deacetylases 1 and 2 (HDAC1 and -2), forms an LSD1/CoREST/HDAC core complex (1, 31, 50, 66). We immunoprecipitated LSD1 from nocodazole-treated cells and tested its ability to interact with CoREST. In control cells, CoREST was coimmunoprecipitated with LSD1 (Fig. 4D, top, lane 1). However, we observed a decrease in the levels of CoREST protein in cells synchronized to G2/M phase by nocodazole (Fig. 4D, top, lane 1 versus lane 2). The stability of CoREST is unaffected by nocodazole treatment, as determined by Western blotting (Fig. 4E), which suggests that the reduction of CoREST in the coimmunoprecipitate correlates with a decrease in the association between LSD1 and CoREST proteins. We also examined the chromatin fractions isolated from cells synchronized to G2/M phase. This assay allows us to investigate the LSD1 occupancy at the chromatin of living cells, as formaldehyde preserves the molecular interactions between DNA and LSD1 protein through covalent cross-linking. Western blots of chromatin from R1 ES cells treated with nocodazole showed a reduction in the levels of LSD1 compared to the levels in vehicle-treated cells (Fig. 4F, top), confirming the disappearance of LSD1 from chromatin when cells enter mitosis. The nearly complete overlap of LSD1 and H3K4me2 genomic regions and the cell cycle-dependent recruitment of LSD1 to the chromatin suggest that LSD1 or H3K4me2 occupies LSD1 genomic regions alternately during cell cycle progression.
Corepressor activity of LSD1 is regulated in a cell cycle-dependent manner.
The genomic levels of LSD1 correlate positively with gene expression in ES cells. To determine the function of LSD1 in ES cells, we asked whether LSD1 functions as either a corepressor or an activator when directed to a target promoter. As shown in Fig. 5A, when fused to the GAL4 DNA binding domain (pBIND-LSD1), LSD1 downregulated the expression of the pG5luc reporter gene in a dose-dependent manner (Fig. 5B). As a control, the GAL4 DNA binding domain alone (pBIND) had no repressive effect on the same promoter (Fig. 5B). Importantly, a C-terminal deletion mutant (pBIND-LSD1Δ) that lacks a large portion of the amine oxidase homologous region (Fig. 5B) and is therefore enzymatically inactive was significantly compromised in its ability to repress transcription (Fig. 5B and C). Furthermore, pBIND-PGC1α, a nuclear coactivator (56), or a C-terminal deletion construct of PGC1α (pBIND-PGC1αD) showed no transcriptional repressive activity (Fig. 5C). These results were consistent with reported studies showing that the C-terminal amine oxidase domain of LSD1 is required for the transcriptional repressive function of LSD1 and is linked to its enzymatic activity (49).
Fig 5.

The corepressor activity of LSD1 is regulated in a cell cycle-dependent manner. (A) Schematic of the plasmid constructs pBIND-LSD1, c-terminal-deletion mutant pBIND-LSD1Δ, pBIND-PGC1α, and c-terminal-deletion mutant pBIND-PGC1αΔ. G4 DBD, GAL4 DNA binding domain; AO, amine oxidase; RBM, RNA binding motif. (B) pBIND-LSD1 represses transcription. Various amounts of pBIND-LSD1 or pBIND-LSD1Δ plasmid were transfected into R1 ES cells together with pG5luc reporter gene, and the cell extracts were prepared for luciferase activity measurements. In each sample, firefly luciferase activity was normalized to the Renilla luciferase value, and the results were expressed as the means ± standard errors of the means (SEM). The reporter activity in the presence of the pBIND vector was designated 100. The data are the means of three independent experiments. (C) pBIND-LSD1Δ mutant is defective in repression. The repression activity was expressed as the fold repression (mean ± SEM, n = 8) relative to the results for the pBIND vector (100%). pBIND-PGC1α and pBIND-PGC1αΔ constructs were used as controls. (D) Effect of nocodazole on LSD1 corepressor activity was tested by cotransfecting pBIND-LSD1 or pBIND-LSD1Δ plasmids along with the pG5luc reporter gene into R1 ES cells. In all, cells were treated with 100 ng/ml nocodazole 24 h after transfection. Luciferase activity was analyzed 16 h after the addition of nocodazole and compared with that in vehicle-treated cells (mean ± SEM, n = 8). For the experiments whose results are shown in panels C and D, 0.5 μg of plasmid constructs were used in all transfections. (E) Nocodazole treatment causes displacement of pBIND-LSD1 from the chromatin. R1 ES cells were transfected with pBIND-LSD1 construct and treated with vehicle or 100 ng/ml of nocodazole for 16 h. The cells were stained with LSD1 antibody (green) and nuclei with DAPI (blue). Note the dissociation of pBIND-LSD1 (green) in the cell with a condensed nucleus in the bottom panels. *, P > 0.001.
Nocodazole treatment synchronizes the cells into G2/M phase and induces dissociation of LSD1 from the chromatin (Fig. 3C and D). Having determined the efficiency and specificity of the pBIND-LSD1 construct in repressing a target promoter in ES cells, we proceeded to test the effect of the construct in G2/M-synchronized cells. ES cells transfected with the pG5luc reporter and pBIND-LSD1 or pBIND-LSD1Δ constructs were treated with nocodazole after 24 h of transfection, and luciferase activity was measured. Treatment with nocodazole significantly increased the expression of the pG5luc reporter in cells cotransfected with pBIND-LSD1 compared to its expression in vehicle-treated cells (Fig. 5D). Moreover, the expression of the pG5luc reporter in cells cotransfected with pBIND-LSD1Δ was unaffected by nocodazole treatment (Fig. 5D). These results suggest that the association of LSD1 to the chromatin of G1/S/G2 cells and its dissociation from the chromatin of M-phase cells may result in transcriptional repression and activation of LSD1 target genes, respectively.
To determine the dissociation of pBIND-LSD1 in nocodazole-treated cells, localization of LSD1 was carried out in cells transfected with the pBIND-LSD1 construct. Immunostaining of LSD1 in pBIND-LSD1-transfected cells showed that pBIND-LSD1 is localized in the nucleus, similar to endogenous LSD1. However, in nocodazole-treated cells, pBIND-LSD1 was localized in the cytoplasm, similar to the translocation observed with endogenous LSD1 (Fig. 5E). These results suggest that, analogous to endogenous LSD1, transiently expressed pBIND-LSD1 also undergoes cell cycle-dependent translocation.
LSD1 regulates the expression of selected LSD1 target genes.
To determine the gene regulatory role of LSD1 in ES cells, we reduced the levels of LSD1 in R1 ES cells by transfecting them with small interfering RNA (siRNA) against LSD1 (siLSD1). To ensure specificity, we also used a nontargeting pool of siRNA with a design and modification similar to those of LSD1 siRNA and shown to have minimal targeting of known genes in mouse cells (siControl). The effect of LSD1 siRNA on the expression of endogenous LSD1 in R1 ES cells was evaluated by Western blotting. A significant reduction (∼60%) in the level of LSD1 was observed at 48 h after transfection (Fig. 6A). Forty-eight hours after transfection, total RNA was purified from these cells, and the transcript levels of selected LSD1 targets (genes with LSD1 binding sites at the promoter regions) and nontargets (no LSD1 binding sites at the promoter region) were quantified by qRT-PCR (Fig. 6B). We found that LSD1 knockdown caused a significant increase in the expression levels of selected LSD1 targets without affecting the levels of non-LSD1 targets (Fig. 6B). In addition, we also quantified the expression of LSD1, Oct4, Nanog, c-Myc, Tbx3, Jarid1b, and β-actin by droplet digital PCR (ddPCR). Recently, ddPCR has emerged as a precise and sensitive PCR technique to quantify gene transcripts of interest. ddPCR reactions using serial dilutions of cDNAs allowed a precise estimation of the copy numbers in these samples. We observed an approximately 55% reduction in the levels of LSD1 and a 2-fold increase in the expression of Oct4 transcripts in cells transfected with siLSD1 for 48 h (Fig. 6C). The expression of Nanog, Tbx3, c-Myc, and Jarid1b remained unchanged in these cells compared to their expression in control cells (Fig. 6C). To determine the catalytic activity of LSD1 required for the suppression of Oct4, we transiently expressed LSD1 and LSD1(K661A), a demethylation-defective mutant (Fig. 6D, immunoblots) (65). We observed that LSD1(K661A) but not LSD1 increases the expression of Oct4 (Fig. 6D, graph), suggesting that LSD1 represses the expression of Oct4 in a demethylation-dependent manner. We further assessed whether the increase in the transcripts of Oct4 led to an increase in the levels of Oct4 protein. There was a clear increase in Oct4 protein levels when LSD1 siRNA was used, as validated by Western blotting (Fig. 6E to G). These results suggest that reduction of LSD1 activity plays a role in the transcriptional regulation of genes important for ES cells.
Fig 6.

LSD1 represses the expression of LSD1 target genes in ES cells. (A) Effect of LSD1 siRNA on endogenous levels of LSD1 protein in ES cells. Cells were transfected with siLSD1 and harvested at the indicated times. The LSD1 protein level was confirmed by Western blotting. GAPDH was used as a loading control. (B) Expression of selected LSD1 target genes and nontargets (Jarid1b, Clcn1, c-Myc, Nanog, and Tbx3) in ES cells at 48 h after siLSD1 transfection. A nonspecific control siRNA was included. cDNAs were prepared from the LSD1 knockdown cells and analyzed by real-time PCR, with fold differences measured against the results for control ES cells and normalized using β-actin, α-tubulin, and rps11 levels in these cells. Data are the means ± SEM from triplicate measurements (n = 6 to 8). (C) Increased expression of Oct4 in LSD1 knockdown cells was further confirmed by droplet digital PCR (ddPCR). Data are the means ± standard deviations (SD) (n = 4). (D) LSD1 enzymatic activity is required for the suppression of Oct4. Western blot analysis of LSD1 protein in ES cells transiently transfected with LSD1-FLAG or the catalytically inactive (K661A) form of LSD1 for 48 h is shown. The blots were probed with anti-LSD1 and anti-FLAG antibodies. Oct4 mRNA levels were quantified by ddPCR and normalized to β-actin levels in these cells. Data are the means ± SD (n = 4). *, P < 0.01 by one-way ANOVA followed by Tukey's post hoc comparisons. (E to G) Oct4 protein levels are shown to increase in LSD1 knockdown ES cells. R1 ES cells were transfected with LSD1 siRNA or control siRNA. After 48 h, total cell lysates were prepared, and Oct4 (E), GAPDH (F), and Nanog (G) levels were determined by Western immunoblotting. Lanes 1, molecular mass markers; lanes 2, control (nontransfected); lanes 3, siLSD1-treated cells; lanes 4, siControl-treated cells. Representative immunoblots from two independent experiments are shown.
It has been reported that LSD1 mRNA and protein are present in large amounts in undifferentiated ES cells (1, 16, 62). To address the role of LSD1 in mouse ES cell maintenance, we reduced the levels of LSD1 by using siRNA. LSD1 knockdown caused changes in colony morphology and the appearance of a large number of flat cells with enlarged cytoplasm (Fig. 7A). Reduced expression levels of LSD1 also caused a decrease in the growth rate, as determined by the CellTiter-Blue assay (Fig. 7B). Our results are consistent with the changes observed in LSD1 knockdown mouse and human ES cells (1, 58). Taken together, our findings suggest that LSD1 plays distinct roles in the maintenance and differentiation of ES cells.
Fig 7.

(A) Morphology of the mouse embryonic stem cell colonies at day 5 after the transfection with siLSD1. R1 ES cells were transfected with siControl or siLSD1 and stained with LSD1 antibody (green). (B) LSD1 knockdown affects growth rate of mouse embryonic stem cells. Cell growth was determined with the CellTiter-Blue assay after 5 days of transfection. Data are the means ± SEM of two independent experiments.
LSD1 maintains localized H3K4me2 levels.
We further pursued the mechanism by which the expression of LSD1 targets is upregulated in R1 ES cells transfected with siLSD1. In ES cells, the transcriptional regulation of Oct4, Sox2, and Nanog seems to involve a combination of transcriptional factors and an epigenetic system (2, 7, 13, 15, 34, 45). Our ChIP-seq analysis revealed that there are three LSD1 sites at the Oct4 promoter (Fig. 8A; also see Table S1 in the supplemental material) and that they overlap the CR1, CR3, and CR4-B conserved regions (13). Interestingly, the CR4-B conserved region harboring the Oct4 and Sox2 binding element has been reported to be involved in the transcriptional regulation of Oct4 in ES cells (13). Our ChIP-seq data also showed one LSD1 site at the Sox2 promoter (Fig. 8B). However, no LSD1 site was detected at the promoter regions of Nanog (Fig. 8C). To further confirm the ChIP-seq data, we analyzed the LSD1 sites on Oct4, Sox2, and Nanog promoters in R1 ES cells by ChIP assays. We used primer pairs overlapping the LSD1 binding regions and the first exon of Oct4 and Nanog (Fig. 8A to C) to quantify the ChIP-enriched DNA by real-time PCR. Consistent with the ChIP-seq data, approximately 15- and 10-fold increases in the levels of LSD1 (compared to the levels in the intergenic region) were observed at the promoter regions of Oct4 and Sox2, respectively (Fig. 8D and E), indicating that these regions were specifically occupied by LSD1. Moreover, no significant LSD1 enrichment was observed at the Nanog promoter (Fig. 8F). A control antibody showed no significant enrichment over any of the regions tested (Fig. 8D to F). In summary, we have clearly shown that LSD1 is recruited to the Oct4 and Sox2 promoter regions in ES cells.
Fig 8.

(A to C) UCSC Genome Browser maps show LSD1 peaks at the promoter regions of Oct4 and Sox2 in mouse ES cells. The locations of LSD1 peaks within the genes were defined as the intervals observed from 3 kb upstream to 2 kb downstream from the TSS. Amplicons are numbered relative to their TSS along the gene. The schematics at the bottom show the locations of the LSD1 peaks and at the top (numbered) show the locations of the primer sets used to detect the ChIP-enriched DNA fragments within the context of the genomic structures of mouse Oct4, Sox2, and Nanog. (D to F) High-resolution mapping of LSD1 binding sites across the Oct4, Sox2, and Nanog promoters in mouse ES cells by ChIP analysis. Fold enrichment is the relative abundance of DNA fragments at the indicated regions compared to the abundance at a control region (intergenic) as quantified by real-time PCR. Rabbit IgG was used as a control. *, P < 0.001. (G to L) ChIP analysis of H3K4me2 (G to I) and Oct4 (J to L) occupancy on the Oct4, Sox2, and Nanog promoters in LSD1 knockdown ES cells using the respective antibodies. LSD1 knockdown significantly increased H3K4me2 levels without affecting the levels of Oct4 at Oct4 and Sox2 promoters. Data are the means ± SD from three independent experiments. *, P < 0.01.
H3K4me2 has been found to be enriched around the transcriptional start site of active promoters (5, 19). LSD1 is known to be required for H3K4me2 demethylation and gene repression (49). The androgen and estrogen receptors that can switch LSD1 specificity from H3K4me/-me2 to H3K9me/-me2 (37, 62) are absent from ES cells; we therefore focused on the methylation status of H3K4me2. To determine the regulation of H3K4me2 on the Oct4, Sox2, and Nanog promoter regions by LSD1, we analyzed the H3K4me2 levels in LSD1 knockdown ES cells by ChIP. Repression of LSD1 activity by LSD1 siRNA increased the levels of H3K4me2 at Oct4 and Sox2 promoters (Fig. 8G and H) and showed no effect on the levels of H3K4me2 at the promoter of Nanog (Fig. 8I). From this, we conclude that LSD1 occupies the promoter regions of Oct4 and Sox2 in ES cells and that H3K4me2 levels at individual gene promoters are regulated by LSD1.
In ES cells, Oct4 binds to the Sox-Oct element located at the promoter regions of Oct4, Sox2, and Nanog and regulates the promoter activity of these genes (9, 13, 45). In agreement with reported studies, Oct4 ChIP assays of ES cells showed enrichment of DNA fragments in the CR4-B region of Oct4 (Fig. 8J). At 2 days after LSD1 depletion, there was no change in Oct4 levels at the Oct4, Nanog, and Sox2 promoter regions examined (Fig. 8J to L). These data indicate that an increase in the level of H3K4me2 is a direct result of LSD1 depletion and that the recruitment of LSD1 is not mediated by the gain of Oct4 at the promoter.
LSD1 regulates cell cycle-dependent expression of selected LSD1 target genes.
LSD1 acts as a transcriptional corepressor by binding to the chromatin. We found that LSD1 is excluded from the chromatin of mitotic cells (Fig. 3A to D), suggesting that LSD1 activity can be regulated in a cell cycle-dependent manner. Therefore, we hypothesized that exclusion of LSD1 from the chromatin might activate the expression of LSD1 targets in mitotic cells, whereas these genes are repressed in nonmitotic cells by its binding to the promoter regions. To verify the hypothesis, we quantified the levels of selected LSD1 targets and nontargets by RT-qPCR in cells synchronized to M phase with nocodazole and vincristine. The distribution of M-phase cells in culture was changed after nocodazole and vincristine treatment, as determined by imaging flow cytometry (Fig. 9A). To determine the dissociation of LSD1 in nocodazole-treated cells, ChIP experiments were carried out in synchronized cells. We found significant losses of LSD1 at the promoters of Oct4 and Sox2, two of the LSD1 target genes in nocodazole-treated cells (Fig. 9B to C), without an effect on the level of LSD1 at the Nanog promoter (Fig. 9D). The loss of LSD1 from the Oct4 and Sox2 promoters in cells treated with nocodazole was correlated with increased levels of H3K4me2 (Fig. 9E to G). Interaction of LSD1 with the CoREST-HDAC1/2 core complex is required for chromatin modification and gene repression (50). However, we found no decrease in the levels of CoREST at these promoters in nocodazole-treated cells (data not shown). To determine whether dissociation of LSD1 regulates the expression of LSD1 target genes during cell cycle progression, 10 LSD1-positive and five negative targets were examined in cells synchronized to M phase. As shown in Fig. 9H to Q, the expression of LSD1 target genes was increased in nocodazole- and vincristine-treated cells, with no effect on the expression of LSD1-negative genes (Fig. 9R to V). The increased mRNA levels of LSD1 targets correlate with an increase in the levels of cells at M phase and the dissociation of LSD1 from the chromatin (Fig. 9A to D). These results support the hypothesis that, during cell cycle progression, the transcription of a subset of LSD1 target genes is regulated in a cell cycle-dependent manner.
Fig 9.

Cell cycle-dependent expression of selected LSD1 target genes. (A) Nocodazole and vincristine treatment significantly increased the number of cells in M phase. Cells were treated with 100 ng/ml of nocodazole or vincristine for the indicated period of time, and cells at different phases of the cell cycle were analyzed by imaging flow cytometry. (B to G) ChIP analysis of LSD1 (B to D) and H3K4me2 (E to G) on Oct4, Sox2, and Nanog promoter regions in R1 ES cells treated with nocodazole or vehicle for the indicated period of time. Data are the means ± SD from three independent experiments. Treatment of ES cells with nocodazole for 16 h significantly reduced the occupancy of LSD1 and increased H3K4me2 at Oct4 and Sox2 promoters. *, P < 0.01. (H to V) Expression of selected LSD1 target genes (H to Q) and nontargets (R to V) in nocodazole- and vincristine-treated ES cells. R1 ES cells were treated with 100 ng/ml of nocodazole or vincristine for the indicated period of time, and mRNA levels were analyzed by qRT-PCR with fold differences measured against the results for control ES cells (0 h) and normalized using β-actin, α-tubulin, and rps11 levels in these cells (mean ± SEM, n = 6; *, P < 0.01). Treatment with nocodazole and vincristine increased the expression of selected LSD1 target genes without affecting the expression of nontarget genes.
DISCUSSION
In this study, we have shown that LSD1, a component of corepressor complexes, mediates short-time-scale gene expression changes during ES cell cycle progression. The repressive function of LSD1 is mediated by the recruitment of LSD1 to the chromatin of G1/S/G2 cells, and its displacement from the chromatin of mitotic cells enhances gene transcription. The differences in the expression of a reporter gene observed by the recruitment and dissociation of LSD1 suggest that transient interaction of LSD1 with chromatin mediates short-time-scale gene expression changes in a cell cycle-dependent manner. The increased mRNA levels of a subset of LSD1 target genes in LSD1 knockdown and ES cells synchronized at M phase further support this distinction.
LSD1 contributes to target gene repression by removing mono- and dimethyl marks from H3K4 (50, 60). Recent reports have demonstrated that high levels of LSD1 are needed to maintain the undifferentiated state of human and mouse embryonic stem cells and that this is achieved through the removal of H3K4 methylation (1, 64). Our data show that LSD1 is enriched at the genomic regions of a subset of highly expressed genes in mouse ES cells and that these regions are also enriched for H3K4me2 (49). During the preparation of the manuscript, LSD1 has been shown to occupy the core promoters and enhancers of a substantial population of actively transcribed genes in mouse ES cells (62). The largest group of LSD1-bound genes (∼46%) in ES cells was connected to mRNA transcriptional regulation. The resemblance of the predicted LSD1 motif to NHLH1, a DNA binding motif (33), and the almost complete colocalization of LSD1 genomic regions with H3K4me2 suggest that LSD1 binds to the nucleosomal DNA in a sequence-specific manner. Immunostaining of cells showed that LSD1 is associated with the chromatin of cells at G1/S/G2 phases of the cell cycle and displaced from it in M-phase cells. These observations suggest that LSD1 genomic regions are alternately occupied by LSD1 or H3K4me2 during ES cell cycle progression and provide an explanation for the colocalization of LSD1 and H3K4me2 sites observed in our ChIP-seq analysis. LSD1 interaction with components of corepressor complexes is essential for the control of gene expression programs and cell fate decisions in ES cells (1, 16, 62, 64). Microscopic analysis coupled with immunoprecipitation and ChIP analysis showed that LSD1 dissociates from the chromatin of M-phase cells. However, the levels of LSD1 remained unchanged during cell cycle progression, suggesting that cell cycle-dependent recruitment of LSD1 is not mediated by the changes in its stability. Posttranslational modifications of proteins have been reported to play an important role in the displacement of transcription factors from the chromatin of mitotic cells (4, 17). Similar to transcription factors, posttranslational modifications of LSD1 or its interacting partners, a poorly explored area as yet, may play a role in modulating LSD1 function in mitotic cells.
Cell cycle-dependent gene expression is required for the proliferation of a dividing cell. Gene regulation involves an orchestrated interplay between general transcription machinery and sequence-specific and chromatin-modifying factors (28, 67). LSD1 facilitates transcriptional repression by modification of core histone amino-terminal tails (49). However, how the chromatin-modifying factors are regulated during cell cycle progression remains unknown. The ChIP-seq experiments described here reveal that LSD1 and H3K4me2 can be detected on each of the LSD1 promoters we examined. Furthermore, LSD1 recruitment is cell cycle dependent, exhibiting significant recruitment during G1/S/G2 and dissociation from the chromatin by M-phase cells. We have provided the following evidence to support a physiological role for this cell cycle-dependent recruitment of LSD1. Analogous to the recruitment of LSD1 in G1/S/G2 cells, when directed to a target promoter, LSD1 repressed gene expression, whereas, similar to LSD1 displacement observed in mitotic cells, synchronization of cells at M phase by nocodazole treatment enhanced expression of the target genes. Furthermore, similar to endogenous LSD1 translocation in M-phase cells, nocodazole treatment also caused translocation of transiently expressing pBIND-LSD1. Taken together, our data support a model in which LSD1 functions as a repressor when recruited to the chromatin in G1/S/G2 cells. Loss of LSD1 repressive activity, caused by the displacement of LSD1 from the chromatin, upregulates LSD1 target genes in M-phase cells. Thus, transient interaction of LSD1 with chromatin mediates short-time-scale gene expression changes during ES cell cycle progression.
Having demonstrated that LSD1 is recruited to the chromatin and mediates cell cycle-dependent gene regulation, we next investigated the effect of LSD1 depletion on endogenous gene repression. Interestingly, we observed LSD1 peaks at the upstream regulatory region of Oct4 and Sox2, two key regulators of self-renewal and pluripotency in ES cells (13, 34). The LSD1 regions overlap known proximal enhancer regions conserved region 1 (CR1) and CR3 and a distal enhancer, conserved region 4-B (CR4-B), of the Oct4 promoter (13). The CR4-B region has been shown to harbor the composite Oct4/Sox2 element that contributes to their expression. Using a ChIP assay, we confirmed that LSD1 binds to the promoter regions of Oct4 and Sox2. Our results show that reduction of LSD1 expression by siRNA led to an upregulation of Oct4 mRNA and protein. The upregulation of Oct4 in LSD1 knockdown cells was also correlated with an increase in the levels of H3K4me2. Similar to LSD1, Oct4 has been shown to associate with different subunits of the NuRD and CoREST complexes (41, 57, 60, 62), raising the possibility that Oct4 participates in the recruitment of LSD1 to target genes through indirect interactions. However, no increase in the levels of Oct4 was observed at the promoter regions of Oct4 and Nanog in LSD1-depleted cells, suggesting that the recruitment of LSD1 to the promoter is not mediated by the Oct4 transcription factor. The enrichment of the NHLH1 motif (33) in LSD1 ChIP-seq analysis showed that LSD1 is localized on the genome in a sequence-specific manner. Interaction of LSD1 with the CoREST-HDAC1/2 core complex is required for chromatin modification and gene repression (50). However, nocodazole treatment caused the translocation only of LSD1 and not of CoREST from the chromatin. Taken together, we conclude that LSD1 may downregulate the expression of genes through direct interaction with CoREST and that in the absence of LSD1, CoREST may interact with coactivators and transcription factors to upregulate gene expression.
In summary, our results show that, in addition to the well-established control of transcriptional regulation by chromatin condensation and phosphorylation of transcription factors during mitosis, the transcriptional corepressor LSD1 provides control of gene expression during cell division. Our work establishes a mechanistic model that explains the dual role of LSD1 in mediating short-time-scale gene expression during ES cell cycle progression, as well as the ability of ES cells to self-renew and remain pluripotent. Recent studies show that mammalian LSD1 directly targets transforming growth factor β1 (TGF-β1) for transcriptional repression and has cell-autonomous roles in cancer (47, 54, 60). Cancer stem cells are considered the origin of various heterogeneous cancer populations due to their pluripotent or multipotent stem cell property (29, 52). These tumor cells often display pluripotent stem cell properties, express stem cell markers Oct4 and Sox2, and are capable of differentiating into various tissue types (3, 12, 55). Treatment of P19 embryonal carcinoma cells with the LSD1 inhibitor tranylcypromine has been shown to increase the expression of the pluripotent stem cell marker Oct4 (32), suggesting that a link between LSD1 and Oct4 expression may exist in cancer stem cells.
Supplementary Material
ACKNOWLEDGMENTS
We thank Warren Olanow and Lidija Ivic for critical reading of the manuscript and valuable discussions. We are grateful to Genpathway, Inc., for ChIP sequencing, A. Yokoyama for the LSD1K661A construct, and Ke Jiang and Nada Marjanovic for technical assistance with PCR assays.
Footnotes
Published ahead of print 1 October 2012
Supplemental material for this article may be found at http://mcb.asm.org/.
REFERENCES
- 1.Adamo A, et al. 2011. LSD1 regulates the balance between self-renewal and differentiation in human embryonic stem cells. Nat. Cell Biol. 13:652–660 [DOI] [PubMed] [Google Scholar]
- 2.Ang YS, et al. 2011. Wdr5 mediates self-renewal and reprogramming via the embryonic stem cell core transcriptional network. Cell 145:183–197 [DOI] [PMC free article] [PubMed] [Google Scholar]
- 3.Atlasi Y, Mowla SJ, Ziaee SA, Bahrami AR. 2007. OCT-4, an embryonic stem cell marker, is highly expressed in bladder cancer. Int. J. Cancer 120:1598–1602 [DOI] [PubMed] [Google Scholar]
- 4.Belmont AS. 2006. Mitotic chromosome structure and condensation. Curr. Opin. Cell Biol. 18:632–638 [DOI] [PubMed] [Google Scholar]
- 5.Bernstein BE, et al. 2005. Genomic maps and comparative analysis of histone modifications in human and mouse. Cell 120:169–181 [DOI] [PubMed] [Google Scholar]
- 6.Bonasio R, Tu S, Reinberg D. 2010. Molecular signals of epigenetic states. Science 330:612–616 [DOI] [PMC free article] [PubMed] [Google Scholar]
- 7.Boyer LA, et al. 2005. Core transcriptional regulatory circuitry in human embryonic stem cells. Cell 122:947–956 [DOI] [PMC free article] [PubMed] [Google Scholar]
- 8.Burdon T, Smith A, Savatier P. 2002. Signalling, cell cycle and pluripotency in embryonic stem cells. Trends Cell Biol. 12:432–438 [DOI] [PubMed] [Google Scholar]
- 9.Catena R, et al. 2004. Conserved POU binding DNA sites in the Sox2 upstream enhancer regulate gene expression in embryonic and neural stem cells. J. Biol. Chem. 279:41846–41857 [DOI] [PubMed] [Google Scholar]
- 10.Chambers I, Tomlinson SR. 2009. The transcriptional foundation of pluripotency. Development 136:2311–2322 [DOI] [PMC free article] [PubMed] [Google Scholar]
- 11.Chen Y, et al. 2006. Crystal structure of human histone lysine-specific demethylase 1 (LSD1). Proc. Natl. Acad. Sci. U. S. A. 103:13956–13961 [DOI] [PMC free article] [PubMed] [Google Scholar]
- 12.Cheng L, et al. 2007. OCT4: biological functions and clinical applications as a marker of germ cell neoplasia. J. Pathol. 211:1–9 [DOI] [PubMed] [Google Scholar]
- 13.Chew JL, et al. 2005. Reciprocal transcriptional regulation of Pou5f1 and Sox2 via the Oct4/Sox2 complex in embryonic stem cells. Mol. Cell. Biol. 25:6031–6046 [DOI] [PMC free article] [PubMed] [Google Scholar]
- 14.Da G, et al. 2006. Structure and function of the SWIRM domain, a conserved protein module found in chromatin regulatory complexes. Proc. Natl. Acad. Sci. U. S. A. 103:2057–2062 [DOI] [PMC free article] [PubMed] [Google Scholar]
- 15.Fong YW, et al. 2011. A DNA repair complex functions as an Oct4/Sox2 coactivator in embryonic stem cells. Cell 147:120–131 [DOI] [PMC free article] [PubMed] [Google Scholar]
- 16.Foster CT, et al. 2010. Lysine-specific demethylase 1 regulates the embryonic transcriptome and CoREST stability. Mol. Cell. Biol. 30:4851–4863 [DOI] [PMC free article] [PubMed] [Google Scholar]
- 17.Gottesfeld JM, Forbes DJ. 1997. Mitotic repression of the transcriptional machinery. Trends Biochem. Sci. 22:197–202 [DOI] [PubMed] [Google Scholar]
- 18.Hailesellasse Sene K, et al. 2007. Gene function in early mouse embryonic stem cell differentiation. BMC Genomics 8:85 doi:10.1186/1471-2164-8-85. [DOI] [PMC free article] [PubMed] [Google Scholar]
- 19.Heintzman ND, et al. 2007. Distinct and predictive chromatin signatures of transcriptional promoters and enhancers in the human genome. Nat. Genet. 39:311–318 [DOI] [PubMed] [Google Scholar]
- 20.Huang J, et al. 2007. p53 is regulated by the lysine demethylase LSD1. Nature 449:105–108 [DOI] [PubMed] [Google Scholar]
- 21.Huang da W, Sherman BT, Lempicki RA. 2009. Systematic and integrative analysis of large gene lists using DAVID bioinformatics resources. Nat. Protoc. 4:44–57 [DOI] [PubMed] [Google Scholar]
- 22.Humphrey GW, et al. 2001. Stable histone deacetylase complexes distinguished by the presence of SANT domain proteins CoREST/kiaa0071 and Mta-L1. J. Biol. Chem. 276:6817–6824 [DOI] [PubMed] [Google Scholar]
- 23.Ivanova N, et al. 2006. Dissecting self-renewal in stem cells with RNA interference. Nature 442:533–538 [DOI] [PubMed] [Google Scholar]
- 24.Karolchik D, et al. 2008. The UCSC Genome Browser Database: 2008 update. Nucleic Acids Res. 36:D773–D779 [DOI] [PMC free article] [PubMed] [Google Scholar]
- 25.Karytinos A, et al. 2009. A novel mammalian flavin-dependent histone demethylase. J. Biol. Chem. 284:17775–17782 [DOI] [PMC free article] [PubMed] [Google Scholar]
- 26.Kim J, Chu J, Shen X, Wang J, Orkin SH. 2008. An extended transcriptional network for pluripotency of embryonic stem cells. Cell 132:1049–1061 [DOI] [PMC free article] [PubMed] [Google Scholar]
- 27.Kontaki H, Talianidis I. 2010. Lysine methylation regulates E2F1-induced cell death. Mol. Cell 39:152–160 [DOI] [PubMed] [Google Scholar]
- 28.Kouzarides T. 2007. Chromatin modifications and their function. Cell 128:693–705 [DOI] [PubMed] [Google Scholar]
- 29.Lapidot T, et al. 1994. A cell initiating human acute myeloid leukaemia after transplantation into SCID mice. Nature 367:645–648 [DOI] [PubMed] [Google Scholar]
- 30.Lee J, Go Y, Kang I, Han YM, Kim J. 2010. Oct-4 controls cell-cycle progression of embryonic stem cells. Biochem. J. 426:171–181 [DOI] [PMC free article] [PubMed] [Google Scholar]
- 31.Lee MG, Wynder C, Cooch N, Shiekhattar R. 2005. An essential role for CoREST in nucleosomal histone 3 lysine 4 demethylation. Nature 437:432–435 [DOI] [PubMed] [Google Scholar]
- 32.Lee MG, Wynder C, Schmidt DM, McCafferty DG, Shiekhattar R. 2006. Histone H3 lysine 4 demethylation is a target of nonselective antidepressive medications. Chem. Biol. 13:563–567 [DOI] [PubMed] [Google Scholar]
- 33.Lipkowitz S, et al. 1992. A comparative structural characterization of the human NSCL-1 and NSCL-2 genes. Two basic helix-loop-helix genes expressed in the developing nervous system. J. Biol. Chem. 267:21065–21071 [PubMed] [Google Scholar]
- 34.Loh YH, et al. 2006. The Oct4 and Nanog transcription network regulates pluripotency in mouse embryonic stem cells. Nat. Genet. 38:431–440 [DOI] [PubMed] [Google Scholar]
- 35.Marson A, et al. 2008. Connecting microRNA genes to the core transcriptional regulatory circuitry of embryonic stem cells. Cell 134:521–533 [DOI] [PMC free article] [PubMed] [Google Scholar]
- 36.Martinez NJ, Gregory RI. 2010. MicroRNA gene regulatory pathways in the establishment and maintenance of ESC identity. Cell Stem Cell 7:31–35 [DOI] [PMC free article] [PubMed] [Google Scholar]
- 37.Metzger E, et al. 2005. LSD1 demethylates repressive histone marks to promote androgen-receptor-dependent transcription. Nature 437:436–439 [DOI] [PubMed] [Google Scholar]
- 38.Nagy A, Rossant J, Nagy R, Abramow-Newerly W, Roder JC. 1993. Derivation of completely cell culture-derived mice from early-passage embryonic stem cells. Proc. Natl. Acad. Sci. U. S. A. 90:8424–8428 [DOI] [PMC free article] [PubMed] [Google Scholar]
- 39.Nair VD. 2006. Activation of p53 signaling initiates apoptotic death in a cellular model of Parkinson's disease. Apoptosis 11:955–966 [DOI] [PubMed] [Google Scholar]
- 40.Orkin SH, Hochedlinger K. 2011. Chromatin connections to pluripotency and cellular reprogramming. Cell 145:835–850 [DOI] [PMC free article] [PubMed] [Google Scholar]
- 41.Pardo M, et al. 2010. An expanded Oct4 interaction network: implications for stem cell biology, development, and disease. Cell Stem Cell 6:382–395 [DOI] [PMC free article] [PubMed] [Google Scholar]
- 42.Pavesi G, Mauri G, Pesole G. 2001. An algorithm for finding signals of unknown length in DNA sequences. Bioinformatics 17(Suppl 1):S207–S214 [DOI] [PubMed] [Google Scholar]
- 43.Perissi V, Jepsen K, Glass CK, Rosenfeld MG. 2010. Deconstructing repression: evolving models of co-repressor action. Nat. Rev. Genet. 11:109–123 [DOI] [PubMed] [Google Scholar]
- 44.Pruitt KD, Tatusova T, Maglott DR. 2003. NCBI Reference Sequence project: update and current status. Nucleic Acids Res. 31:34–37 [DOI] [PMC free article] [PubMed] [Google Scholar]
- 45.Rodda DJ, et al. 2005. Transcriptional regulation of nanog by OCT4 and SOX2. J. Biol. Chem. 280:24731–24737 [DOI] [PubMed] [Google Scholar]
- 46.Ruiz S, et al. 2011. A high proliferation rate is required for cell reprogramming and maintenance of human embryonic stem cell identity. Curr. Biol. 21:45–52 [DOI] [PMC free article] [PubMed] [Google Scholar]
- 47.Schulte JH, et al. 2009. Lysine-specific demethylase 1 is strongly expressed in poorly differentiated neuroblastoma: implications for therapy. Cancer Res. 69:2065–2071 [DOI] [PubMed] [Google Scholar]
- 48.Shechter D, Dormann HL, Allis CD, Hake SB. 2007. Extraction, purification and analysis of histones. Nat. Protoc. 2:1445–1457 [DOI] [PubMed] [Google Scholar]
- 49.Shi Y, et al. 2004. Histone demethylation mediated by the nuclear amine oxidase homolog LSD1. Cell 119:941–953 [DOI] [PubMed] [Google Scholar]
- 50.Shi YJ, et al. 2005. Regulation of LSD1 histone demethylase activity by its associated factors. Mol. Cell 19:857–864 [DOI] [PubMed] [Google Scholar]
- 51.Silva J, Smith A. 2008. Capturing pluripotency. Cell 132:532–536 [DOI] [PMC free article] [PubMed] [Google Scholar]
- 52.Singh SK, et al. 2004. Identification of human brain tumour initiating cells. Nature 432:396–401 [DOI] [PubMed] [Google Scholar]
- 53.Suganuma T, Workman JL. 2011. Signals and combinatorial functions of histone modifications. Annu. Rev. Biochem. 80:473–499 [DOI] [PubMed] [Google Scholar]
- 54.Suikki HE, et al. 2010. Genetic alterations and changes in expression of histone demethylases in prostate cancer. Prostate 70:889–898 [DOI] [PubMed] [Google Scholar]
- 55.Sung MT, Jones TD, Beck SD, Foster RS, Cheng L. 2006. OCT4 is superior to CD30 in the diagnosis of metastatic embryonal carcinomas after chemotherapy. Hum. Pathol. 37:662–667 [DOI] [PubMed] [Google Scholar]
- 56.Tateishi K, Okada Y, Kallin EM, Zhang Y. 2009. Role of Jhdm2a in regulating metabolic gene expression and obesity resistance. Nature 458:757–761 [DOI] [PMC free article] [PubMed] [Google Scholar]
- 57.van den Berg DLC, et al. 2010. An Oct4-centered protein interaction network in embryonic stem cells. Cell Stem Cell 6:369–381 [DOI] [PMC free article] [PubMed] [Google Scholar]
- 58.Wang J, et al. 2009. The lysine demethylase LSD1 (KDM1) is required for maintenance of global DNA methylation. Nat. Genet. 41:125–129 [DOI] [PubMed] [Google Scholar]
- 59.Wang J, et al. 2007. Opposing LSD1 complexes function in developmental gene activation and repression programmes. Nature 446:882–887 [DOI] [PubMed] [Google Scholar]
- 60.Wang Y, et al. 2009. LSD1 is a subunit of the NuRD complex and targets the metastasis programs in breast cancer. Cell 138:660–672 [DOI] [PubMed] [Google Scholar]
- 61.White J, Dalton S. 2005. Cell cycle control of embryonic stem cells. Stem Cell Rev. 1:131–138 [DOI] [PubMed] [Google Scholar]
- 62.Whyte WA, et al. 2012. Enhancer decommissioning by LSD1 during embryonic stem cell differentiation. Nature 482:221–225 [DOI] [PMC free article] [PubMed] [Google Scholar]
- 63.Yang M, et al. 2006. Structural basis for CoREST-dependent demethylation of nucleosomes by the human LSD1 histone demethylase. Mol. Cell 23:377–387 [DOI] [PubMed] [Google Scholar]
- 64.Yang P, et al. 2011. RCOR2 is a subunit of the LSD1 complex that regulates ESC property and substitutes for SOX2 in reprogramming somatic cells to pluripotency. Stem Cells 29:791–801 [DOI] [PubMed] [Google Scholar]
- 65.Yokoyama A, Takezawa S, Schule R, Kitagawa H, Kato S. 2008. Transrepressive function of TLX requires the histone demethylase LSD1. Mol. Cell. Biol. 28:3995–4003 [DOI] [PMC free article] [PubMed] [Google Scholar]
- 66.You A, Tong JK, Grozinger CM, Schreiber SL. 2001. CoREST is an integral component of the CoREST-human histone deacetylase complex. Proc. Natl. Acad. Sci. U. S. A. 98:1454–1458 [DOI] [PMC free article] [PubMed] [Google Scholar]
- 67.Young RA. 2011. Control of the embryonic stem cell state. Cell 144:940–954 [DOI] [PMC free article] [PubMed] [Google Scholar]
- 68.Zhang X, et al. 2009. A role for NANOG in G1 to S transition in human embryonic stem cells through direct binding of CDK6 and CDC25A. J. Cell Biol. 184:67–82 [DOI] [PMC free article] [PubMed] [Google Scholar]
- 69.Zhang Y, et al. 2008. Model-based analysis of ChIP-seq (MACS). Genome Biol. 9:R137 doi:10.1186/gb-2008-9-9-r137. [DOI] [PMC free article] [PubMed] [Google Scholar]
Associated Data
This section collects any data citations, data availability statements, or supplementary materials included in this article.