Abstract
We measure the stability and folding rate of a mutant of the enzyme phosphoglycerate kinase (PGK) inside bone tissue cells as a function of temperature from 38 to 48 °C. To facilitate measurement in individual living cells, we developed a rapid laser temperature stepping method capable of measuring complete thermal melts and kinetic traces in about two min. We find that this method yields improved thermal melts compared to heating a sample chamber or microscope stage. By comparing results for six cells with in vitro data, we show that the protein is stabilized by about 6 kJ/mole in the cytoplasm, but the temperature dependence of folding kinetics is similar to in vitro. The main difference is a slightly steeper temperature dependence of the folding rate in some cells that can be rationalized in terms of temperature-dependent crowding, local viscosity, or hydrophobicity. The observed rate coefficients can be fitted within measurement uncertainty by an effective two-state model, even though PGK folds by a multistate mechanism. We validate the effective two-state model with a three-state free energy landscape of PGK to illustrate that the effective fitting parameters can represent a more complex underlying free energy landscape.
Keywords: activation barrier, fluorescence microscopy, Förster resonance energy transfer (FRET), green fluorescent protein (GFP), thermal denaturation
As the ability of molecular dynamics and physics-based force fields to simulate protein folding kinetics improves (1–3), folding kinetics in complex environments such as crowding agents (4–6) or living cells (7) is receiving increased attention. Energy landscape theory predicts that the free energies of different protein states are similar, and that the free energy barriers connecting these states are small (8); hence, one might expect that even small perturbations in vivo (on the order of RT ≈ 2.5 kJ/mole) can have significant effects on folding and function: the relative population of two pathways is exponentially sensitive to their free energy difference (Boltzmann factor). In this manner, different microenvironments in the cell could exert localized “post-post-translational” control over protein structure, folding, and function (9).
Due to their dynamic nature and small folding equilibrium constant, proteins spontaneously unfold and refold many times in vivo between translational synthesis and degradation. We recently developed Fast Relaxation Imaging (FReI) to study post-translational unfolding and refolding kinetics inside cells (10). The technique applies small temperature upward or downward jumps to living cells and monitors a target protein that has been FRET-labeled to distinguish native and unfolded states by fluorescence microscopy. As our prototype protein, we chose a FRET-labeled phosphoglycerate kinase construct (FRET-PGK) for comparison between in cell and in vitro. This multistate folder should be particularly sensitive to cellular modulation of its folding rate and mechanism. We found that unfolding was highly reversible in the cytoplasm up to 43 °C (10). The local viscosity experienced by the polypeptide chain is about twice as large as in aqueous solvent (7). Significant kinetic differences exist between in vitro, nuclear, and endoplasmic reticulum refolding environments (11).
We now study the temperature dependence of FRET-PGK stability and relaxation kinetics in bone tissue cancer (U2OS) cells to provide a more stringent comparison with in vitro results. By developing an automated temperature stepping method, we are able to complete a series of thermal melts and kinetics within ∼2 min compared to the previous ∼2 h for such measurements. This reduces cell damage and propensity for aggregation. We compared the rate coefficients for six cells with the in vitro result. The melting curve and rate coefficients could be fitted by an effective two-state model. A more sophisticated hierarchical three-state free energy landscape confirms the adequacy of the two-state model and matches the nonexponential relaxation kinetics observed by FReI. Consistent with previous measurements (7, 10), we find that FRET-PGK thermal stability increases by ≈6 kJ/mole in the cells, and that relaxation is slightly slower. Otherwise, the temperature dependence of the rate coefficients kf (folding) and ku (unfolding) in the cytoplasm closely resembles the in vitro data. The notable exception is small differences in curvature or tilt of kf and ku as a function of temperature. To rationalize these differences, we offer several hypotheses that would be interesting to test with coarse-grained crowding simulations of PGK folding.
Results
Fluorescence Detection and Fast Temperature Stepping.
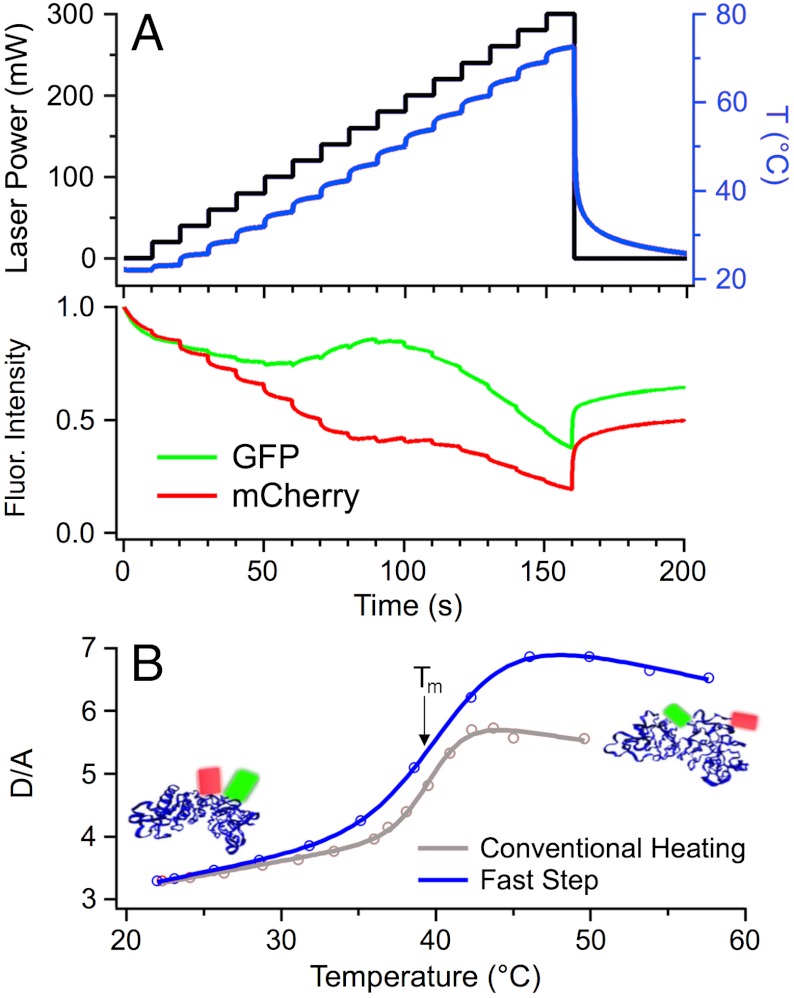
Our probe protein FRET-PGK is a low-melting triple mutant (Y122W/W308F/W333F) of the ATP-producing enzyme phosphoglycerate kinase (10). The enzyme is labeled with a green AcGFP1 donor at the N-terminus and a red mCherry acceptor at the C-terminus (Fig. 1) so fluorescence switches from red towards green when the enzyme unfolds. U2OS cells expressing the protein adhered to a glass slide immersed in a 120 μm layer of culture medium. The donor was excited by a blue LED and green and red fluorescence were separately imaged onto a fast CMOS camera to quantify FRET (see Methods). mCherry, whose quantum yield decreases linearly by 2.5%/°C between 20 and 60 °C (11), was excited by a yellow LED to serve as a thermometer for in vitro and in cell measurements (SI Appendix, Sec. 1). A thermochromic dye on microbeads can be substituted to provide a reference for accurate focusing and temperature calibration on the same slide.
Fig. 1.
Fast temperature stepping measurements in vitro. (A) Stepping the power of the 2,200 nm heating laser and, hence, the temperature (in red, measured using mCherry), yields donor (AcGFP1, green), and acceptor (mCherry, red) fluorescence intensity curves upon FRET-PGK unfolding. Heating to 80 °C (reached at 160 s before the temperature was returned to room temperature) causes some irreversible aggregation even on a 2.5 min time scale. (B) Fast temperature stepping (blue, < 2 min) and conventional stage heating (red, 90 min) produce similar melting temperatures, but fast stepping produces larger donor-acceptor ratios D/A due to reduced aggregation above 40 °C. The insets show ribbon structures of FRET-PGK folded and unfolded with fluorescent labels symbolized by green and red cylinders.
To measure protein thermodynamics in living cells with minimal disruption, we developed a fast temperature stepping method rather than heating the sample slide only resistively. A 2,200-nm wavelength infrared diode laser was focused by a 25 mm f.l. lens to a ≈1 mm diameter spot on the sample providing uniform heating over the field of view of a 40× microscope objective. The laser was computer-controlled to implement any desired power profile with ms time resolution for upward and downward jumps (limited by laser power, sample heat capacity, and sample heat conductivity). For fast thermodynamics measurements of FRET-PGK, the temperature profile was stepped with a few seconds of dwell time after each step to allow equilibration. Fig. 1A (Bottom) shows the resulting donor and acceptor fluorescence of FRET-PGK in vitro. Instead of simple steps, spiked power steps provided even faster settling of the temperature for thermodynamic and kinetic measurements (SI Appendix, Sec. 1).
Thermal Unfolding and Equilibrium Constant.
Fig. 1B shows the resulting donor-acceptor fluorescence intensity ratio D/A in vitro. The rapid stepping method reached higher D/A ratios upon unfolding than slow heating of the stage. We attribute this to less protein aggregation and, therefore, reduced intermolecular FRET (10) when heat exposure is minimized. Upon heating to 80 °C in 160 s (Fig. 1A), refolding was not fully reversible (baseline at 250 s has not returned to initial value). Staying below 50 °C (relevant in vivo) and using low excitation LED power yielded nearly reversible thermal scans with minimal chromophore bleaching (SI Appendix, Sec. 1). A two-state model (see Methods) fitted the sigmoid thermal unfolding curve within measurement uncertainty yielding an effective melting temperature Tm (SI Appendix, Table S1) and equilibrium constant Keq(T).
Folding and Unfolding Rate Coefficients.
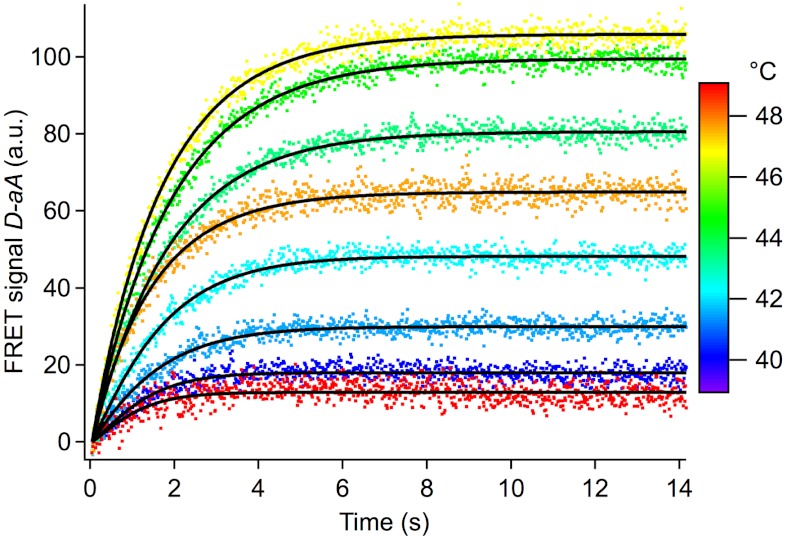
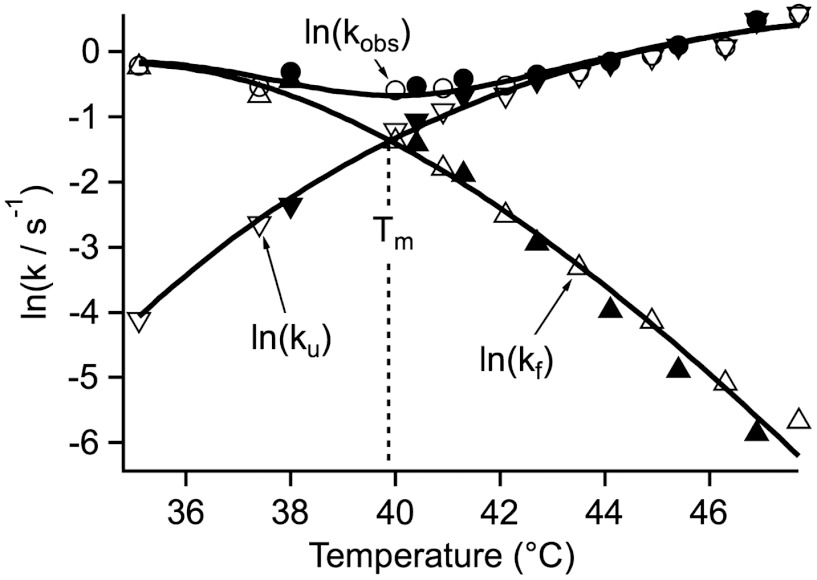
Relaxation kinetics was measured alone or together with thermodynamics using ms temperature steps of ca. 4 °C followed by a temperature plateau to allow equilibration. Fig. 2 shows a series of donor-acceptor fluorescence intensity difference traces D(t)-aA(t), linear in protein concentration (11) for FRET-PGK relaxation in a U2OS cell. All kinetic traces were corrected for a small amount of photobleaching (SI Appendix, Sec. 2) and then fitted to a stretched exponential function e-(kobst)b. Fig. 3 compares the observed rate coefficients kobs obtained by fitting two different sets of in vitro data to illustrate measurement reproducibility. The fitted values of b ranged from 0.7 to 0.9 in vitro and in vivo.
Fig. 2.
FRET-PGK folding/unfolding relaxation traces from cell (A) in Fig. 4. The color corresponds to the final temperature after a 4 °C T-jump. At low and high temperatures (blue and red traces), the kinetic amplitude is small. Near the thermal denaturation midpoint (yellow, green) the maximum kinetic amplitude is observed. A stretched exponential fit to this data yields the observed relaxation rate kobs. Chromophore bleaching was subtracted as a linear baseline fitted to the last 4 s of data.
Fig. 3.
Temperature dependence of the in vitro rate coefficients of FRET-PGK from two series of measurements (open and closed symbols). The solid lines are fits to the effective two-state model discussed in the text. The logarithm is the natural logarithm here and in Fig. 4.
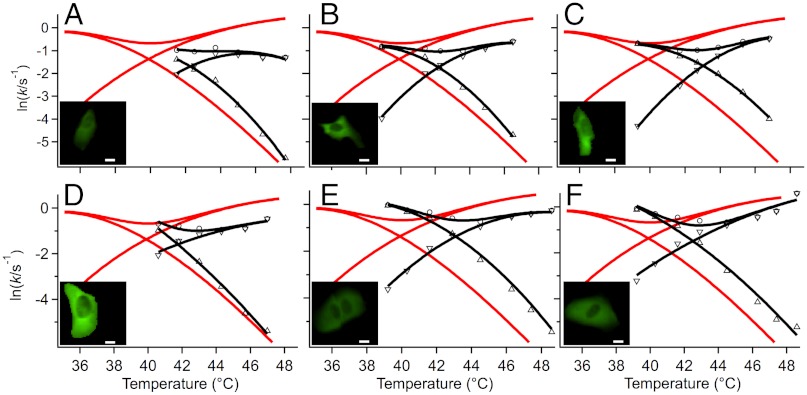
To calculate effective two-state unfolding and refolding rate coefficients ku and kf from kobs and Keq, we applied the two-state assumption Keq = kf/ku and kobs = kf + ku and discarded the information contained in b. Fig. 3 shows the in vitro rate coefficients that were also fitted to a two-state model (see Methods and SI Appendix, Sec. 2). Fig. 4 shows the in vivo rate coefficients together with two-state fits for six U2OS cells (A) through (F). SI Appendix, Sec. 3 lists all fitted two-state kinetic parameters. The most notable difference between the in cell and in vitro data is an upward shift of Tm by 2–3 °C and a two-fold decrease of the rate coefficients. The only other notable feature compared to in vitro is a slightly steeper slope/higher curvature of kf for cells (A), (B), (D) and (E). To facilitate comparison, all in vitro and in vivo data were collected in the same way and fitted to the same model.
Fig. 4.
Temperature dependence of the in vivo rate coefficients of FRET-PGK from cells (A) through (F) in black symbols. The solid black curves are fits to the effective two-state model discussed in the text. The solid red lines are the in vitro fits from Fig. 3 for comparison. The insets show cells (A–D) at room temperature on the same absolute intensity scale illustrating expression level, scale bar: 10 μm.
Hierarchical Free Energy Landscape.
Although an effective two-state model fits the thermal melts and rate coefficients well, PGK folding kinetics deviates from simple two-state behavior in vitro (12–14) and in vivo (10, 11). PGK folds through a hierarchical sequence of intermediates whose kinetic traces (Fig. 2) can be fitted within measurement uncertainty only by a stretched exponential function with β ≠ 1. β varies from 0.6 (in vitro) to 1 (in the endoplasmic reticulum) in the literature (11), and our current results fall within that range. The relative free energy of states populated during folding is thus sensitive to the cellular environment.
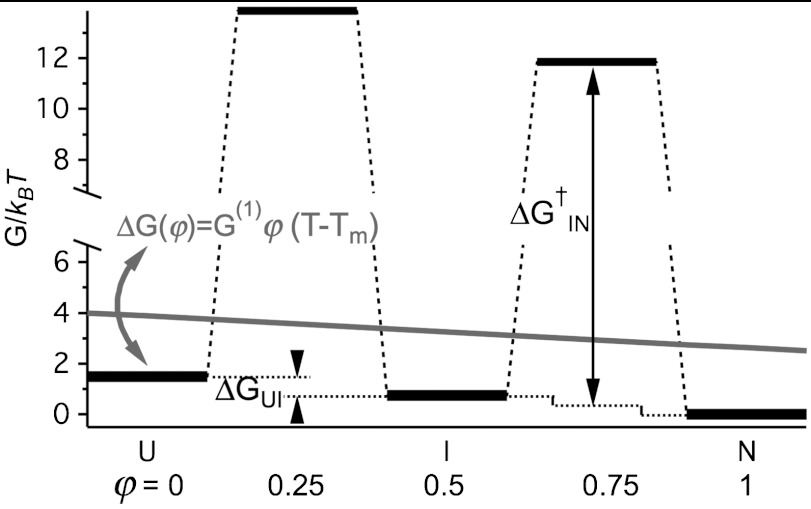
To validate the effective two-state model that yielded Tm, Keq(T), kf(T), and ku(T), we analyzed a minimalist three-state free energy landscape (FEL) of PGK. Fig. 5 illustrates the FEL: The free energy ΔG(φ) was a linear function of temperature and of the reaction coordinate φ according to the Hammond postulate (15). We assumed φ = 0 (unfolded state U), 0.25 (1st transition state), 0.5 (intermediate state I), 0.75 (2nd transition state), and 1 (native state N). Kinetics and thermodynamics of the FEL were solved by relaxing the three coupled differential equations for the concentrations [U], [I], and [N] (see Methods). The free energies and barrier heights of the FEL were adjusted so the FEL closely approximated the experimentally observed Keq, βand kobs. We then calculated kf and ku for the FEL and fitted them to the same effective two-state model as the experimental data. The two-state model provides an excellent fit of the FEL rate coefficients (Fig. 6). In particular, the effective two-state model Tm is within 0.2 °C of the temperature where ΔGNU of the three-state FEL equals zero. We expect that the melting temperature obtained by fitting the experimental data to the two-state model is also very close to the true melting temperature of FRET-PGK.
Fig. 5.
A three-state model that accounts for hierarchical (β < 1) folding of FRET-PGK and is used to validate the effective two-state model. The states N, I, and U have a linear dependence of free energy on the reaction coordinate j (gray slope) and temperature (arrow indicating tilt) given by the formula ΔG(φ) = G(1)φ(T - Tm). The free energy barriers are referenced to the average free energy of neighboring states as illustrated for  .
.
Fig. 6.
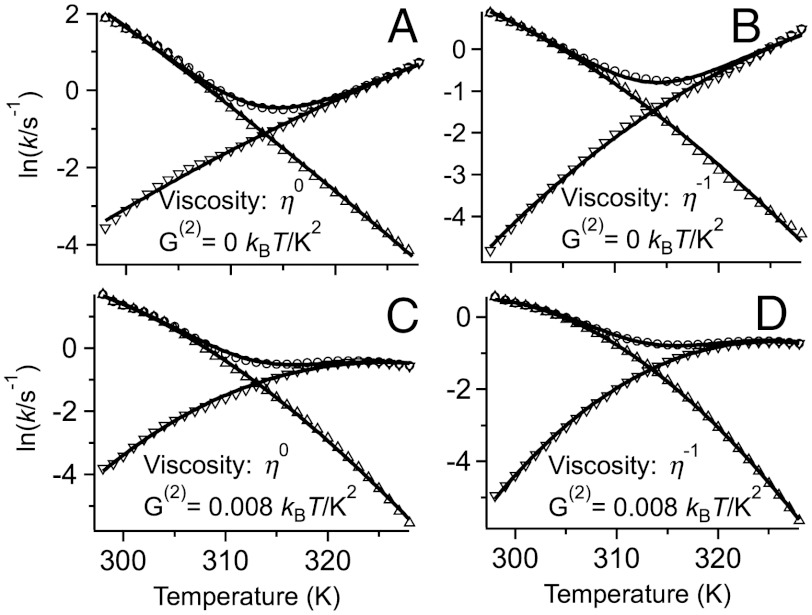
FEL simulated rate coefficients (symbols) fitted to the same effective two-state model (solid curves) as the experimental data. The FEL calculation included (η-1) or excluded (η0) the solvent viscosity dependence of the rate prefactor, and the activation free energies strictly obeyed the same Hammond’s principle as the U, I, and N state free energies (red free energy slope in Fig. 5) or had an added quadratic free energy term G(2).
The basic FEL did not incorporate solvent viscosity, and enforced a linear Hammond postulate for the transition states. As a result, it produces too deep a “vee” in kobs, and kf and ku are not sufficiently curved (compare Figs. 4 and 6A). Inclusion of a viscosity dependence η(T)-1 (Fig. 6B) or of a fractional viscosity dependence (SI Appendix, Sec. 4) improved the “vee” and curvature but it was not sufficient. T-jump experiments of small proteins in carbohydrate crowders have shown that folding rates cannot be understood just in terms of simple bulk viscosities (16). Inclusion of a quadratic term G(2)(T - Tm)2φ just for the free energy barriers did produce the correct “vee” and curvature compared to experiment (Fig. 6D). Physically, this corresponds to a different temperature dependence of the activation heat capacity  relative to the folding heat capacity ΔCp(T). As can be seen in Fig. 6, the effective two-state model fits the data from all FELs with very good accuracy.
Discussion
Evaluating ln(Keq) = ln(kf/ku) = ΔG/RT for each cell in Fig. 4 at the in vitro melting temperature of Tm ≈ 38.9 °C, we obtain  in vivo relative to in vitro. This is a relatively small modulation of the free energy by the cell, but it could have significant effects as we discuss later. There are a few other examples of cells modulating protein folding, structure, and function in a variety of ways following translation and posttranslational modification. Verkman (17) have shown that glycolytic pathway enzymes such as PGK diffuse much more slowly in the cell than do similar-sized proteins such as GFP. A possible explanation is clustering of enzymes for more efficient substrate processing. Models for such weak association above the quaternary structure level exist (18), but experimental data remains scarce. In cell NMR measurements show that a protein disordered in vitro can gain structure in the cell (19). Simulation, in-cell measurements and artificial crowder experiments are all consistent with a large shift of the PGK domain hinge equilibrium, producing a more compact and enzymatically active state in crowded solutions or in cells (6) (figure S2 in ref. 11).
The average stabilization of FRET-PGK observed here in the cytosol of six cells is only ΔTm = 2.6 °C. This is lower than predicted by the simplest coarse-grained models for packing fractions around 25–30% (20) but is in line with some crowding models that represent the protein at an atomistic level (21). NMR experiments have shown that protein crowders can even destabilize crowded proteins (22) presumably due to intermolecular interactions (e.g., electrostatics). It is clear that a quantitative theory of protein stability in the cytosol will have to include simple crowding and intermolecular interactions.
Viscosity effects are turning out to be equally subtle (16). We showed here that the standard Kramers viscosity scaling of h-1 helps correct our FEL, but what about the magnitude of the viscosity? Verkman’s results require a viscosity 20× higher than that of bulk water to explain slow spatial diffusion throughout the cell, whereas the modest decrease of intracellular folding rate coefficients in Fig. 4 indicates only a factor of two larger viscosity than in the bulk. (Cell-to-cell studies in ref. 7 propose that a change of folding activation energies inside the cell cannot account for the slower rates.) The effective viscosity is sensitive to the transport property being described (translational diffusion, formation of secondary structure, local chain diffusion to fold a protein, etc). Experimental data in cells is still scarce. It remains to be seen whether more meaningful quantities than viscosity alone (e.g., hydrodynamic effects) (23) must be developed to describe diffusion or anomalous diffusion in the interior of the cell.
The slightly more negative slope and larger curvature of log(kf) in some cells compared to in vitro (Fig. 4) is consistent with several hypotheses. Crowding and jamming could become less efficient when the temperature is raised. As a consequence, the unfolded state has more room and pays a smaller entropic penalty. The refolding rate would then decrease towards the in vitro rate, whereas the unfolding rate would track the in vivo rate. Cell (D) is a good example. Alternatively, the solvent viscosity may decrease less rapidly in vivo than in vitro when the temperature is raised. One then expects kf and ku to decrease relative to in vitro (intrinsic protein friction of course also plays a role) (24). Cell (A) is a good example. This scenario is plausible because the cytoplasmic viscosity is subject to hydrodynamic effects (23), and “biological” water has retarded dynamics out to several nm distances from protein surfaces (25). As a final alternative, hydrophobicity may increase more rapidly with temperature in cells than in vitro. This difference has two counterbalancing effects on folding. More hydrophobicity means more nonnative contacts reducing the prefactor k0 in the rate constant expression k = k0e-ΔG†/RT (as observed in vitro) (24, 26). At the same time, more hydrophobicity stabilizes the native state and decreases the activation free energy ΔG†. The right combination of these two factors could cause the opposite trend of kf and ku in vivo relative to in vitro. Cell (B) is a good example.
Given the range of behaviors observed in our sample of six cells, we suspect that all of these scenarios play a comparable role in vivo. It would be very interesting to see what coarse-grained simulations predict for the relative contributions of viscosity, hydrodynamics, crowding, and hydrophobicity (landscape roughness) to the folding kinetics temperature dependence. Although the free energy change of ∼2.3 RT that we see from in vitro to in vivo is small, it is worth reiterating that p1/p2 = exp[2.3] ≈ 10: pathway populations could be tuned by a factor of 10 in a two-state system. For intrinsically disordered or nearly disordered signaling proteins, or for fine control of enzymatic activity, such modulation of the free energy landscape could make an adaptive difference in a living cell. For example, a single Lys→His mutation in the human XPD helicase changes ATPase activity by only 10% and DNA binding affinity by only 50%, sufficient to cause Trichothiodystrophy (27).
Methods
Protein Expression.
The FRET-labeled protein was encoded in the pDream vector and expressed in E. coli as described previously (28). The His-tagged protein was purified on a Ni-NTA column and dialyzed against 50 mM phosphate buffer at pH 7. All in vitro measurements were performed with protein concentrations of 5–10 μM.
Live Cell Experiment.
The FRET-PGK plasmid was transfected and expressed in U2OS cells. Transfection was performed with lipofectamine for 6 h before the cells were split and grown on coverslips. Confluency was ≈80% before measurements. It is estimated that the in cell protein concentration reaches 100–150 μM at the time of imaging 20–25 h after transfection, typical of medium-abundance proteins in the cytosol (29).
Thermodynamic Fitting.
We use the fluorescence intensity ratio D/A, the scaled difference D-aA, or the FRET efficiency to characterize thermodynamics and kinetics with the advantages of each outlined in ref. 11. The thermal melts plotted as D(T)/A(T) were least-squares fitted to an effective two-state model (30)
 |
[1] |
Adjustable parameters were the folding enthalpy ΔH, folding entropy ΔS, folding heat capacity ΔCP, and melting temperature Tm. The constraint ΔG(Tm) = ΔH-TmΔS = 0 defined Tm as the melting temperature. Keq was used to calculate the model’s native state fractional population (SI Appendix, Sec. 2). That fraction was then used to fit the D/A signal as described in ref. 11. After the fit had converged, the final Keq(T) was further used for kinetic data analysis.
Temperature-Dependent Kinetics.
The in cell relaxation was measured at 16 temperatures from room temperature to 50 °C. The kinetic amplitude as a function of temperature reaches a maximum near Tm that can be used to obtain Tm directly from kinetics (31). The resulting Tm is similar to that obtained from fast-step thermodynamics. Only ≈8 measurements around Tm had enough kinetic amplitudes for data analysis. The normalized difference D(t)-aA(t) between the donor and acceptor fluorescence intensities (Fig. 2) was fitted to stretched exponentials at each temperature (11). The optimal choice of the constant a to yield the highest signal-to-noise ratio depends on the temperature-dependent relative quantum yields of donor and acceptor and on the sensitivity of the optical system to the green and red fluorescence (11), but it does not affect the fitted kobs or β values outside measurement uncertainty. kobs and Keq were combined to obtain ku and kf and fitted to a kinetic two-state model analogous to the thermodynamic two-state model in Eq. 1 (SI Appendix, Sec. 2).
Free Energy Landscape Simulation.
The FEL kinetics was simulated from 298 K to 328 K in a range of ± 15 K around the melting temperature. The barrier heights had an optional quadratic temperature dependence (SI Appendix, Sec. 4). At each temperature simulated, the initial concentrations in the three states were set to their equilibrium values at 4 K below the simulation temperature, which is the size of the temperature jump in the experiment. Relaxation towards the equilibrium state was calculated by solving
 |
[2] |
Rate coefficients were calculated as kXY = k0e-(ΔGXY+ΔGXY/2)/RT and kYX = k0e-(ΔGXY-ΔGXY/2)/RT. The prefactor k0 was held constant at the previously measured U↔U’ relaxation rate of 105 s-1 of wild type yeast PGK (12) or allowed to vary with viscosity as η-γ (SI Appendix, Sec. 4).
To compute kinetic traces from the concentrations, the following FRET efficiencies E were used. The measured FRET efficiencies of the N and U states are ≈0.14 and ≈0.25. These values are a combination of actual FRET efficiency, quantum yield, and camera response. The FRET efficiency of state I was assumed to be ≈0.195. Relative donor and acceptor intensities D and A can be calculated from E = A/(A + D). Total FRET intensities D or A were calculated by summing U, I, and N intensities weighted by their respective concentrations. The calculated FRET signals as a function of time were fitted to stretched exponentials and then fitted by the same effective two-state model as the experimental data.
Supplementary Material
ACKNOWLEDGMENT.
This work was supported by the National Science Foundation grant MCB 1019958.
Footnotes
The authors declare no conflict of interest.
This article is a PNAS Direct Submission.
This article contains supporting information online at www.pnas.org/lookup/suppl/doi:10.1073/pnas.1201797109/-/DCSupplemental.
References
- 1.Duan Y, Kollman PA. Pathways to a protein folding intermediate observed in a 1-microsecond simulation in aqueous solution. Science. 1998;282:740–744. doi: 10.1126/science.282.5389.740. [DOI] [PubMed] [Google Scholar]
- 2.Snow CD, Nguyen H, Pande V, Gruebele M. Absolute comparison of simulated and experimental protein folding dynamics. Nature. 2002;420:102–106. doi: 10.1038/nature01160. [DOI] [PubMed] [Google Scholar]
- 3.Lindorff-Larsen K, Piana S, Dror RO, Shaw DE. How fast-folding proteins fold. Science. 2011;334:517–520. doi: 10.1126/science.1208351. [DOI] [PubMed] [Google Scholar]
- 4.van den Berg B, Wain R, Dobson CM, Ellis RJ. Macromolecular crowding perturbs protein refolding kinetics; implications for folding inside the cell. EMBO J. 2000;19:3870–3875. doi: 10.1093/emboj/19.15.3870. [DOI] [PMC free article] [PubMed] [Google Scholar]
- 5.Homouz D, Stagg L, Wittung-Stafshede P, Cheung MS. Macromolecular crowding modulates folding mechanism of alpha/beta protein apoflavodoxin. Biophys J. 2009;96:671–680. doi: 10.1016/j.bpj.2008.10.014. [DOI] [PMC free article] [PubMed] [Google Scholar]
- 6.Dhar A, et al. Structure, function, and folding of phosphoglycerate kinase are strongly perturbed by macromolecular crowding. Proc Natl Acad Sci USA. 2010;107:17586–17591. doi: 10.1073/pnas.1006760107. [DOI] [PMC free article] [PubMed] [Google Scholar]
- 7.Dhar A, Ebbinghaus S, Shen Z, Mishra T, Gruebele M. The diffusion coefficient for PGK folding in eukaryotic cells. Biophys J. 2010;99:L69–L71. doi: 10.1016/j.bpj.2010.08.066. [DOI] [PMC free article] [PubMed] [Google Scholar]
- 8.Bryngelson JD, Onuchic JN, Socci ND, Wolynes PG. Funnels, pathways, and the energy landscape of protein folding: A synthesis. Protein Struct Funct Gene. 1995;21:167–195. doi: 10.1002/prot.340210302. [DOI] [PubMed] [Google Scholar]
- 9.Ebbinghaus S, Gruebele M. Protein folding landscapes in the living cell. J Phys Chem Lett. 2011;2:314–319. [Google Scholar]
- 10.Ebbinghaus S, Dhar A, McDonald JD, Gruebele M. Protein folding stability and dynamics imaged in a living cell. Nat Methods. 2010;7:319–323. doi: 10.1038/nmeth.1435. [DOI] [PubMed] [Google Scholar]
- 11.Dhar A, et al. Protein stability and folding kinetics in the nucleus and endoplasmic reticulum of eucaryotic cells. Biophys J. 2011;101:421–430. doi: 10.1016/j.bpj.2011.05.071. [DOI] [PMC free article] [PubMed] [Google Scholar]
- 12.Sabelko J, Ervin J, Gruebele M. Observation of strange kinetics in protein folding. Proc Nat Acad Sci USA. 1999;96:6031–6036. doi: 10.1073/pnas.96.11.6031. [DOI] [PMC free article] [PubMed] [Google Scholar]
- 13.Osvath S, Herenyi L, Zavodszky P, Fidy J, Kohler G. Hierarchic finite level energy landscape model—To describe the refolding kinetics of phosphoglycerate kinase. J Biol Chem. 2006;281:24375–24380. doi: 10.1074/jbc.M601915200. [DOI] [PubMed] [Google Scholar]
- 14.Osváth S, Sabelko J, Gruebele M. Tuning the heterogeneous early folding dynamics of phosphoglycerate kinase. J Mol Biol. 2003;333:187–199. doi: 10.1016/j.jmb.2003.08.011. [DOI] [PubMed] [Google Scholar]
- 15.Fersht AR. Structure and Mechanism in Protein Science: A Guide to Enzyme Catalysis and Protein Folding. New York: W.H. Freeman; 1999. [Google Scholar]
- 16.Mukherjee S, Waegele MM, Chowdhury P, Guo L, Gai F. Effect of macromolecular crowding on protein folding dynamics at the secondary structure level. J Mol Biol. 2009;393:227–236. doi: 10.1016/j.jmb.2009.08.016. [DOI] [PMC free article] [PubMed] [Google Scholar]
- 17.Verkman AS. Solute and macromolecule diffusion in cellular aqueous compartments. Trends Biochem Sci. 2002;27:27–33. doi: 10.1016/s0968-0004(01)02003-5. [DOI] [PubMed] [Google Scholar]
- 18.Minton AP. Influence of macromolecular crowding upon the stability and state of association of proteins: Predictions and observations. J Pharmceut Sci. 2005;94:1668–1675. doi: 10.1002/jps.20417. [DOI] [PubMed] [Google Scholar]
- 19.Dedmon MM, Patel CN, Young GB, Pielak GJ. FlgM gains structure in living cells. Proc Nat Acad Sci USA. 2002;99:12681–12684. doi: 10.1073/pnas.202331299. [DOI] [PMC free article] [PubMed] [Google Scholar]
- 20.Cheung MS, Klimov D, Thirumalai D. Molecular crowding enhances native state stability and refolding rates of globular proteins. Proc Nat Acad Sci USA. 2005;102:4753–4758. doi: 10.1073/pnas.0409630102. [DOI] [PMC free article] [PubMed] [Google Scholar]
- 21.Qin SB, Zhou H-X. Atomistic modeling of macromolecular crowding predicts modest increases in protein folding and binding stability. Biophys J. 2009;97:12–19. doi: 10.1016/j.bpj.2009.03.066. [DOI] [PMC free article] [PubMed] [Google Scholar]
- 22.Miklos AC, Sarkar M, Wang YQ, Pielak GJ. Protein crowding tunes protein stability. J Am Chem Soc. 2011;133:7116–7120. doi: 10.1021/ja200067p. [DOI] [PubMed] [Google Scholar]
- 23.Ando T, Skolnick J. Crowding and hydrodynamic interactions likely dominate in vivo macromolecular motion. Proc Nat Acad Sci USA. 2010;107:18457–18462. doi: 10.1073/pnas.1011354107. [DOI] [PMC free article] [PubMed] [Google Scholar]
- 24.Cellmer T, Henry ER, Hofrichter J, Eaton WA. Measuring internal friction of an ultrafast-folding protein. Proc Nat Acad Sci USA. 2008;105:18320–18325. doi: 10.1073/pnas.0806154105. [DOI] [PMC free article] [PubMed] [Google Scholar]
- 25.Ebbinghaus S, et al. An extended dynamical hydration shell around proteins. Proc Nat Acad Sci USA. 2007;104:20749–20752. doi: 10.1073/pnas.0709207104. [DOI] [PMC free article] [PubMed] [Google Scholar]
- 26.Liu F, Gruebele M. The transition state transit time of WW domain folding is controlled by energy landscape roughness. J Chem Phys. 2009;131:195101. doi: 10.1063/1.3262489. [DOI] [PubMed] [Google Scholar]
- 27.Fan L, et al. XPD helicase structures and activities: Insights into the cancer and aging phenotypes from XPD mutations. Cell. 2008;133:789–800. doi: 10.1016/j.cell.2008.04.030. [DOI] [PMC free article] [PubMed] [Google Scholar]
- 28.Dhar A, Gruebele M. Fast relaxation imaging in living cells. Curr Protoc Prot Sci. 2011:28.1.1–28.2.19. doi: 10.1002/0471140864.ps2801s65. Unit 28.1. [DOI] [PubMed] [Google Scholar]
- 29.Ghaemmaghami S, et al. Global analysis of protein expression in yeast. Nature. 2003;425:737–741. doi: 10.1038/nature02046. [DOI] [PubMed] [Google Scholar]
- 30.Privalov PL, Gill SJ. Stability of protein structure and hydrophobic interaction. Adv Protein Chem. 1988;39:191–234. doi: 10.1016/s0065-3233(08)60377-0. [DOI] [PubMed] [Google Scholar]
- 31.Girdhar K, Scott G, Chemla YR, Gruebele M. Better biomolecule thermodynamics from kinetics. J Chem Phys. 2011;135:015102. doi: 10.1063/1.3607605. [DOI] [PubMed] [Google Scholar]
Associated Data
This section collects any data citations, data availability statements, or supplementary materials included in this article.


