

Abstract

Protein dynamics on the micro- to millisecond time scale is increasingly found to be critical for biological function, as demonstrated by numerous NMR relaxation dispersion studies. Methyl groups are excellent probes of protein interactions and dynamics because of their favorable NMR relaxation properties, which lead to sharp signals in the 1H and 13C NMR spectra. Out of the six different methyl-bearing amino acid residue types in proteins, methionine plays a special role because of its extensive side-chain flexibility and the high polarizability of the sulfur atom. Methionine is over-represented in many protein–protein recognition sites, making the methyl group of this residue type an important probe of the relationships among dynamics, interactions, and biological function. Here we present a straightforward method to label methionine residues with specific 13CHD2 methyl isotopomers against a deuterated background. The resulting protein samples yield NMR spectra with improved sensitivity due to the essentially 100% population of the desired 13CHD2 methyl isotopomer, which is ideal for 1H and 13C spin relaxation experiments to investigate protein dynamics in general and conformational exchange in particular. We demonstrate the approach by measuring 1H and 13C CPMG relaxation dispersion for the nine methionines in calcium-free calmodulin (apo-CaM). The results show that the C-terminal domain, but not the N-terminal domain, of apo-CaM undergoes fast exchange between the ground state and a high-energy state. Since target proteins are known to bind specifically to the C-terminal domain of apo-CaM, we speculate that the high-energy state might be involved in target binding through conformational selection.
Conformational transitions are directly connected to protein function, as demonstrated by numerous reports employing powerful NMR relaxation dispersion methods to characterize enzyme catalysis or ligand binding.1−5 Transitions between different conformational substates commonly modulate NMR parameters, notably the chemical shift6 and residual dipolar couplings,7,8 resulting in exchange contributions to the transverse relaxation rates. The exchange correlation times of functionally important processes in proteins often range from microseconds to milliseconds, which can be measured by R1ρ(9) or Carr–Purcell–Meiboom–Gill (CPMG) experiments10,11 and improved variants thereof.12−14 A great advantage of these experiments is that they can provide simultaneous measurement of the exchange rate, kex, the relative populations of the exchanging states, pi, and the chemical shift difference between them, Δδ. Hence, information on the kinetics/dynamics, thermodynamics, and structural change for a given process can be obtained in a single experiment.15,16
Experiments have been designed to probe conformational exchange at specific sites in proteins, including backbone9,12−14,17−22 and side-chain Cβ,23 carbonyl/carboxyl,24 methyl,25−29 and aromatic groups.30 Of these, the methyl-based experiments are arguably the most sensitive because of the favorable relaxation properties associated with fast rotation around the threefold symmetry axis. The inherently slow relaxation of methyl spins implies that exchange effects can make relatively large contributions to the effective relaxation rates.
Methionine is overrepresented in protein–protein interfaces relative to its frequency of occurrence on the solvent-accessible surface of protein complexes.31 The resulting enrichment of Met at protein recognition sites is the third highest of any amino acid residue, after Trp and Tyr. The long and flexible side chain of Met confers significant conformational adaptability to binding sites,32 and the high polarizability of the sulfur atom promotes versatile nonpolar interactions.33 For these reasons, it is believed that Met-rich regions play an important role in mediating promiscuous binding to a range of targets. A case in point is calmodulin (CaM), which binds more than 300 different proteins using essentially the same binding site, of which Met residues constitute nearly 50% of the hydrophobic surface area.34 Thus, there is great incentive to use Met to probe the role of conformational dynamics in protein recognition.35−37
Here we present an improved isotope labeling scheme for Met residues in proteins. Our method is based on a straightforward protocol that yields protein samples with essentially 100% incorporation of the 13CHD2 isotopomer in the Met methyl groups (Figure 1) and complete deuteration of the remaining side-chain hydrogens, as verified by 1H NMR analysis (data not shown). The resulting isotope labeling pattern is optimal for 1H and 13C relaxation dispersion experiments applied to methyl groups.27−29,38 Furthermore, it eliminates potential problems associated with long-range 1H–1H or 1H–13C scalar couplings (e.g., 4JHH or 3JHC) and intraresidue cross-relaxation between protons, which can otherwise become significant during long relaxation delays. The essentially complete incorporation of the 13CHD2 isotopomer in Met residues increases the sensitivity of these experiments by a factor of ∼3 relative to that reached for samples expressed in media containing 1H,13C-glucose and 100% D2O.38,39 The use of 13CHD2 methyl groups has been shown to yield sufficient sensitivity to allow for relaxation experiments on quite large systems, such as the 20S proteasome (670 kDa),40,41 providing further motivation for the present development. The labeling method is very flexible and can be combined with various complementary isotope enrichment schemes, permitting, for example, simultaneous labeling of Val, Leu, and Ile with 13CHD2 methyls42 or a background of natural-abundance carbon isotope distribution, perdeuteration, and 15N enrichment as implemented here.
Figure 1.

1H–13C correlation spectra of a 1 mM sample of apo-CaM specifically labeled with 12CαH(12CD2)2S13CHD2-Met. (a) 1H–13C heteronuclear single-quantum coherence (HSQC) spectrum showing the full spectral range expected for methyl groups and the majority of aliphatic side-chain positions. (b) Close-up view of the Met methyl region in a 13C CPMG relaxation dispersion experiment. The lowest contour is drawn at a level equal to 5 times the root-mean-square deviation of the base plane.
Isotopomer-specific labeling of CaM was achieved by adding isotopomer-specific Met (100 mg/L) to 99.9% D2O M9 medium containing 15NH4Cl (0.5 g/L) and either non-isotope-enriched glucose or (1,2,3,4,5,6,6)-2H7-glucose (4 g/L) ∼1 h prior to induction with isopropyl β-d-1-thiogalactopyranoside (IPTG).4312CαH(12CD2)2S13CHD2-Met (denoted D-Met) was synthesized from 13CHD2-methyl iodide (Cambridge Isotope Laboratories) and (3,3,3′,3′,4,4,4′,4′-D8)-dl-homocystine (Cambridge Isotopes) using established procedures.43,4412CαH(12CH2)2S13CHD2-Met (denoted H-Met) was synthesized in the same manner using nondeuterated dl-homocystine. The four different samples allowed for comparative investigations of the effects of long-range scalar couplings and intra- or inter-residue cross-relaxation among protons.
We characterized Met side-chain dynamics of the 13CHD2-methyl-labeled apo-CaM samples using 1H and 13C CPMG relaxation dispersion experiments similar to published work [see Supporting Information (SI) Figure 1].28,29,45 In short, the pulse sequences used here differed from the previously reported ones by incorporating a relaxation–compensation scheme to average the relaxation of in-phase and antiphase coherences.12 Furthermore, the 13C experiment included deuterium decoupling during the longer echoes (τCP ≥ 2.5 ms, corresponding to νCP ≤ 100 Hz), which was necessary to prevent the buildup of density operator elements that decay rapidly as a result of scalar relaxation of the second kind,46 as illustrated in SI Figure 2. In the case of shorter echo delays (τCP ≤ 2.5 ms; νCP > 100 Hz), the 13C 180° pulses of the CPMG train served to maintain the 13C magnetization essentially in-phase with respect to deuterium, thereby making deuterium decoupling unnecessary.
CaM contains nine methionines, all of which give rise to well-resolved cross-peaks in the 1H–13C correlation spectrum (Figure 1). Only a single methyl isotopomer (13CHD2) was observed, verifying that the incorporation of 13CH2D or 13CH3 isotopomers was undetectably low. Furthermore, the near absence of other cross-peaks in the aliphatic side-chain region of the spectrum indicated that metabolic scrambling was insignificant with the present expression protocol.
Figure 2 shows 1H and 13C CPMG relaxation dispersion curves for the Met methyl groups in the C-terminal domain of apo-CaM, all of which exhibited significant conformational exchange. By contrast, the Met methyls in the N-terminal domain generally had insignificant relaxation dispersion amplitudes [R2eff(ν→0) – R2eff(ν→∞) < 0.5 s–1; SI Figures 3 and 4]. These results are in agreement with previous studies based on 15N relaxation, which also identified widespread conformational exchange in the C-terminal domain of apo-CaM,47,48 while the N-terminal domain showed much less exchange.
Figure 2.
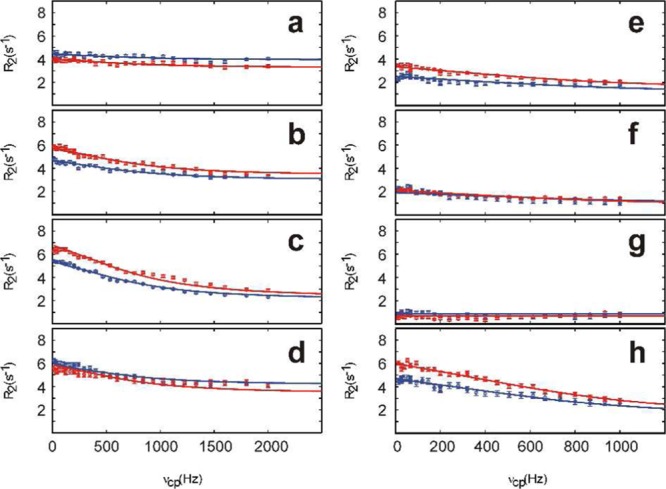
Representative (a–d) 1H and (e–h) 13C methyl CPMG relaxation dispersion profiles acquired on a 1 mM sample of apo-CaM specifically labeled with 12CαH(12CD2)2S13CHD2-Met at static magnetic field strengths of 11.7 T (blue) and 14.1 T (red) and a temperature of 25 °C. The solid lines represent the best simultaneous fits of a global two-state model to the data at both static magnetic fields for each residue, from which the values kex = 4770 ± 147 s–1 and pm = 0.7 ± 0.1% were obtained. The best-fit values of ΔδH were (a) M109, 0.18 ± 0.01 ppm; (b) M124, 0.34 ± 0.01 ppm; (c) M144, 0.48 ± 0.01 ppm; and (d) M145, 0.34 ± 0.01 ppm. The best-fit ΔδC values were (e) M109, 0.84 ± 0.01 ppm; (f) M124, 0.67 ± 0.01 ppm; (g) M144, 0.01 ± 0.01 ppm; and (h) M145, 1.33 ± 0.01 ppm.
The 13CHD2 isotopomer is characterized by slow transverse relaxation rates for both the 1H and 13C spins, making it possible to measure, for both types of nuclei, quite small exchange contributions [R2eff(ν→0) – R2eff(ν→∞) ≈ 1–2 s–1], which in some cases still account for a significant fraction (up to 50%) of R2eff(ν→0) (see Figure 2). Furthermore, the D-Met labeling scheme reduced the transverse relaxation rates of the 1H spin by ∼30% relative to those measured for the H-Met sample (SI Figure 3). This reduction in R2eff(ν→∞) can be critical in experiments targeting systems with high molecular weights. By contrast, increasing the level of deuteration beyond ∼70% (as achieved by using deuterated glucose in the growth medium) at sites other than the Met side chain appears to have only marginal effects on the CPMG experiments (data not shown). The D-Met sample also reduces potential artifacts in the 1H CPMG experiment by eliminating 4JHH couplings, which can otherwise lead to Hartmann–Hahn effects at higher refocusing rates and longer relaxation delays (SI Figure 3). Similarly, D-Met labeling eradicates 3JHC couplings, which can potentially result in adverse effects in the 13C CPMG experiment, since this experiment is not relaxation-compensated with respect to these couplings. While the effects of these interactions are typically minor, the high sensitivity of CPMG experiments applied to 13CHD2 isotopomers allows for very precise measurements using long relaxation delays, and it is therefore desirable to reduce these potential artifacts by fully deuterating the Met side chain. Thus, D-Met labeling achieves enhanced sensitivity as well as improved accuracy.
The benefits of performing complementary 1H and 13C CPMG relaxation experiments are illustrated by Figure 2: for some methyl groups, the 13C relaxation dispersions were flat while the 1H experiments resulted in sizable dispersions, and vice versa. Thus, the 13CHD2 labeling scheme provides a convenient dual probe of Met methyl dynamics.28
We performed simultaneous fits of a two-state exchange model49,50 to the dispersion curves obtained at static magnetic field strengths of 11.7 and 14.1 T. Initial residue-specific fits revealed that residues located in the C-terminal domain have similar exchange correlation times. Subsequently, a global fit of the 1H CPMG dispersions for all of the Met methyl groups in the C-terminal domain resulted in a conformational exchange rate of kex = 4770 ± 147 s–1 and a minor-state population of pm = 0.7 ± 0.1%. As evident from Figure 2, the higher refocusing frequencies achieved in the 1H experiment resulted in improved sampling of the dispersion profile, including the plateau region that defines R2eff(ν→∞). Consequently, we first fitted the 1H dispersions to determine kex, pm, and the 1H chemical shift differences between exchanging states, ΔδH. In a second step, the ΔδC values were determined by fitting the 13C dispersions while keeping kex and pm fixed to the best-fit values obtained from the 1H dispersions. The resulting parameters yielded satisfactory fits to all four experimental data sets (Figure 2).
The extracted 1H and 13C chemical shift differences were in the ranges 0.18–0.48 and 0.1–1.33 ppm, respectively (Figure 3). By comparison, the standard deviations of Met methyl chemical shifts listed in the BioMagResBank52 are 0.46 (1H) and 1.59 (13C) ppm, suggesting that sizable relaxation dispersion amplitudes can be expected for Met methyl groups that exchange between different conformational environments.
Figure 3.
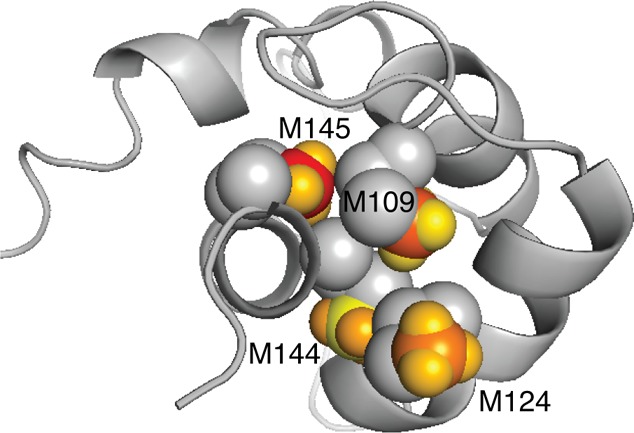
Location of the exchanging Met side chains (space-filling representation) in the structure of the apo-CaM C-terminal domain51 (backbone ribbon representation). The chemical shift differences between the exchanging conformations are color-coded onto the Met methyl groups. C and H atoms are color-coded separately to reflect ΔδC and ΔδH, respectively. The color scale is the same for 13C and 1H and runs from yellow for the lowest value, ΔδC(M144) = 0.1 ppm, to red for the highest value, ΔδC(M145) = 1.33 ppm.
It is of interest to interpret the present results in terms of what is known about the conformational flexibility of apo-CaM. It has been shown that apo-CaM samples compact structures (5–10% relative population) in which the two domains are in close proximity.53 We believe it to be unlikely that the exchange reported herein is related to the formation of these transient, compact structures because domain–domain contacts would be expected to affect both the N- and C-terminal domains, whereas the present experiments detected exchange in the C-terminal domain only. Thus, it appears more likely that the observed exchange relates to conformational changes within the C-terminal domain, in keeping with previous observations.47,48 Notably, it has been observed that some target peptides bind selectively to the C-terminal domain of apo-CaM, while there are no known examples of target binding to its N-terminal domain. In the target-bound state, apo-CaM adopts a semi-open conformation, as exemplified by complexes with the calponin homology domain of the smoothelin-like 1 protein,54 the CaM-binding domain of cyclic nucleotide phosphodiesterase,55 neuronal voltage-dependent sodium channels,56,57 the metabotropic glutamate receptor subtype 7,58 and PEP-19.59 These examples of domain-specific responses are in general agreement with our present observations, possibly suggesting that the minor conformation of the C-terminal domain of apo-CaM might be important for this type of target recognition through conformational selection.
In summary, we have presented an improved isotopomer-specific labeling method for Met methyl groups and demonstrated its use for measuring exchange processes in proteins by 1H and 13C CPMG relaxation dispersion experiments. The present method promotes studies of the conformational dynamics of Met side chains, which form an important component of many protein recognition sites.
Acknowledgments
We dedicate this paper to the memory of Deane D. McIntyre. This research was supported by the Swedish Research Council (621-2010-4912; 822-2005-2915), the Göran Gustafsson Foundation for Research in Natural Sciences and Medicine, the Knut and Alice Wallenberg Foundation, and the Canadian Institutes of Health Research. H.J.V. holds a Scientist Award from Alberta Innovates Health Solutions. U.W. was supported by an EMBO long-term fellowship.
Supporting Information Available
Pulse sequences of the 1H and 13C rc-CPMG experiments used herein for 13CHD2 methyl groups; effects of deuterium decoupling during the 13C CPMG experiment; and relaxation dispersion curves for 1H and 13C, respectively, for all nine Mets in H-Met and D-Met apo-CaM. This material is available free of charge via the Internet at http://pubs.acs.org.
The authors declare no competing financial interest.
Author Status
† Deceased.
Supplementary Material
References
- Eisenmesser E. Z.; Bosco D. A.; Akke M.; Kern D. Science 2002, 295, 1520. [DOI] [PubMed] [Google Scholar]
- Cole R.; Loria J. P. Biochemistry 2002, 41, 6072. [DOI] [PubMed] [Google Scholar]
- Sprangers R.; Gribun A.; Hwang P. M.; Houry W. A.; Kay L. E. Proc. Natl. Acad. Sci. U.S.A. 2005, 102, 16678. [DOI] [PMC free article] [PubMed] [Google Scholar]
- Boehr D. D.; McElheny D.; Dyson H. J.; Wright P. E. Science 2006, 313, 1638. [DOI] [PubMed] [Google Scholar]
- Brüschweiler S.; Schanda P.; Kloiber K.; Brutscher B.; Kontaxis G.; Konrat R.; Tollinger M. J. Am. Chem. Soc. 2009, 131, 3063. [DOI] [PubMed] [Google Scholar]
- Gutowsky H. S.; Saika A. J. Chem. Phys. 1953, 21, 1688. [Google Scholar]
- Igumenova T. I.; Brath U.; Akke M.; Palmer A. G. J. Am. Chem. Soc. 2007, 129, 13396. [DOI] [PMC free article] [PubMed] [Google Scholar]
- Vallurupalli P.; Hansen D. F.; Stollar E.; Meirovitch E.; Kay L. E. Proc. Natl. Acad. Sci. U.S.A. 2007, 104, 18473. [DOI] [PMC free article] [PubMed] [Google Scholar]
- Akke M.; Palmer A. G. J. Am. Chem. Soc. 1996, 118, 911. [Google Scholar]
- Carr H. Y.; Purcell E. M. Phys. Rev. 1954, 94, 630. [Google Scholar]
- Meiboom S.; Gill D. Rev. Sci. Instrum. 1958, 29, 688. [Google Scholar]
- Loria J. P.; Rance M.; Palmer A. G. J. Am. Chem. Soc. 1999, 121, 2331. [Google Scholar]
- Loria J. P.; Rance M.; Palmer A. G. J. Biomol. NMR 1999, 15, 151. [DOI] [PubMed] [Google Scholar]
- Igumenova T. I.; Palmer A. G. J. Am. Chem. Soc. 2006, 128, 8110. [DOI] [PubMed] [Google Scholar]
- Akke M. Curr. Opin. Struct. Biol. 2002, 12, 642. [DOI] [PubMed] [Google Scholar]
- Mittermaier A.; Kay L. E. Science 2006, 312, 224. [DOI] [PubMed] [Google Scholar]
- Hill R. B.; Bracken C.; DeGrado W. F.; Palmer A. G. J. Am. Chem. Soc. 2000, 122, 11610. [Google Scholar]
- Mulder F. A. A.; Akke M. Magn. Reson. Chem. 2003, 41, 853. [Google Scholar]
- Lundström P.; Akke M. J. Biomol. NMR 2005, 32, 163. [DOI] [PubMed] [Google Scholar]
- Lundström P.; Akke M. ChemBioChem 2005, 6, 1685. [DOI] [PubMed] [Google Scholar]
- Lundström P.; Hansen D. F.; Kay L. E. J. Biomol. NMR 2008, 42, 35. [DOI] [PubMed] [Google Scholar]
- Lundström P.; Hansen D. F.; Vallurupalli P.; Kay L. E. J. Am. Chem. Soc. 2009, 131, 1915. [DOI] [PubMed] [Google Scholar]
- Lundström P.; Lin H.; Kay L. E. J. Biomol. NMR 2009, 44, 139. [DOI] [PubMed] [Google Scholar]
- Hansen A. L.; Kay L. E. J. Biomol. NMR 2011, 50, 347. [DOI] [PubMed] [Google Scholar]
- Mulder F. A. A.; Hon B.; Mittermaier A.; Dahlquist F. W.; Kay L. E. J. Am. Chem. Soc. 2002, 124, 1443. [DOI] [PubMed] [Google Scholar]
- Korzhnev D. M.; Kloiber K.; Kanelis V.; Tugarinov V.; Kay L. E. J. Am. Chem. Soc. 2004, 126, 3964. [DOI] [PubMed] [Google Scholar]
- Brath U.; Akke M.; Yang D.; Kay L. E.; Mulder F. A. A. J. Am. Chem. Soc. 2006, 128, 5718. [DOI] [PubMed] [Google Scholar]
- Baldwin A. J.; Religa T. L.; Hansen D. F.; Bouvignies G.; Kay L. E. J. Am. Chem. Soc. 2010, 132, 10992. [DOI] [PubMed] [Google Scholar]
- Otten R.; Villali J.; Kern D.; Mulder F. A. A. J. Am. Chem. Soc. 2010, 132, 17004. [DOI] [PMC free article] [PubMed] [Google Scholar]
- Weininger U.; Respondek M.; Akke M. J. Biomol. NMR 2012, 54, 9. [DOI] [PMC free article] [PubMed] [Google Scholar]
- Lo Conte L.; Chothia C.; Janin J. J. Mol. Biol. 1999, 285, 2177. [DOI] [PubMed] [Google Scholar]
- Scouras A. D.; Daggett V. Protein Sci. 2011, 20, 341. [DOI] [PMC free article] [PubMed] [Google Scholar]
- Gellman S. H. Biochemistry 1991, 30, 6633. [DOI] [PubMed] [Google Scholar]
- Yamniuk A. P.; Vogel H. J. Mol. Biotechnol. 2004, 27, 33. [DOI] [PubMed] [Google Scholar]
- Zhang M. J.; Vogel H. J. J. Mol. Biol. 1994, 239, 545. [DOI] [PubMed] [Google Scholar]
- Siivari K.; Zhang M. J.; Palmer A. G.; Vogel H. J. FEBS Lett. 1995, 366, 104. [DOI] [PubMed] [Google Scholar]
- Yamniuk A. P.; Ishida H.; Lippert D.; Vogel H. J. Biophys. J. 2009, 96, 1495. [DOI] [PMC free article] [PubMed] [Google Scholar]
- Lundström P.; Teilum K.; Carstensen T.; Bezsonova I.; Wiesner S.; Hansen F.; Religa T. L.; Akke M.; Kay L. E. J. Biomol. NMR 2007, 38, 199. [DOI] [PubMed] [Google Scholar]
- Otten R.; Chu B.; Krewulak K. D.; Vogel H. J.; Mulder F. A. A. J. Am. Chem. Soc. 2010, 132, 2952. [DOI] [PubMed] [Google Scholar]
- Religa T. L.; Kay L. E. J. Biomol. NMR 2010, 47, 163. [DOI] [PubMed] [Google Scholar]
- Sprangers R.; Kay L. E. Nature 2007, 445, 618. [DOI] [PubMed] [Google Scholar]
- Ollerenshaw J. E.; Tugarinov V.; Skrynnikov N. R.; Kay L. E. J. Biomol. NMR 2005, 33, 25. [DOI] [PubMed] [Google Scholar]
- Gifford J. L.; Ishida H.; Vogel H. J. J. Biomol. NMR 2011, 50, 71. [DOI] [PubMed] [Google Scholar]
- Melville D. B.; Rachele J. R.; Keller E. B. J. Biol. Chem. 1947, 169, 419. [PubMed] [Google Scholar]
- Lundström P.; Vallurupalli P.; Religa T. L.; Dahlquist F. W.; Kay L. E. J. Biomol. NMR 2007, 38, 79. [DOI] [PubMed] [Google Scholar]
- Cavanagh J.; Fairbrother W. J.; Palmer A. G.; Rance M.; Skelton N. J.. Protein NMR Spectroscopy: Principles and Practice, 2nd ed.; Elsevier Academic Press: San Diego, 2007. [Google Scholar]
- Tjandra N.; Kuboniwa H.; Ren H.; Bax A. Eur. J. Biochem. 1995, 230, 1014. [DOI] [PubMed] [Google Scholar]
- Malmendal A.; Evenäs J.; Forsén S.; Akke M. J. Mol. Biol. 1999, 293, 883. [DOI] [PubMed] [Google Scholar]
- Carver J. P.; Richards R. E. J. Magn. Reson. 1972, 6, 89. [Google Scholar]
- Palmer A. G.; Kroenke C. D.; Loria J. P. Methods Enzymol. 2001, 339, 204. [DOI] [PubMed] [Google Scholar]
- Finn B. E.; Evenas J.; Drakenberg T.; Waltho J. P.; Thulin E.; Forsen S. Nat. Struct. Biol. 1995, 2, 777. [DOI] [PubMed] [Google Scholar]
- Ulrich E. L.; Akutsu H.; Doreleijers J. F.; Harano Y.; Ioannidis Y. E.; Lin J.; Livny M.; Mading S.; Maziuk D.; Miller Z.; Nakatani E.; Schulte C. F.; Tolmie D. E.; Wenger R. K.; Yao H. Y.; Markley J. L. Nucleic Acids Res. 2008, 36, D402. [DOI] [PMC free article] [PubMed] [Google Scholar]
- Anthis N. J.; Doucleff M.; Clore G. M. J. Am. Chem. Soc. 2011, 133, 18966. [DOI] [PMC free article] [PubMed] [Google Scholar]
- Ishida H.; Borman M. A.; Ostrander J.; Vogel H. J.; MacDonald J. A. J. Biol. Chem. 2008, 283, 20569. [DOI] [PubMed] [Google Scholar]
- Yuan T.; Walsh M. P.; Sutherland C.; Fabian H.; Vogel H. J. Biochemistry 1999, 38, 1446. [DOI] [PubMed] [Google Scholar]
- Feldkamp M. D.; Yu L. P.; Shea M. A. Structure 2011, 19, 733. [DOI] [PMC free article] [PubMed] [Google Scholar]
- Chagot B.; Chazin W. J. J. Mol. Biol. 2011, 406, 106. [DOI] [PMC free article] [PubMed] [Google Scholar]
- Isozumi N.; Iida Y.; Nakatomi A.; Nemoto N.; Yazawa M.; Ohki S. J. Biochem. 2011, 149, 463. [DOI] [PubMed] [Google Scholar]
- Wang X.; Kleerekoper Q. K.; Xiong L. W.; Putkey J. A. Biochemistry 2010, 49, 10287. [DOI] [PMC free article] [PubMed] [Google Scholar]
Associated Data
This section collects any data citations, data availability statements, or supplementary materials included in this article.