Abstract
Background
Brachypodium distachyon is emerging as the model plant for temperate grass research and the genome of the community line Bd21 has been sequenced. Additionally, techniques have been developed for Agrobacterium-mediated transformation for the generation of T-DNA insertional lines. Recently, it was reported that expression of the polyubiquitin genes, Ubi4 and Ubi10 are stable in different tissues and growth hormone-treated plant samples, leading to the conclusion that both Ubi4 and Ubi10 are good reference genes for normalization of gene expression data using real-time, quantitative PCR (qPCR).
Principal Findings
Mining of the Joint Genome Institute (JGI) 8X Brachypodium distachyon genome assembly showed that Ubi4 and Ubi10 share a high level of sequence identity (89%), and in silico analyses of the sequences of Ubi4 (Bradi3g04730) and Ubi10 (Bradi1g32860) showed that the primers used previously exhibit multiple binding sites within the coding sequences arising from the presence of tandem repeats of the coding regions. This can potentially result in over-estimation of steady-state levels of Ubi4 and Ubi10. Additionally, due to the high level of sequence identity between both genes, primers used previously for amplification of Ubi4 can bind to Ubi10 and vice versa, resulting in the formation of non-specific amplification products.
Conclusions
The results from this study indicate that the primers used previously were not sufficiently robust and specific. Additionally, their use would result in over-estimation of the steady-state expression levels of Ubi4. Our results question the validity of using the previously proposed primer sets for qPCR amplification of Ubi4 and Ubi10. We demonstrate that primers designed to target the 3′-UTRs of Ubi4 and Ubi10 are better suited for real-time normalization of steady-state expression levels in Brachypodium distachyon.
Introduction
Brachypodium distachyon is emerging as the model plant species for temperate grass research [1]. The B. distachyon genome has been sequenced using the community inbred line Bd21 [2] and the sequence data produced by the US Department of Energy Joint Genome Institute (http://www.jgi.doe.gov/) can be accessed online via the Brachypodium Genome Resource (http://www.brachypodium.org). In addition to a sequenced genome, B. distachyon is also amenable to Agrobacterium-transformation [2]–[4], thereby facilitating functional genomics studies through the generation of T-DNA insertional mutants that can be used for subsequent phenotypic characterization.
Recently, Hong et al. (2008) [5] reported that the steady-state expression levels of several genes are stable and are therefore useful for normalization of gene expression levels by real-time, quantitative PCR. These include UBC18, a gene encoding a ubiquitin-conjugating enzyme, SamDC, a gene encoding a S-adenosylmethionine decarboxylase, and 2 polyubiquitin genes, Ubi4 and Ubi10. These genes were identified and primers were designed based on EST sequences. The authors reported that the steady-state expression levels of both Ubi4 and Ubi10 are stable in different tissues and growth hormone-treated plant samples, leading them to conclude that both Ubi4 and Ubi10 are good reference genes for normalization of gene expression data by qPCR [5].
Polyubiquitin genes are often characterized by tandem repeats of the coding regions and in general, the number of ubiquitin coding regions per gene varies from 3 to 6 [6]. In Arabidopsis thaliana, tandem repeats of the ubiquitin coding regions may not be exact copies and contain nucleotide variations leading to amino acid substitutions [6]. Comparison of the coding sequences of Ubi4 and Ubi10 obtained from the Joint Genome Institute (JGI) 8X B. distachyon genome assembly showed that these 2 genes exhibit a very high level of sequence identity (89%) and this was confirmed by independently cloning and sequencing the genes. Additionally, both Ubi4 and Ubi10 do not appear to contain introns in their coding regions, consistent with observations of the structure of polyubiquitin genes from A. thaliana [6]. We showed that the primers designed by Hong et al. (2008) [5] (Ubi4Fw, Ubi4Rv, Ubi10Fw, Ubi10Rv) exhibit multiple binding sites within the coding region that can result in multiple PCR amplification products. Interestingly the multiple banding was not detected by melt curve analysis but only by gel electrophoresis of the PCR products. Additionally, we demonstrate that using the primers, Ubi4Fw, Ubi4Rv, Ubi10Fw, and Ubi10Rv, for qPCR can result in over-estimation of steady-state levels of Ubi4. This problem is exacerbated by the observation that these primers can also recognize Ubi10 transcripts as templates, resulting in the formation of non-specfic amplification products. We further show that primers designed to amplify Ubi10 primers may compete for the same binding sites and this may influence the efficiency of the PCR reaction. The Ubi10 primers also show some weak affinity for the Ubi4 gene sequence.
The results from this study indicate that the primers, Ubi4Fw, Ubi4Rv, Ubi10Fw, Ubi10Rv [5] were not sufficiently robust and specific. It is important to note that these primers were designed from EST sequences as the full B. distachyon was not available at that time. Our results show that these primers, Ubi4Fw, Ubi4Rv, Ubi10Fw, and Ubi10Rv, are not suitable for amplification of Ubi4 and Ubi10, and demonstrate that primers designed to target the 3′-UTRs of Ubi4 and Ubi10 are better suited for real-time normalization of steady-state expression levels in B. distachyon.
Another finding of importance from this investigation is the apparent inability of qPCR melt curve analysis to pick up the multiple banding detected by gel electrophoresis of the products and this can be attributed to the presence of tandem repeats within the coding sequence. These findings further re-enforces the need for careful and precise planning and testing of experimental setups for qPCR experiments.
Results
Reverse Transcriptase PCR of Reference Genes Ubc18, Ubi4, and Ubi10 from 2-week Old Leaves of B. distachyon
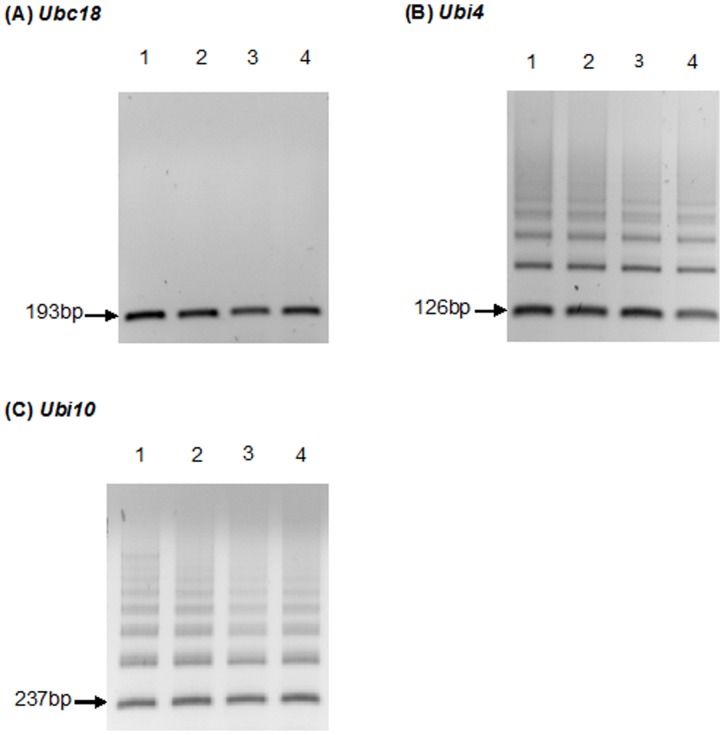
Complementary DNAs (cDNAs) were used as template for PCR amplification with the appropriate primers (Ubi4Fw, Ubi4Rv, Ubi10Fw, and Ubi10Rv) [5]. Following RT-PCR amplification, gel electrophoresis was used to visualize the size of the PCR products to determine if products of the expected sizes were obtained (Figure 1). The expected sizes of the PCR products are 193 bp (Ubc18), 126 bp (Ubi4), and 237 bp (Ubi10). Figure 1A shows the results of PCR amplification of the Ubc18 gene. It can be seen that this PCR reaction yielded a single band of the expected size. In contrast, the PCR amplification of Ubi4 (Figure 1 B) and Ubi10 (Figure 1 C) yielded multiple bands. To ensure that the multiple banding patterns observed for Ubi4 (Figure 1 B) and Ubi10 (Figure 1 C) were not due to variations in amplification specificities, a gradient PCR using temperature ranging from 55°C to 65°C was performed, and multiple products were obtained regardless of the annealing temperatures tested (Figure S1). Additionally, the multiple banding patterns observed were not due to genomic contamination as no amplification was observed in no reverse transcriptase (RT) controls (Figure S1).
Figure 1. Gel electrophoresis of products from PCR amplification of the housekeeping genes, Ubc18, Ubi4, and Ubi10 from cDNA derived from RNA isolated from 2-week old leaves.
Lanes 1, 2, 3 and 4 in (A), (B) and (C) show the products of PCR amplification of cDNA templates from 4 individual plants. The expected sizes of the PCR products are 193 bp (Ubc18), 126 bp (Ubi4), and 237 bp (Ubi10). The results shown are reverse gel images (dark bands on white backgrounds) from 25 amplification cycles. Gel images are representative of 3 independent experiments.
In silico Analysis of Ubi4 and Ubi10, and Primer Binding Sites within the Coding Sequences
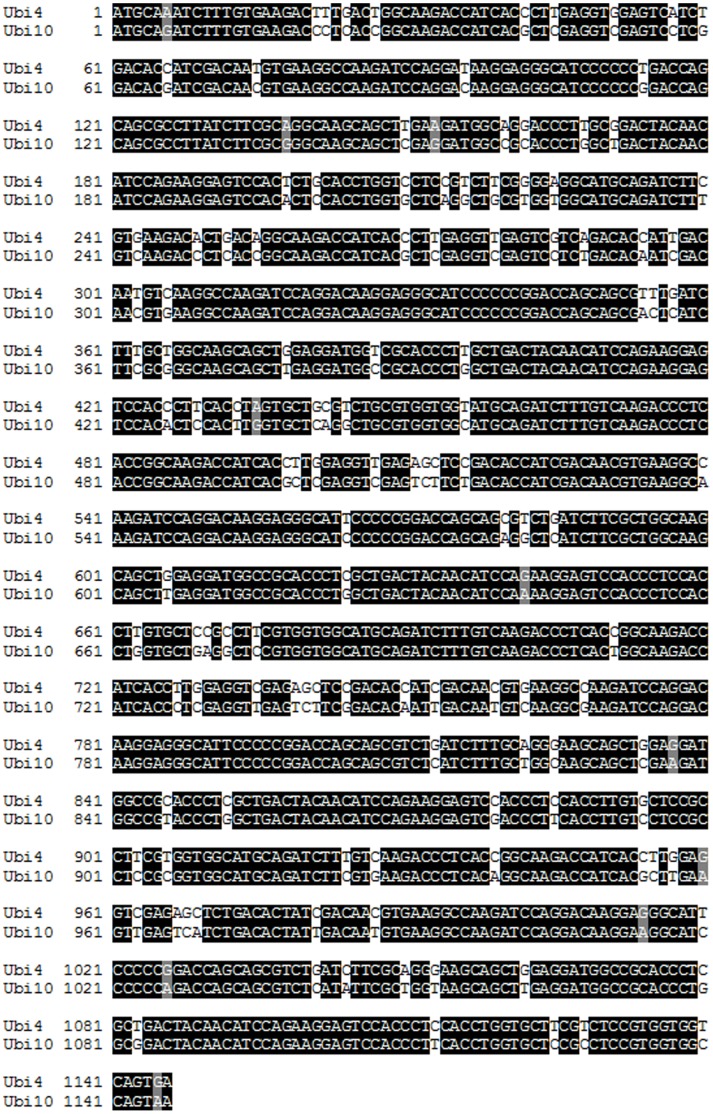
In order to understand the multiple banding associated with RT-PCR of Ubi4 and Ubi10, we mined the JGI 8X B. distachyon genome assemblies via BrachyBase (http://www.brachybase.org) to obtain the coding sequences of Ubi4 and Ubi10 and compared both sequences using BLASTN (version 2.2.22). Our analyses showed that both genes exhibit a very high level (89%) of sequence identity (Figure 2). The primers designed by Hong et al. (2008) [5] show either perfect matches with the coding sequences (Ubi4 and Ubi10) or 1 or 2 base mismatches (Figures S2, S3). This can potentially result in over-estimation of the steady-state levels of Ubi4 and Ubi10 and may account for the observation of multiple products arising from PCR amplification.
Figure 2. CLUSTAL W alignment of Ubi4 and Ubi10 sequences.
Alignment of the nucleotide sequences of Ubi4 (Bradi3g04730) and Ubi10 (Bradi1g32860) showed a very high level of sequence identity (89%; BLASTN 2.2.22) between the two polyubiquitin genes. Identical nucleotides are shown in black and nucleotides shaded in grey refer to conserved purines using the Boxshade program.
Reverse Transcriptase (RT)-PCR Amplification of Ubi4 and Ubi10
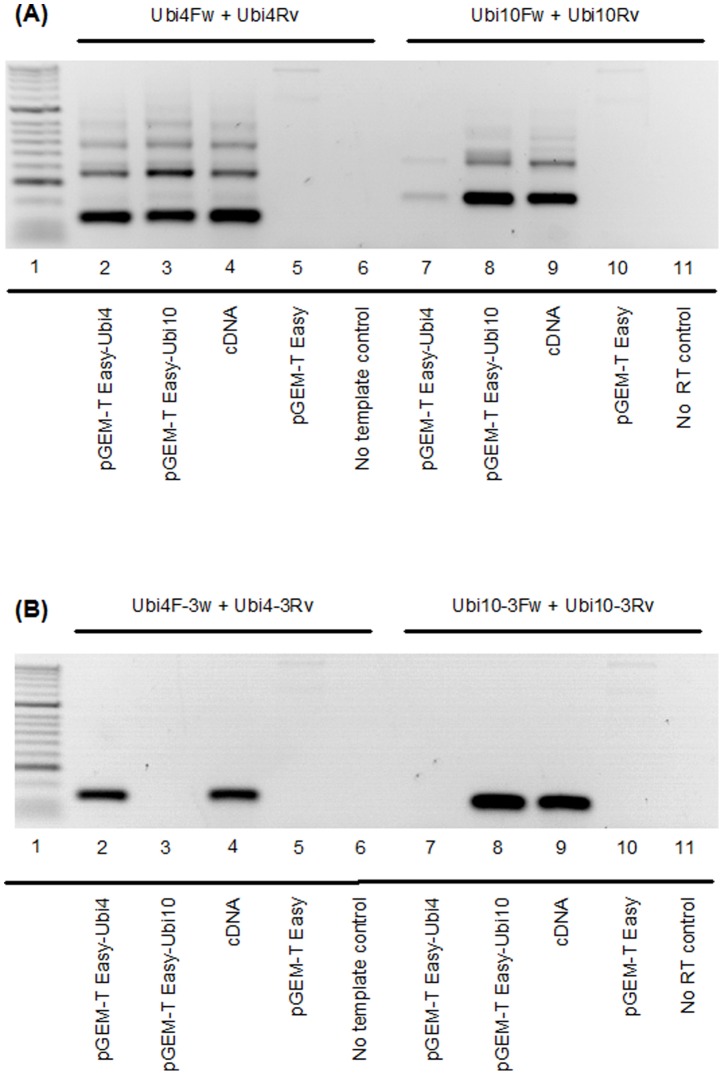
To validate the results obtained from RT-PCR of cDNA (Figure 1) and in silico analyses (Figure 2; Figures S2 and S3), we reverse transcribed cDNA from total RNA isolated from B. distachyon Bd21 to clone the cDNAs corresponding to Ubi4 and Ubi10. Due to the high level of sequence identity between Ubi4 and Ubi10 (Figure 2), we designed primers to bind to the predicted 5′- and 3′-untranslated regions (UTRs) in order to enable us to clone the full-length coding sequence of both Ubi4 and Ubi10. The corresponding cDNAs were then sub-cloned into pGEM T-Easy and the sequences verified. To determine the cross-reactivity of the primers, we used the plasmid clones as templates for PCR. Using purified plasmids (pGEM T-Easy) containing the coding sequence of Ubi4, we were able to demonstrate that the Ubi4 primers (Ubi4Fw, Ubi4Rv) were indeed able to bind to multiple sites within the coding sequence (as predicted by in silico analysis), leading to the formation of multiple PCR amplification products (Figure 3 A). The multiple banding patterns observed are not due to genomic contamination as no bands were detected in the no RT controls (Figures 3 A, B). Additionally, we were able to demonstrate that Ubi10 primers (Ubi10Fw, Ubi10Rv) were able to bind to Ubi4, resulting in the formation of non-specific PCR amplification products (Figure 3 A).
Figure 3. PCR amplification of Ubi4 and Ubi10 from various templates.
(A) Primers used for amplification of Ubi4 (Ubi4Fw and Ubi4Rv) and Ubi10 (Ubi10Fw and Ubi10Rv) are according to Hong et al. (2008) [5]. Lane 1: molecular weight marker (Bioline HyperLadder 1). The templates used are indicated for each lane. Empty vector (pGEM-T Easy) and no RT reactions were included as controls. The results shown are reverse gel images (dark bands on white backgrounds) from 25 amplification cycles. (B) Primers targeting the 3′-UTRs of Ubi4 (Ubi4-3Fw and Ubi4-3Rv) and Ubi10 (Ubi10-3Fw and Ubi10-3Rv) were used for amplification of the various templates. Lane assignments and templates used as in (A). Gel images are representative of 3 independent experiments.
We also used purified plasmids (pGEM T-Easy) containing the coding sequence of Ubi10 to demonstrate that Ubi10 primers (Ubi10Fw, Ubi10Rv) were able to bind to multiple sites within the coding sequence, resulting in the formation of multiple PCR amplification products (Figure 3 A) and that primers used for amplification of Ubi4 (Ubi4Fw, Ubi4Rv) also resulted in the formation of non-specific PCR amplification products when Ubi10 was used as the template (Figure 3 A).
To circumvent the problem associated with the formation of non-specific amplification products and over-estimation of steady-state levels of Ubi4 and Ubi10 transcripts using primers Ubi4Fw, Ubi4Rv, Ubi10Fw, and Ubi10Rv, we designed primers targeting the 3′-UTR of Ubi4 and Ubi10. RT-PCR amplification using primers targeting the 3′-UTRs of Ubi4 (Ubi4-3Fw, Ubi4-3Rv) and Ubi10 (Ubi10-3Fw, Ubi10-3Rv) clearly demonstrated the formation of one specific amplification product corresponding to 155 bp and 138 bp for Ubi4 and Ubi10, respectively (Figure 3 B).
Comparative qPCR of Ubi4 and Ubi10 using Different Primer Sets to Determine Amplification Specificity
To ascertain the effects of non-specific primer binding on the levels of steady-state transcripts, real-time quantitative PCR (qPCR) was performed using Ubi4Fw, Ubi4Rv; Ubi10Fw, and Ubi10Rv, and primers designed to target the 3′-UTRs (Ubi4-3Fw, Ubi4-3Rv; Ubi10-3Fw, and Ubi10-3Rv). In line with Kapa Sybr Green protocols, various primer concentrations were tested for the four primer sets at an annealing temperature of 60°C. We observed that primer concentrations of 100 nM resulted in the most efficient amplification (data not shown). Using plasmids containing either Ubi4 or Ubi10 as template, serial dilution series qPCRs were run in order to calculate primer efficiencies. PCR efficiency (E) values and r2 values were calculated for each run in order to compare primer sets. The primer set Ubi4-3Fw and Ubi4-3Rv showed an E value of 102% and an r2 value of 0.999 whereas the primer set Ubi4Fw and Ubi4Rv showed an E value of 95% and r2 value of 0.999. The primer set Ubi10-3Fw and Ubi10-3Rv showed an E value of 111% and an r2 value of 0.983 while the primer combination of Ubi10Fw and Ubi10Rv showed an E value of 117% and r2 value of 0.986.
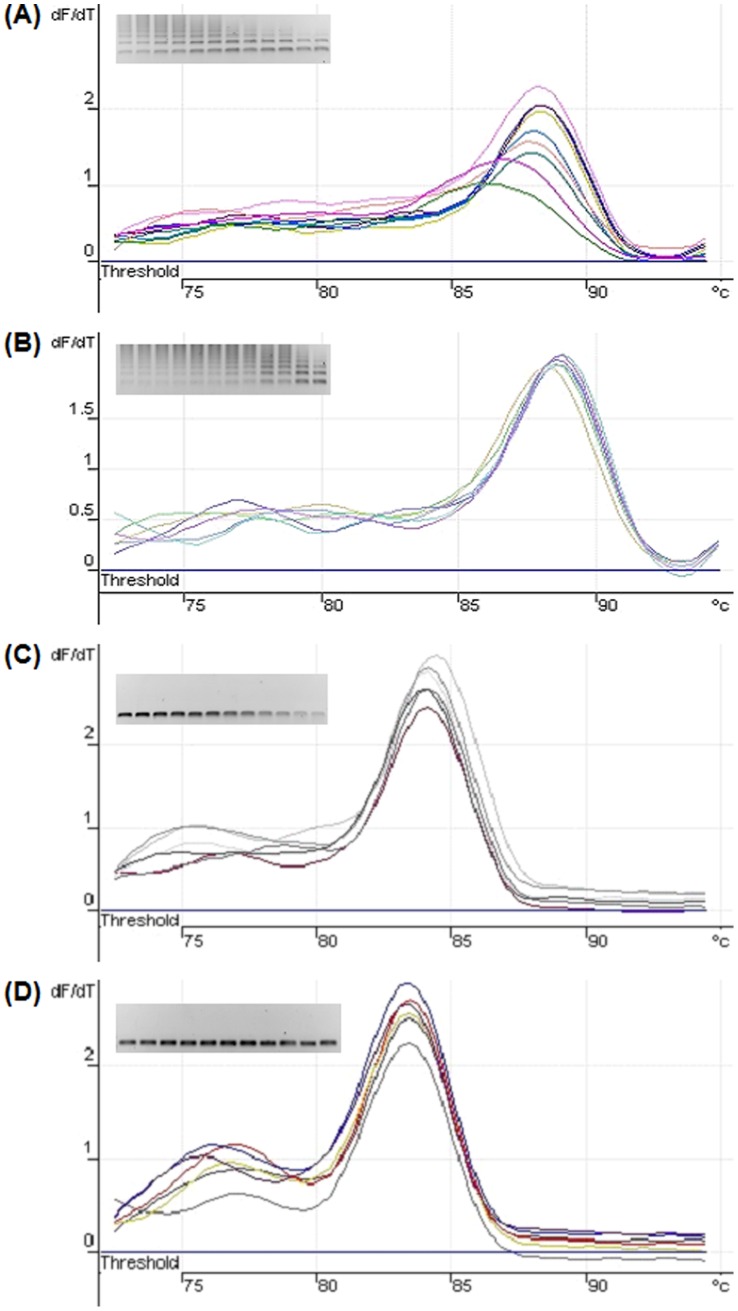
Interestingly, all primer pair combinations gave a single curve when dissociation analysis was carried out on the products of qPCR (Figures 4 A to D). However, gel electrophoresis of the amplification reactions showed that Ubi4Fw and Ubi4Rv and Ubi10Fw and Ubi10Rv primer combinations resulted in multiple PCR products (Figures 4 A, B) whereas primer combinations, Ubi4-3Fw and Ubi4-3Rv, and Ubi10-3Fw and Ubi10-3Rv (amplification of 3′-UTRs) resulted in only one PCR amplification product (Figures 4 C, D).
Figure 4. Comparative dissociation curve analyses of qPCR amplification from various primer combinations.
(A) Dissociation curve data for primer combination Ubi4Fw and Ubi4Rv. Inset: Gel electrophoresis of qPCR amplification products showing the presence of multiple PCR products. Reverse gel image (dark bands on white background). (B) Dissociation curve data for primer combination Ubi10Fw and Ubi10Rv. Inset: Gel electrophoresis of qPCR amplification products showing the presence of multiple PCR products. Reverse gel image (dark bands on white background). (C) Dissociation curve data for primer combination Ubi4-3Fw and Ubi4-3Rv. Inset: Gel electrophoresis of qPCR amplification products showing the presence of one PCR product. Reverse gel image (dark bands on white background). (D) Dissociation curve data for primer combination Ubi10-3Fw and Ubi10-3Rv. Inset: Gel electrophoresis of qPCR amplification products showing the presence of one PCR product. Reverse gel image (dark bands on white background).
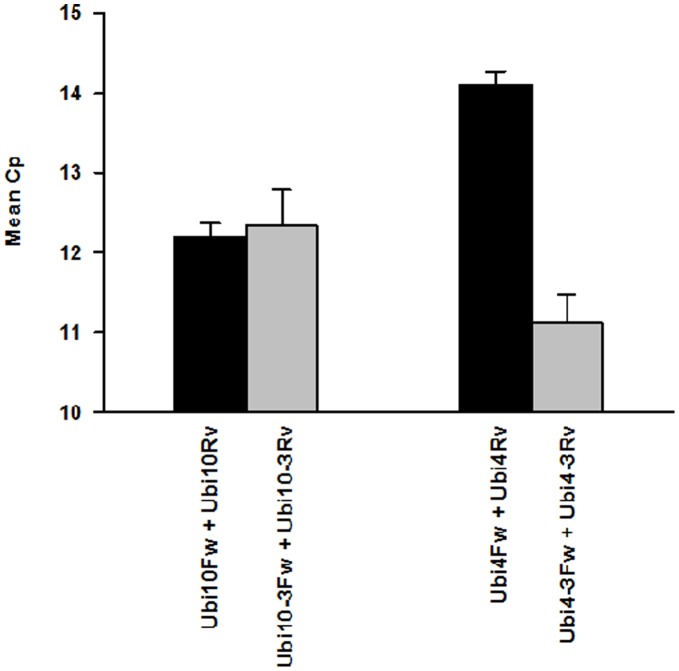
From Figure 3A it can be seen that the primer combination Ubi4Fw and Ubi4Rv exhibit strong cross reactivity with Ubi10 as a template whereas Ubi10Fw and Ubi10Rv showed only weak cross reactivity with Ubi4 as a template. This suggests the possibility of overestimation of steady-state transcript levels during qPCR when using Ubi4Fw and Ubi4Rv primers. To verify this, we used purified Ubi4 and Ubi10 templates (linearized pGEM T-Easy plasmids containing Ubi4 or Ubi10) for qPCR. Using a dilution series of linearized pGEM T-Easy-Ubi10 template, comparable Cp values were obtained for both primers sets Ubi10Fw and Ubi10Rv and Ubi10-3Fw and Ubi10-3Rv (Figure 5 A). In contrast, using a dilution series of linearized pGEM T-Easy-Ubi4 template, a difference in Cp (ΔCp) value of ca. 3 was observed between the 2 different primer sets, with the primers Ubi4Fw and Ubi4Rv consistently exhibiting a lower Cp value compared to primers Ubi4-3Fw and Ubi4-3Rv (Figure 5 B). This suggests that the primer set Ubi4Fw and Ubi4Rv, is likely to over-estimate the steady-state levels of Ubi4 transcripts.
Figure 5. Real time PCR standard curves for the primer sets used.
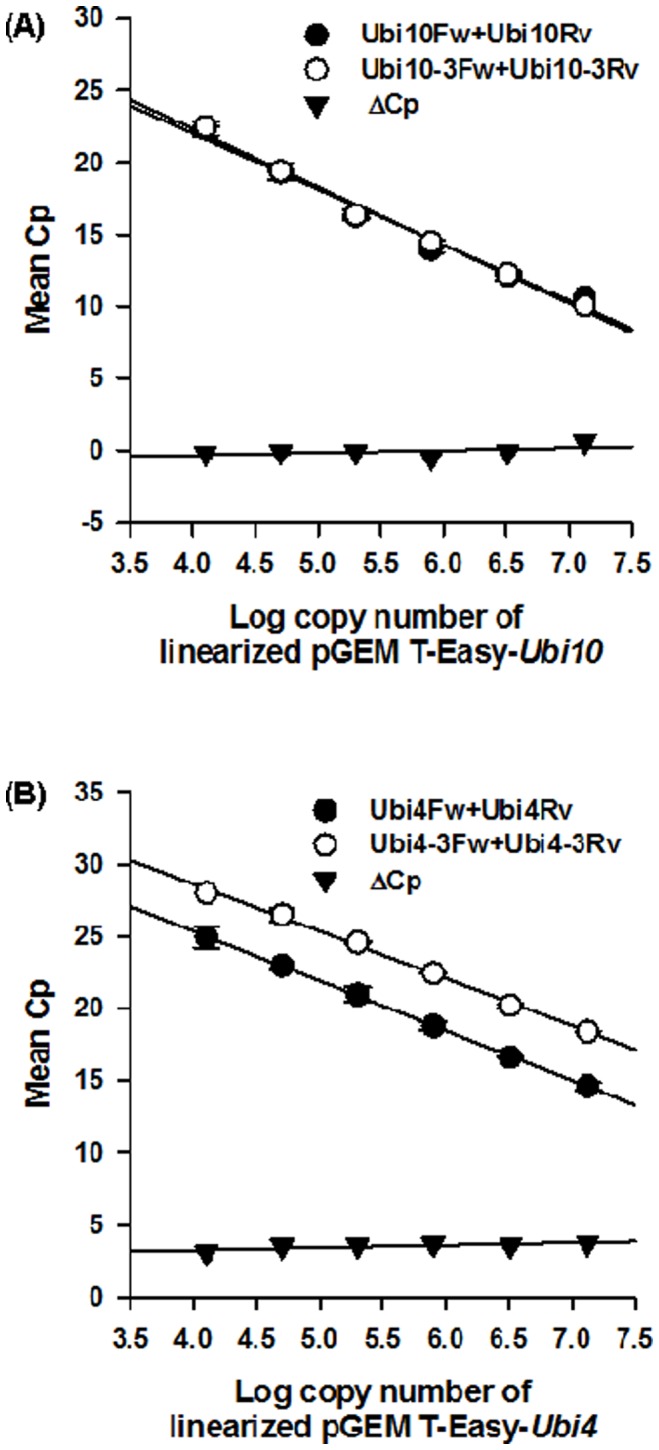
(A) Standard curve generated using a serial dilution of pGEM T-Easy-Ubi10 as template. The Cp values obtained at each concentration for Ubi10Fw and Ubi10Rv [5] are shown as white circles. The Cp values obtained at each concentration for Ubi10-3Fw and Ubi10-3Rv are shown as black circles. The ΔCp between both sets of primers at each concentration is indicated by triangle. Error bars are shown for each point. (B) Standard curve generated using a serial dilution of pGEM T-Easy-Ubi4 as template. The Cp values obtained at each concentration for Ubi4Fw and Ubi4Rv [5] are shown as white circles. The Cp values obtained at each concentration for Ubi4-3Fw and Ubi4-3Rv are shown as black circles. The ΔCp between both sets of primers at each concentration is indicated by triangle. Values are mean ± SE (n = 3).
In order to ascertain if the results observed using linearized plasmids containing Ubi4 and Ubi10 as templates were reproducible for the analysis of transcript levels, qPCR was carried out using cDNA as template (Figure 6). Comparable mean Cp values were obtained for the 2 primer sets used for amplification of Ubi10 (Figure 6). In contrast, our results clearly showed that there is a significant difference in the mean Cp value between primer sets used for amplification of Ubi4 with primer combination Ubi4Fw and Ubi4Rv showing a lower mean Cp value compared to primer set Ubi4-3Fw and Ubi4-3Rv (Figure 6). The ΔCp value of 3 between these 2 primer sets (Figure 6) are consistent with results obtained using linearized plasmids containing Ubi4 (Figure 5 B).
Figure 6. qPCR of B. distachyon cDNA using various primer combinations.
Mean Cp observed when using cDNA as a template for each of the primer pairs, Ubi4 Fw and Ubi4Rv, Ubi10 Fw and Ubi10Rv, Ubi4-3Fw and Ubi4-3Rv, Ubi10-3Fw and Ubi10-3Rv. Values are mean ± SE (n = 3).
Suitability of Primer Sets Designed to Amplify the 3′-UTRs for use in Developmental Studies
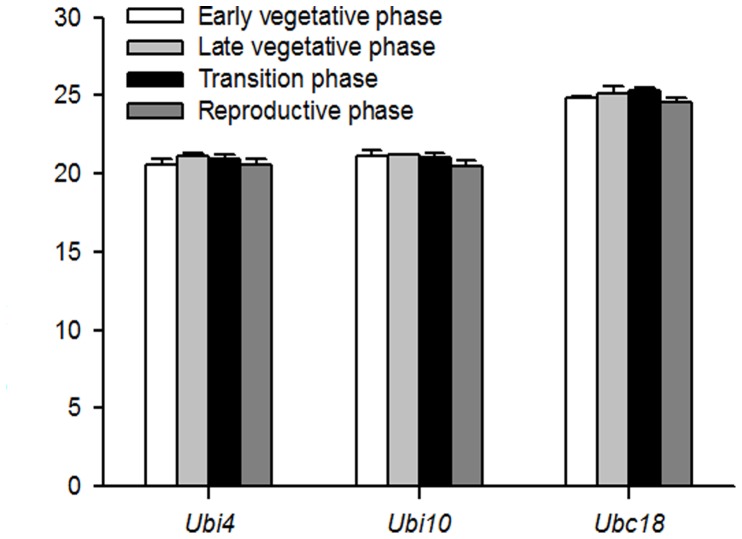
To determine the suitability of the new primer sets (Ubi4-3Fw and Ubi4-3Rv, and Ubi10-3Fw and Ubi10-3Rv) for normalization in developmental studies, we isolated RNA from B. distachyon plants at various developmental stages according to Hong et al. [5]: Early vegetative phase, late vegetative phase, transition phase, and reproductive phase. Our results show that the mean Cp values for Ubi4 and Ubi10 (Figure 7) are not significantly different at the different developmental stages, indicating that these 2 genes are stably expressed and suitable for use as reference genes for developmental studies. Additionally, we also show that Ubc18, which Hong et al. [5] has identified as a good reference gene is also stably expressed during development (Figure 7).
Figure 7. qPCR determination of Ubi4, Ubi10 and Ubc18 expression during development in B. distachyon.
cDNA from 4 different developmental stages were used: early vegetative stage, late vegetative phase, transition phase, and reproductive phase. Primers designed to target the 3′-UTRs (Ubi4-3Fw and Ubi4-3Rv, Ubi10-3Fw and Ubi10-3Rv) were used for amplification of Ubi4 and Ubi10. For amplification of Ubc18, primers used were those reported by Hong et al. [5]. The mean Cp values are average of 3 biological replicates ± SE (n = 3). Three technical replicates were conducted for each biological replicate.
Discussion
Real time, quantitative PCR (qPCR) is a powerful technique for quantifying steady-state transcript levels. Furthermore, several groups have reported that qPCR may be used to ascertain transgene copy numbers in mutants [7]–[8]. Hong et al. (2008) [5] proposed 3 genes as suitable reference genes for normalization of gene expression under various experimental conditions. Of the three genes tested, Ubc18 was shown to be most suitable for comparison between plant samples and between different stages of development, while Ubi4 and Ubi10 were demonstrated to be suitable for comparisons between different plant tissues [5].
We showed that using the primer pairs designed by Hong et al. (2008) [5] for amplification of Ubi4 and Ubi10 resulted in the formation of multiple PCR products (Figure 1 B, C), indicating non-specific priming of the target templates. Attempts to optimize annealing temperature from 55°C to 65°C (the theoretical melting point of the primers) did not result in any increase in amplification specificity (Figure S1). We cloned Ubi4 and Ubi10 and in silico analyses of the sequences indicated that both genes share an 89% sequence identity (Figure 2), and revealed potential multiple binding sites for both Ubi10Fw, Ubi10Rv and Ubi4Fw, Ubi10Rv primers in both Ubi4 and Ubi10 (Figures S2 and S3). We showed that the 3′-UTRs of both Ubi4 and Ubi10 are the only regions that allow primers to be designed that would not result in cross reactivity or produce non-specific PCR products (Figure S4). Primers were designed for amplification from the 3′-UTRs of Ubi4 (Ubi4-3Fw, Ubi4-3Rv) and Ubi10 (Ubi10-3Fw, Ubi10-3Rv), and all primer sets were tested on plasmids harbouring Ubi10 and Ubi4 (pGEM-T-Easy-Ubi10 and pGEM-T-Easy-Ubi4) and cDNA, and the results clearly demonstrated the specificity of the primers designed to target amplification from the 3′-UTRs (Figures 3 A, B).
The ability of Ubi4Fw and Ubi4Rv, and Ubi10Fw and Ubi10Rv to cross react with both Ubi4 and Ubi10 and produce multiple PCR products suggest a problem with the primer design. Interestingly, a single melting peak (often used as a test of amplification specificity of qPCR) was obtained for all primer sets tested although multiple PCR products were obtained only when primers Ubi4Fw, Ubi4Rv, Ubi10Fw, and Ubi10Rv, were used (Figure 4). This can be attributed to the formation of multiple products of similar melting temperatures due to the presence of tandem repeats within the coding sequences of Ubi4 and Ubi10.
As multiple PCR products are formed when the primers, Ubi4Fw, Ubi4Rv, Ubi10Fw, and Ubi10Rv, were used, it suggests that the steady-state levels may be overestimated. Indeed, we observed that qPCR using Ubi4Fw and Ubi4Rv primers consistently yielded a lower mean Cp value of 3 when compared with qPCR using Ubi4-3Fw and Ubi4-3Rv, indicating that the steady-state levels of Ubi4 were over-estimated by 3-fold (Figure 5 B). This is consistent with the observation of 3 potential binding sites within the coding sequence of Ubi4 for Ubi4Fw and Ubi4Rv as opposed to only one binding site for Ubi4-3Fw and Ubi4-3Rv on the 3′-UTR (Figure S2).
Interestingly, while multiple PCR products were also obtained using Ubi10Fw and Ubi10Rv, no differences in the mean Cp values were observed between primer sets Ubi10Fw, Ubi10Rv and Ubi10-3Fw, Ubi10-3Rv (Figure 5 A). This can be attributed to the sequence overlap between Ubi10Fw and Ubi10Rv (Figure S3) where binding of either the forward or reverse primer would exclude the other.
We show, using the primers designed to target the 3′-UTRs of Ubi4 and Ubi10 that both these genes are stably expressed under different developmental stages (Figure 6). Additionally, the expression of Ubc18 is also stable during development (Figure 6). Together, this data set show that Ubi4, Ubi10, and Ubc18, can be use as reference genes for developmental studies.
Given the cross reactivity of the Ubi4Fw, Ubi4Rv and Ubi10Fw, Ubi10Rv primers, the results obtained for steady-state levels reported by Hong et al. (2008) [5], are questionable. Our results clearly highlight the need to empirically and comprehensively test all primers and PCR conditions to determine the suitability of reference genes for normalization of gene expression.
Conclusions
The results from this study indicate that the primers designed by Hong et al. (2008) [5] were not sufficiently robust and specific. Additionally, their use would result in over-estimation of the steady-state levels of Ubi4. Our results question the validity of using the primer sets, Ubi4Fw, Ubi4Rv, Ubi10Fw, and Ubi10Rv, for amplification of Ubi4 and Ubi10 as reference genes for normalization of gene expression levels by qPCR in B. distachyon. However, it is important to note that the primer sequences were based on ESTs when the full B. distachyon information was not available. We demonstrate that primers designed to target the 3′-UTRs of Ubi4 and Ubi10 are better suited for normalization of steady-state transcript levels by qPCR in B. distachyon, and we demonstrated the suitability of Ubi4, Ubi10, and Ubc18 as reference genes for developmental studies. We also highlight a potential limitation of using melt curve analysis as the sole determinant of amplification specificity and demonstrate the absolute requirement for gel electrophoresis of PCR products to support melt curve analyses.
Materials and Methods
Plant Growth
Mature seeds of Brachypodium distachyon Bd21 (kindly provided by Dr. David F. Garvin, USDA-ARS, MN, USA) were soaked in distilled water for 2 hours before the upper and lower glumes were removed. Seeds were then soaked in 20% household bleach (∼ 1% sodium hypochlorite) for 3 min and washed 3 times with sterile distilled water. They were then placed on moist sterile filter paper in Petri dishes (9 cm Ø) at a density of 20 seeds per plate. Plates were stratified at 4°C for 3d in the dark before being transferred to a controlled temperature chamber (Sanyo, http://www.sanyo-biomedical.co.uk) at 25°C for 4d in the dark. Germinated seeds were then transferred to a compost:vermiculite (2∶1, v/v) mix (Shamrock multipurpose compost, Ireland) in 5×5 cm pots at a density of 1 seedling per pot, and placed in a Microlima 1750 climate controlled growth chamber (Snijders, http://www.snijders-scientific.nl/) under the following conditions: 16/8h and 24/18°C light/dark; PPFD of 250 µmol m−2s−1; relative humidity of 70%. Plants were watered daily.
RNA Isolation and Cloning of Ubi4 and Ubi10
Leaves from various stages of development of B. distachyon plants (as identified by Hong et al (2008) [5] were harvested and flash frozen in liquid nitrogen. The different stages are: early vegetative phase, late vegetative phase, transition phase, and reproductive phase. Total RNA was extracted from the leaves harvested from 4 plants with each plant representing one replicate using the RNeasy kit (Qiagen, http://www1.qiagen.com/) according to the manufacturer’s instructions. The quality and quantity of the total RNA was determined using a NanoDrop 1000 spectrophotometer (Thermo Scientific, http://www.nanodrop.com). 1000 ng of total RNA was treated with 1 U of DNaseI (Invitrogen, http://www.invitrogen.com/site/us/en/home.html) before being used for cDNA synthesis using 200 U of M-MLV Reverse Transcriptase (Invitrogen, http://www.invitrogen.com/site/us/en/home.html). The resultant cDNA was used for PCR amplication of Ubi4 and Ubi10 using KOD Hot Start DNA Polymerase (Novagen, http://www.merck-chemicals.com/life-science-research) using primers designed to the predicted 5′- and 3′-UTRs.
Ubi4utrFw: 5′-AGGCAATCTCGTCTTCTCCAATCG-3′.
Ubi4utrRv: 5′-ACCCAGGTATAGCAGCAGTTCCAA-3′.
Ubi10utrFw: 5′-CCAAACTCTCAATCGCACCGAGAA-3′.
Ubi10utrRv: 5′-ACACCCTGAACCAGACTTGTGAAC-3′.
The resulting PCR products were then sub-cloned into pGEM T-Easy (Promega, http://www.promega.com), and transformed into E. coli DH5α, and the plasmids isolated and purified and sequence verification of the full-length clones of Ubi4 and Ubi10 were conducted by Eurofins MWG Operon (http://www.the-mwg.com).
Reverse Transcriptase-PCR (RT-PCR)
RT-PCR was conducted using 0.5 U of Go-Taq™ DNA polymerase (Promega, http://www.promega.com) and cDNA or purified plasmids as templates. The following cycling protocol was used for RT-PCR. Initial step (95°C for 3 min), 25 cycles (95°C for 1 min, 60°C for 1 min and 72°C for 1min), final step (72°C for 10 min). The sequences of the primers used (Ubi4Fv, Ubi4Rv, Ubi10Fv, and Ubi10Rv) were according to Hong et al. (2008) [5]. Primers were also designed to target the 3′-UTRs of Ubi4 and Ubi10 (Ubi4-3Fv, Ubi4-3Rv, Ubi10-3Fv, and Ubi10-3Rv). All primers were synthesized by Eurofins MWG Operon (Germany).
Ubi4Fv: 5′-TGACACCATCGACAACGTGA-3′.
Ubi4Rv: 5′-GAGGGTGGACTCCTTCTGGA-3′.
Ubi10Fv: 5′-TCCACACTCCACTTGGTGCT-3′.
Ubi10Rv: 5′-GAGGGTGGACTCCTTTTGGA-3′.
5′-GCTGTTGGAACTGCTGCTATACCT-3′.
5′-TTGCACCAAACCAACACACACCAG-3′.
5′-TGGACTTGCTTCTGTCTGGGTTCA-3′.
Ubi10-3Rv: 5′-TGGTACACAGGCATAACACTGACG-3′.
Note: Ubi4Rv and Ubi10Rv differ by only one base mismatch.
Ubi4Rv: 5′-GAGGGTGGACTCCTTCTGGA-3′.
Ubi10Rv: 5′-GAGGGTGGACTCCTTTTGGA-3′.
Sub Cloning of Ubi4 and Ubi10 Genes for Sequencing
The pGEM®-T Easy Vector System (Promega, UK) was used for sub-cloning Ubi4 and Ubi10. The sequences of Ubi4 and Ubi10 sub-cloned into pGEM T-Easy were verified by MWG Eurofins Operon sequencing lab (Germany).
Real-time, Quantitative PCR (qPCR) of Ubi4 and Ubi10
qPCR of steady state levels of Ubi4 and Ubi10 were conducted using 1.5 µl of cDNA (total RNA concentration of 75 ng) or 25 ng µl−1 of linearized pGEM-T-Easy plasmid containgin Ubi4 or Ubi10. These were then serially diluted with H2O. A standard curve for each set of primers was carried out using a dilution series of 6 concentrations of linearized plasmid, and best fit line was obtained. From this the efficiency (E) of each set of primers was ascertained.
qPCR was carried out using Kapa SYBR® fast qPCR Universal Kit (Anachem, UK). Each reaction was made up to 20 µl, with 10 µl Kapa SYBR green master mix, 100 nM of forward and reverse primers and either 1.5 µl of cDNA or 1 µl of plasmid as starting template with 7.5 or 8 µl respectively, of distilled RNAase free H2O. 4 sets of primers were used for each template, Ubi4Fw and Ubi4Rv (Hong et al., 2008; [5]), Ubi10Fw and Ubi10 Rv (Hong et al. 2008; [5]), Ubi4-3Fw and Ubi4-3Rv (designed to target the 3′-UTR), and Ubi10-3Fw and Ubi10-3Rv (designed to target the 3′-UTR). Reactions were run in triplicate for each template and primer set on a RotorGene RG-3000 thermal cycler (Corbett Research, Australia). A three-step and a two-step cycling programme were investigated to ensure there were no potential differences in the results. Negative and positive controls were included in all runs. Two step cycling was carried out as follows: an initial step at 95°C for 10 min followed by 40 cycles of 95°C for 15 sec followed by 60°C for 60 sec. Three step cycling protocol is as follows: an initial step at 95°C for 10 min followed by 40 cycles of 95°C for 15 sec followed by 60°C for 60 sec and 72°C for 5 sec. Dissociation curves were generated at the end of each run for both two step and three step PCR programs, starting at 67°C and holding for 45 sec and then increasing 1 degree every 15 sec and finishing at 95°C. Cp values were calculated automatically by the Rotor-gene 3000 software. All qPCR reactions were replicated using an ABI7900HT Fast Real-Time PCR System (Applied Biosystems, USA) using a two step cycling program to ensure that the results obtained were independent of the thermal cycler platform used. All qPCR reaction products were subjected to gel (1.2% agarose) electrophoresis to verify amplification specificity.
Supporting Information
Gel electrophoresis products following gradient PCR of (A) Ubi4 and (B) Ubi10 using primers designed by Hong et al. (2008) (Ubi4FW, Ubi4RV and Ubi10Fw, Ubi10Rv) [5] , and primers designed to prime to the 3′-UTR (Ubi4-3Fw, Ubi4-3Rv and Ubi10-3Fw, Ubi10-3Rv). Lanes 1 to 11: temperature gradient from 55 to 65°C at 1°C intervals, Lane 12: no RT control, Lane 13: water only blank, and Lane 14: PCR amplification at 60°C using primers targeting the 3′-UTR. Gel images are representative of 3 independent experiments.
(DOC)
Binding sites of primers Ubi4Fw and Ubi4Rv on Ubi4 and Ubi10 . The directions of priming are indicated by arrows. Mismatches are shown in red.
(DOC)
Binding sites of primers Ubi10Fw and Ubi10Rv on Ubi10 and Ubi4 . The directions of priming are indicated by arrows. Mismatches are shown in red.
(DOC)
Comparison of the 3′-UTR regions of both Ubi4 and Ubi10 and binding sites of Ubi10-3Fw and Ubi10-3-Rv at the 3′-UTR of Ubi10 , and Ubi4-3Fw and Ubi4-3Rv at the 3′-UTR of Ubi4.
(DOC)
Acknowledgments
We thank Dr. Theresa Reape and Mr. Damien Egan for advice on real-time quantitative PCR, and Dr. Thomas Gallagher for critically reading the manuscript.
Funding Statement
This research was supported by Science Foundation Ireland Research Frontiers Programme Grants (SFI/08/RFP/EOB1087) to CKYN. JPC is a Government of Ireland Postgraduate Scholar supported by the Irish Research Council for Science, Engineering and Technology (IRCSET). AB (Ali Behpouri) is funded by a scholarship from the Iranian Government. AB (Alison Bird) is funded by a Research Demonstratorship from University College Dublin. The funders had no role in study design, data collection and analysis, decision to publish, or preparation of the manuscript.
References
- 1. Brkljacic J, Grotewold E, Scholl R, Mockler T, Garvin DF, et al. (2011) Brachypodium as a model for the grasses: today and the future. Plant Physiol 157: 3–13. [DOI] [PMC free article] [PubMed] [Google Scholar]
- 2. The International Brachypodium Initiative (2010) Genome sequencing and analysis of the model grass Brachypodium distachyon . Nature 463: 763–768. [DOI] [PubMed] [Google Scholar]
- 3. Vogel JP, Hill T (2007) High-efficiency Agrobacterium-mediated transformation of Brachypodium distachyon inbred line Bd21–3. Plant Cell Rep 27: 471–478. [DOI] [PubMed] [Google Scholar]
- 4. Alves SC, Worland B, Thole V, Snape JW, Bevan MW, et al. (2009) A protocol for Agrobacterium-mediated transformation of Brachypodium distachyon community standard line Bd21. Nat Protoc 4: 638–649. [DOI] [PubMed] [Google Scholar]
- 5. Hong SY, Seo PJ, Yang MS, Xiang F, Park CM (2008) Exploring valid reference genes for gene expression studies in Brachypodium distachyon by real-time PCR. BMC Plant Biol 8: 112. [DOI] [PMC free article] [PubMed] [Google Scholar]
- 6. Callis J, Carpenter T, Sun CW, Vierstra RD (1995) Structure and evolution of genes encoding polyubiquitin and ubiquitin-like proteins in Arabidopsis thaliana ecotype Columbia. Genetics 139: 921–939. [DOI] [PMC free article] [PubMed] [Google Scholar]
- 7. Bustin S, Benes V, Garson J, Hellemans J, Huggett J, et al. (2004) Two-fold differences are the detection limit for determining transgene copy numbers in plants by real-time PCR. BMC Biotechnol 11: 1–11. [DOI] [PMC free article] [PubMed] [Google Scholar]
- 8. Gachon C, Mingam A, Charrier B (2004) Real-time PCR: what relevance to plant studies? J Ex Bot 55: 1445–1454. [DOI] [PubMed] [Google Scholar]
Associated Data
This section collects any data citations, data availability statements, or supplementary materials included in this article.
Supplementary Materials
Gel electrophoresis products following gradient PCR of (A) Ubi4 and (B) Ubi10 using primers designed by Hong et al. (2008) (Ubi4FW, Ubi4RV and Ubi10Fw, Ubi10Rv) [5] , and primers designed to prime to the 3′-UTR (Ubi4-3Fw, Ubi4-3Rv and Ubi10-3Fw, Ubi10-3Rv). Lanes 1 to 11: temperature gradient from 55 to 65°C at 1°C intervals, Lane 12: no RT control, Lane 13: water only blank, and Lane 14: PCR amplification at 60°C using primers targeting the 3′-UTR. Gel images are representative of 3 independent experiments.
(DOC)
Binding sites of primers Ubi4Fw and Ubi4Rv on Ubi4 and Ubi10 . The directions of priming are indicated by arrows. Mismatches are shown in red.
(DOC)
Binding sites of primers Ubi10Fw and Ubi10Rv on Ubi10 and Ubi4 . The directions of priming are indicated by arrows. Mismatches are shown in red.
(DOC)
Comparison of the 3′-UTR regions of both Ubi4 and Ubi10 and binding sites of Ubi10-3Fw and Ubi10-3-Rv at the 3′-UTR of Ubi10 , and Ubi4-3Fw and Ubi4-3Rv at the 3′-UTR of Ubi4.
(DOC)


